
Technical Analysis
BTC/USDT
SEC Chairman Atkins’ announcement that the innovation exemption for crypto companies will take effect in January 2026 signals a more flexible era for digital asset regulation in the US. Vanguard opening crypto ETF trading on its platform, including BTC, ETH, XRP, and SOL, expands institutional access, while Bank of America highlights the rise in institutional adoption by recommending a 1–4% crypto allocation in portfolios. While the OECD forecasts Fed interest rates to fall to the 3.25–3.50% range by the end of 2026, Fed member Bowman announced that new rules for banks and stablecoin issuers are being prepared.
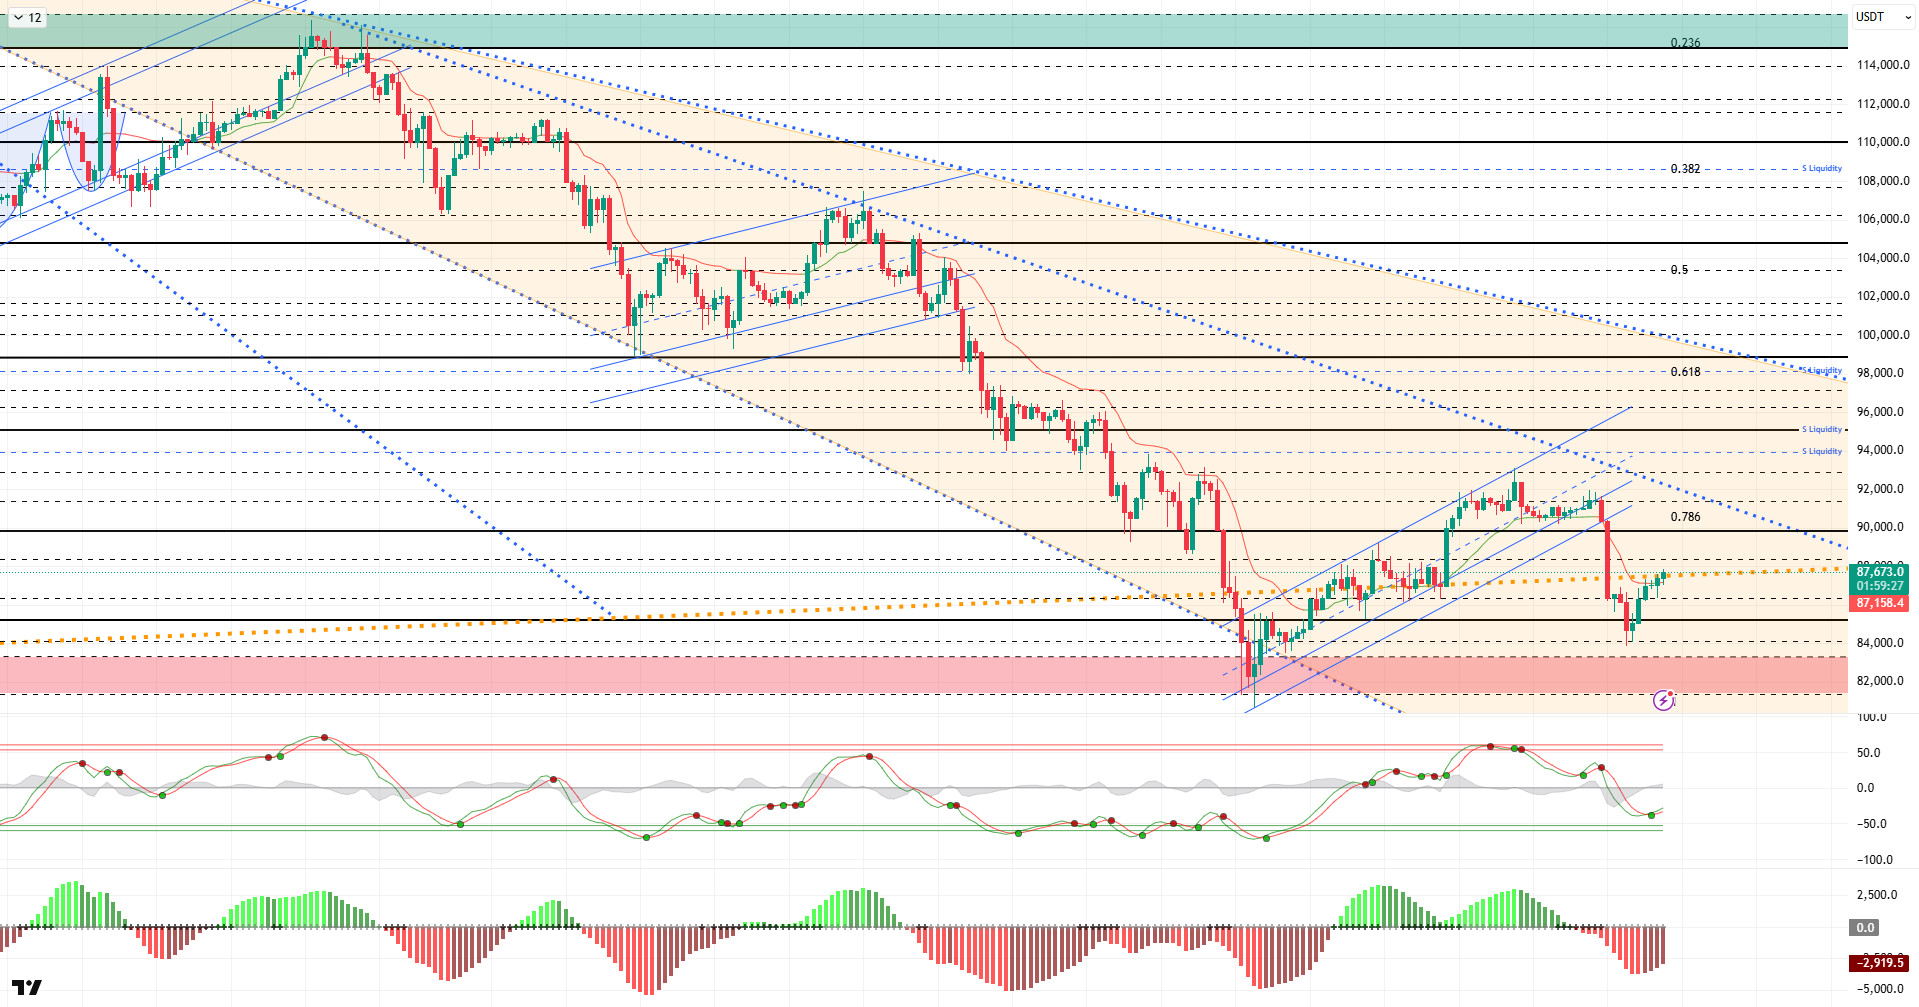
From a technical perspective, BTC continues to exert pressure on the major uptrend line compared to the previous analysis and has also formed its sixth green four-hour candle. At the time of writing, the price is trading at $87,700, while the falling trend structure, which has been maintained within the orange band since October 23, has caused the price to produce lower highs and deeper lows. However, since the $80,500 level, BTC has signaled a breakout from this structure, forming a rising bottom at the $83,800 level. From this point on, the $84,000 level is critical, and the structure can be monitored for continuation in the short term; otherwise, a double bottom scenario comes into play.
Technical indicators show the Wave Trend (WT) oscillator producing a buy signal just above the oversold zone, while the histogram on the Squeeze Momentum (SM) indicator is weakening within the negative zone and attempting to move into positive territory. The Kaufman Moving Average (KAMA) is currently positioned just above the price at the $87,100 level.
According to liquidation data, with the recent decline, buy orders were liquidated first at the 89,000 and 85,000 levels, resulting in liquidation at the 83,000-84,000 band. With the recent decline, 83,800 emerges as the level where a new buy order level has formed. In contrast, the sell order level shows concentration in the short-term 87,000–88,000 range, while concentration continues above the 92,000 level.
In summary, the momentum gained in BTC due to expectations of a Fed interest rate cut has come to an end. While the Bank of Japan’s tightening monetary policy messages put pressure on the markets, it was reported that Trump has selected his nominee for Fed chair and will make an announcement. Technically, the price managed to form an upward channel by increasing its upward momentum with support from the 80,500 bottom region and settled above the 90,000 band for a short time. However, increased selling pressure caused the price to turn downward again and lose the upward channel. Liquidity data indicates that target zones have regained importance and that the market continues to seek equilibrium. After this stage, the price’s move back above the 87,000 level, where the major uptrend line passes, will be closely monitored, as a sustained gain above this level could create upward momentum. On the other hand, if selling pressure intensifies, the 85,000 level will emerge as a critical reference point, while the 84,000 level will be monitored as a support point.
Supports: 85,000 – 84,000 – 83,300
Resistances: 87,000 – 89,000 – 90,000
ETH/USDT
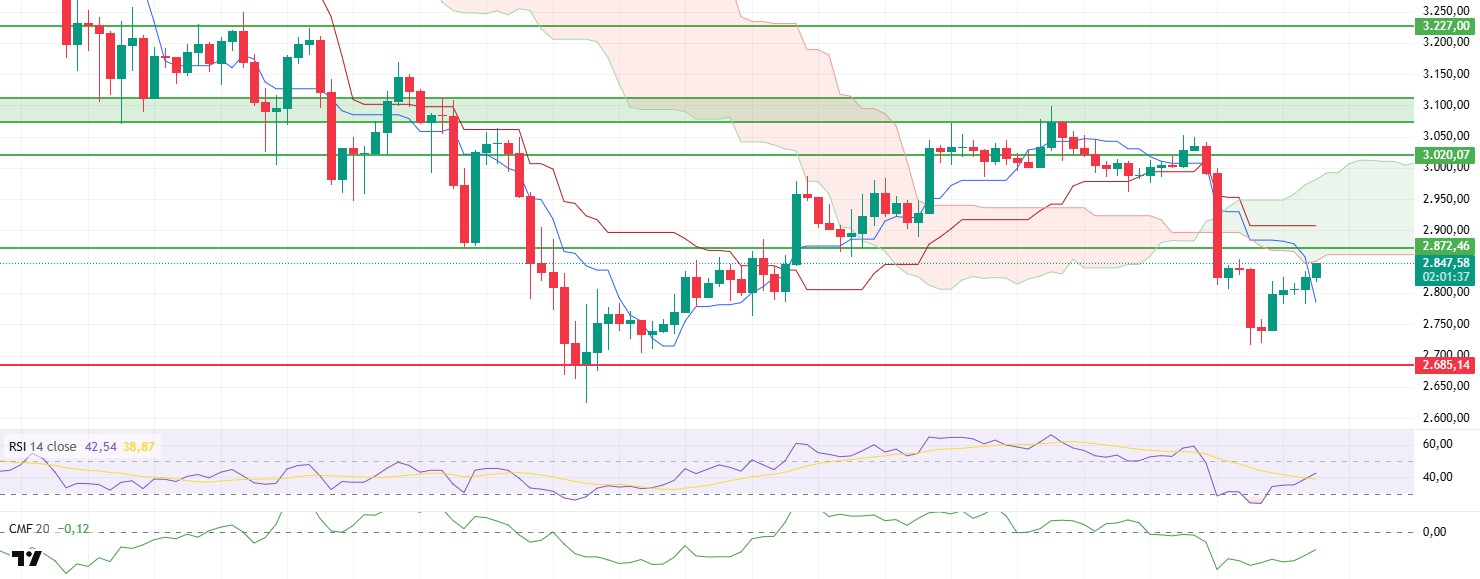
The ETH price managed to rise above the $2,840 level with purchases made during the day. This upward trend indicates that buyers have partially re-entered the market following yesterday’s sharp pullback. However, it should be noted that the current reaction is still fragile.
There is limited improvement on the liquidity side. Although the Chaikin Money Flow (CMF) indicator remains in negative territory, the slowdown in the downward momentum indicates that selling pressure has weakened slightly compared to the previous day. However, for a sustained recovery, the CMF must move into positive territory.
On the momentum side, the Relative Strength Index (RSI) indicator is moving away from the oversold zone, showing a slight strengthening. This provides a positive backdrop for the short-term rebound to continue. However, the RSI has not yet reached levels that would confirm a strong trend reversal.
The trend outlook is under pressure on the Ichimoku side. The price continues to remain below the cloud structure, and sustainability above the Kijun levels cannot be achieved. This structure reveals that buyers are unable to demonstrate an aggressive rebound.
The overall picture looks slightly more stable compared to this morning, but it is too early to say that the downward trend has completely ended. If it manages to stay above $2,840 in the short term, a move towards the $2,870 resistance level is possible. If this level is strongly broken, the price may approach the $3,000 level again. In terms of downside risks, the $2,800 level will be monitored as the first important support. If it falls below this level, the negative scenario we discussed yesterday will come into play again, and a new pullback towards the $2,720 – $2,685 band may occur. In summary, the market has become more balanced since yesterday, but for the trend to turn permanently upward, both liquidity inflows need to strengthen and the price needs to settle above the cloud resistance.
Supports: 2,685 – 2,550 – 2,375
Resistances: 2,870 – 3,020 – 3,227
XRP/USDT
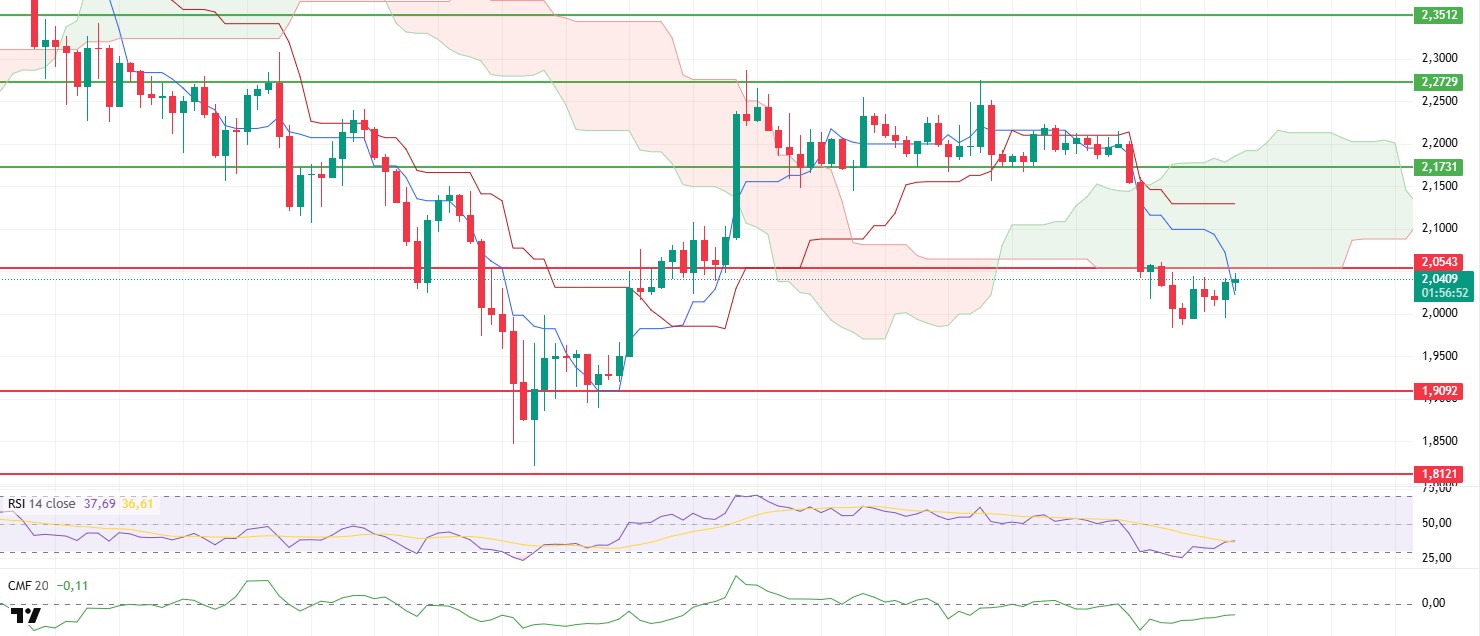
The XRP price managed to rise above the $2.04 level with the purchases made during the day. This movement shows that the weak rebound seen yesterday evening has strengthened a little more today. Although the seller pressure has not completely disappeared, it can be said that buyers have started to return to the market in a more controlled manner.
There has been a limited improvement on the liquidity side. Although the Chaikin Money Flow (CMF) indicator shows signs of an upward recovery, it remains in negative territory. This structure indicates that capital flows are still weak and that the upturns are not based on strong fundamentals.
The momentum picture is slightly more positive. The Relative Strength Index (RSI) indicator rose along with rebound buying and began to support the possibility of a short-term recovery by rising above the MA line. However, the fact that the RSI is still below the 50 level indicates that buyers have not yet gained full control of the market.
The technical outlook is complex. The price managed to rise above the Tenkan level, but from the Ichimoku cloud perspective, it is still trading below the cloud. This indicates that the trend has not yet entered positive territory and that short-term gains may remain under pressure.
Although the overall structure appears more optimistic compared to yesterday’s outlook, it is difficult to speak of a strong rise without maintaining stability above critical levels. In particular, the $2.05 level continues to be the main resistance point. Breaking this level and achieving stable pricing above it could bring the targets of $2.12 and then $2.17 into focus. In the opposite scenario, if the price falls back below $2.00, it could accelerate the continuation of the downtrend, and the $1.95–$1.90 range could come back into play. In summary, there is a desire for recovery, but for XRP to clearly turn its direction upward, both liquidity needs to strengthen and the pressure above the cloud’s lower band needs to be broken.
Supports: 1.9092 – 1.8121 – 1.6224
Resistances: 2.0543 – 2.1731 – 2.2729
SOL/USDT
DeFi Development Corp partnered with Harmonic to increase Solana Validator revenue.
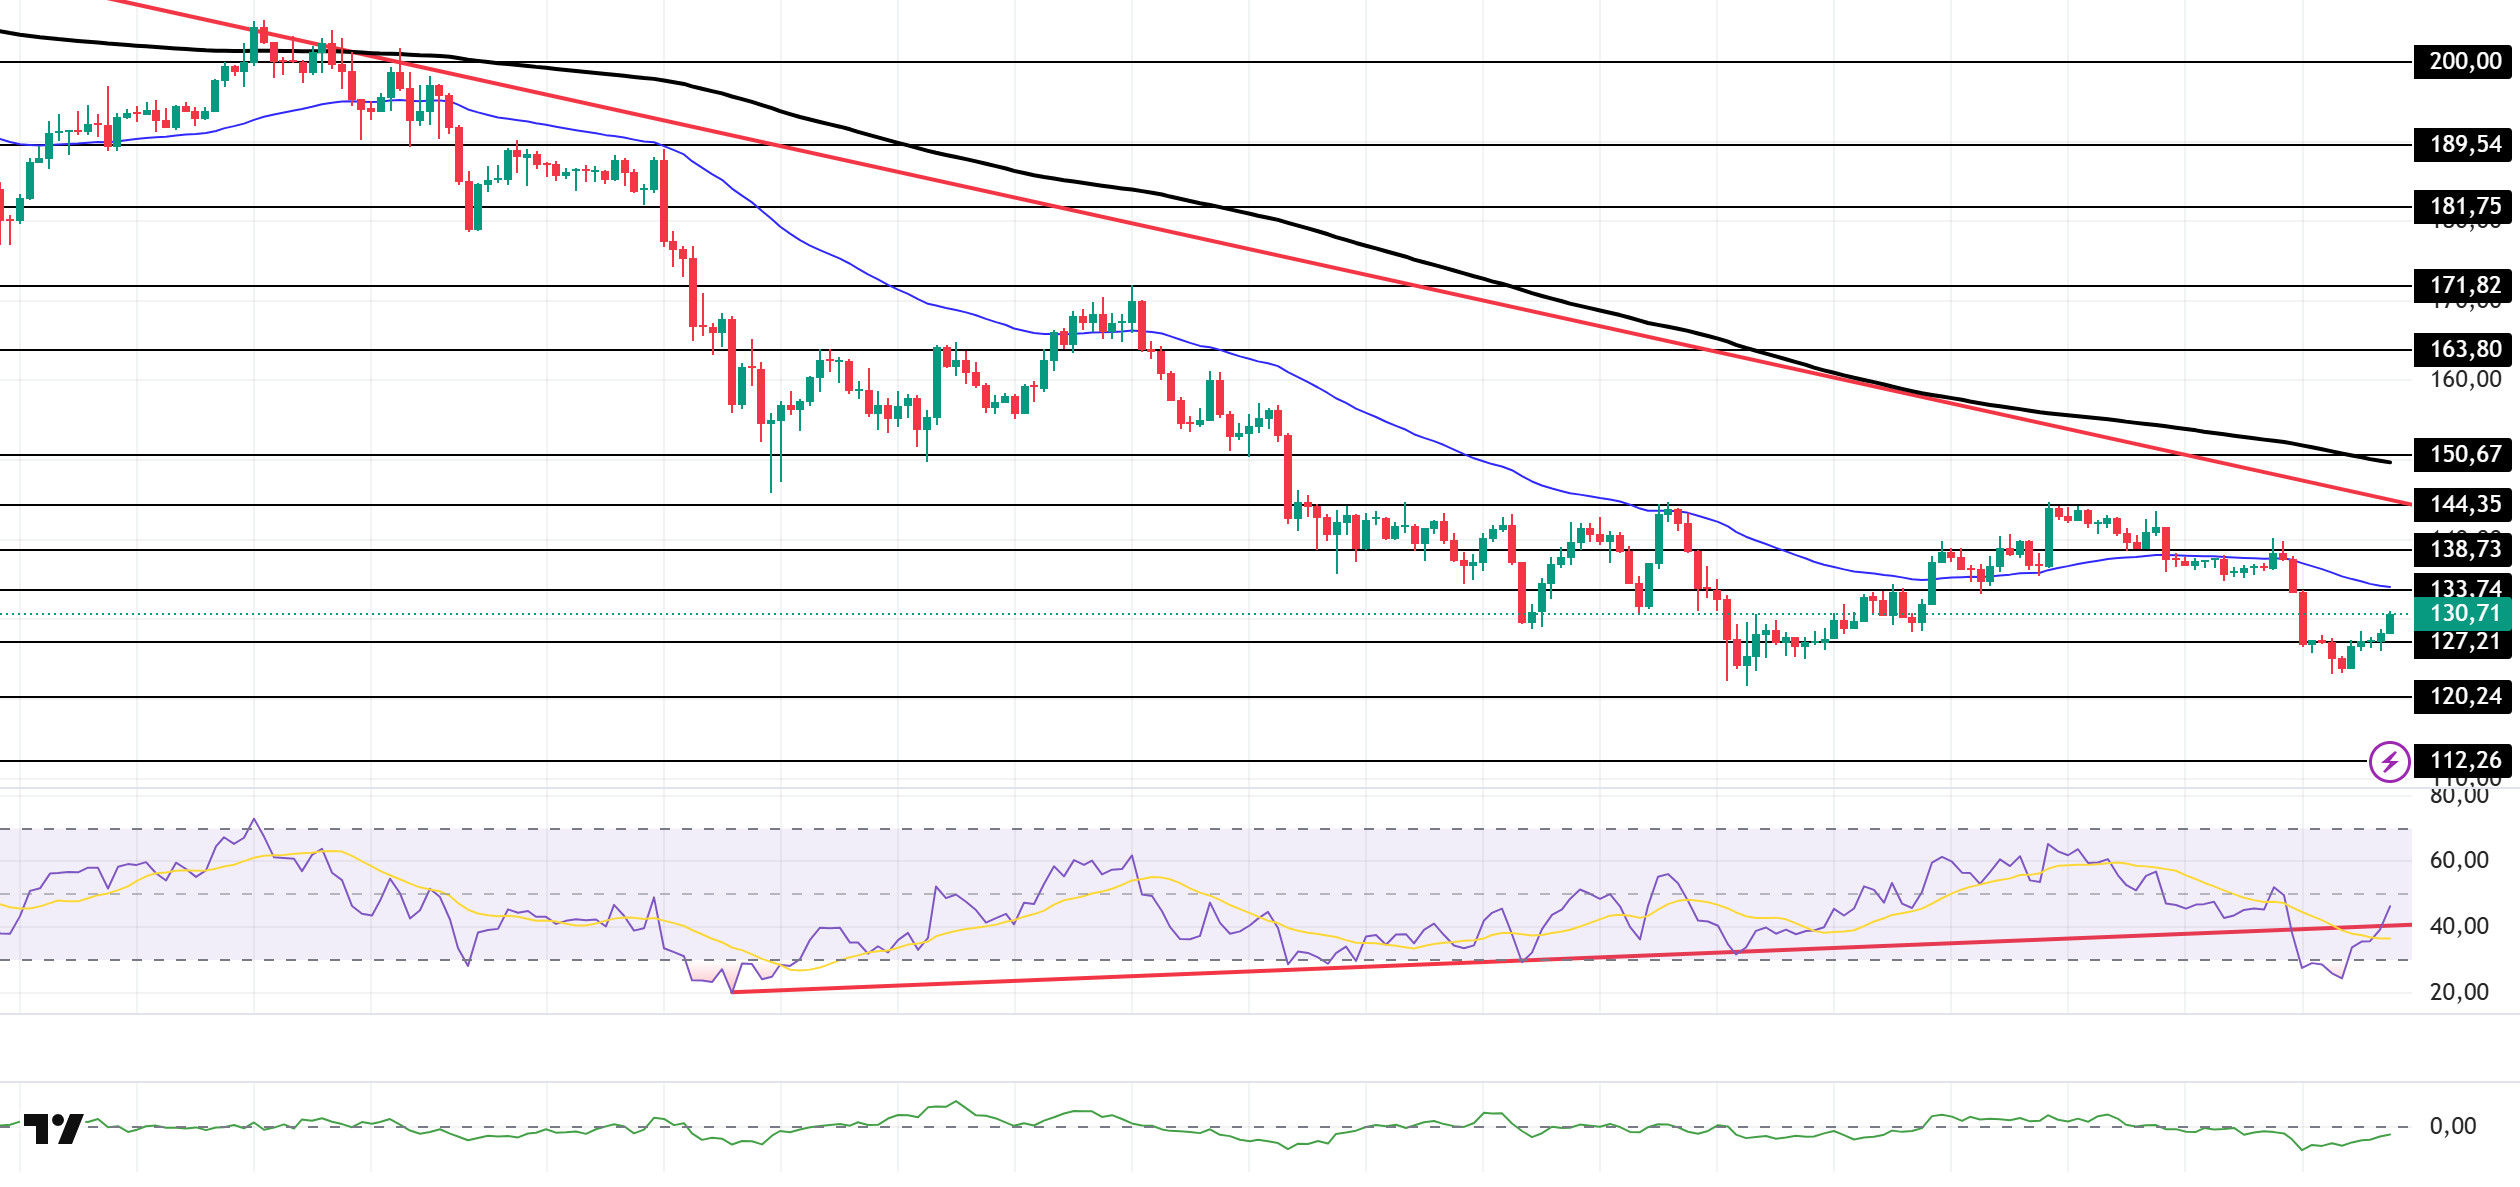
The SOL price experienced a slight increase during the day. The asset remained in the lower region of the downward trend that began on October 6. Testing the strong resistance level of $127.21, the price gained momentum and rose from there. Currently, the asset is preparing to test the 50 EMA (Blue Line) moving average as resistance. If it closes above this level, it could test the 50 descending trend line as resistance. In case of a pullback, the $120.24 level should be monitored.
On the 4-hour chart, it continued to remain below the 50 EMA (Exponential Moving Average – Blue Line) and 200 EMA (Black Line). This indicates that it may be in a downtrend in the medium term. At the same time, the price being below both moving averages shows us that the asset is trending downward in the short term. The Chaikin Money Flow (CMF-20) remained in negative territory. However, an increase in money inflows could push the CMF into positive territory. The Relative Strength Index (RSI-14) rose from oversold territory, signaling that buying appetite may be forming. At the same time, it crossed into the upper region of the rising line that began on November 4. This could increase buying pressure. If there is an uptrend due to macroeconomic data or positive news related to the Solana ecosystem, the $144.35 level stands out as a strong resistance point. If this level is broken upwards, the uptrend is expected to continue. In case of pullbacks due to developments in the opposite direction or profit-taking, the $112.26 level could be tested. A decline to these support levels could increase buying momentum, presenting a potential upside opportunity.
Supports: 127.21 – 120.24 – 112.26
Resistances: 133.74 – 138.73 – 144.35
DOGE/USDT
The DOGE price showed a slight increase. The asset gained value by gaining downward momentum starting on November 11. As of now, the asset is poised to test the 50 EMA (Blue Line) moving average as resistance. If it breaks through this level, it could test the 200 EMA (Black Line) moving average as resistance. In the event of a pullback, the downward trend could act as support again.
On the 4-hour chart, the 50 EMA (Exponential Moving Average – Blue Line) remained below the 200 EMA (Black Line). This indicates that a medium-term downtrend may begin. The price being below both moving averages shows that the price is trending downward in the short term. The Chaikin Money Flow (CMF-20) is in negative territory. Additionally, the balance of money inflows and outflows may keep the CMF in negative territory. The Relative Strength Index (RSI-14) accelerated from the oversold zone to the middle of the negative zone. At the same time, it continued to remain below the downward trend that began on November 26. This signaled that selling pressure was continuing. In the event of a rise due to political developments, macroeconomic data, or positive news flow in the DOGE ecosystem, the $0.14952 level stands out as a strong resistance zone. Conversely, in the event of negative news flow, the $0.12824 level could be triggered. A decline to these levels could increase momentum and start a new wave of growth.
Supports: 0.13367 – 0.12824 – 0.12282
Resistances: 0.14237 – 0.14952 – 0.15680

AVAX/USDT
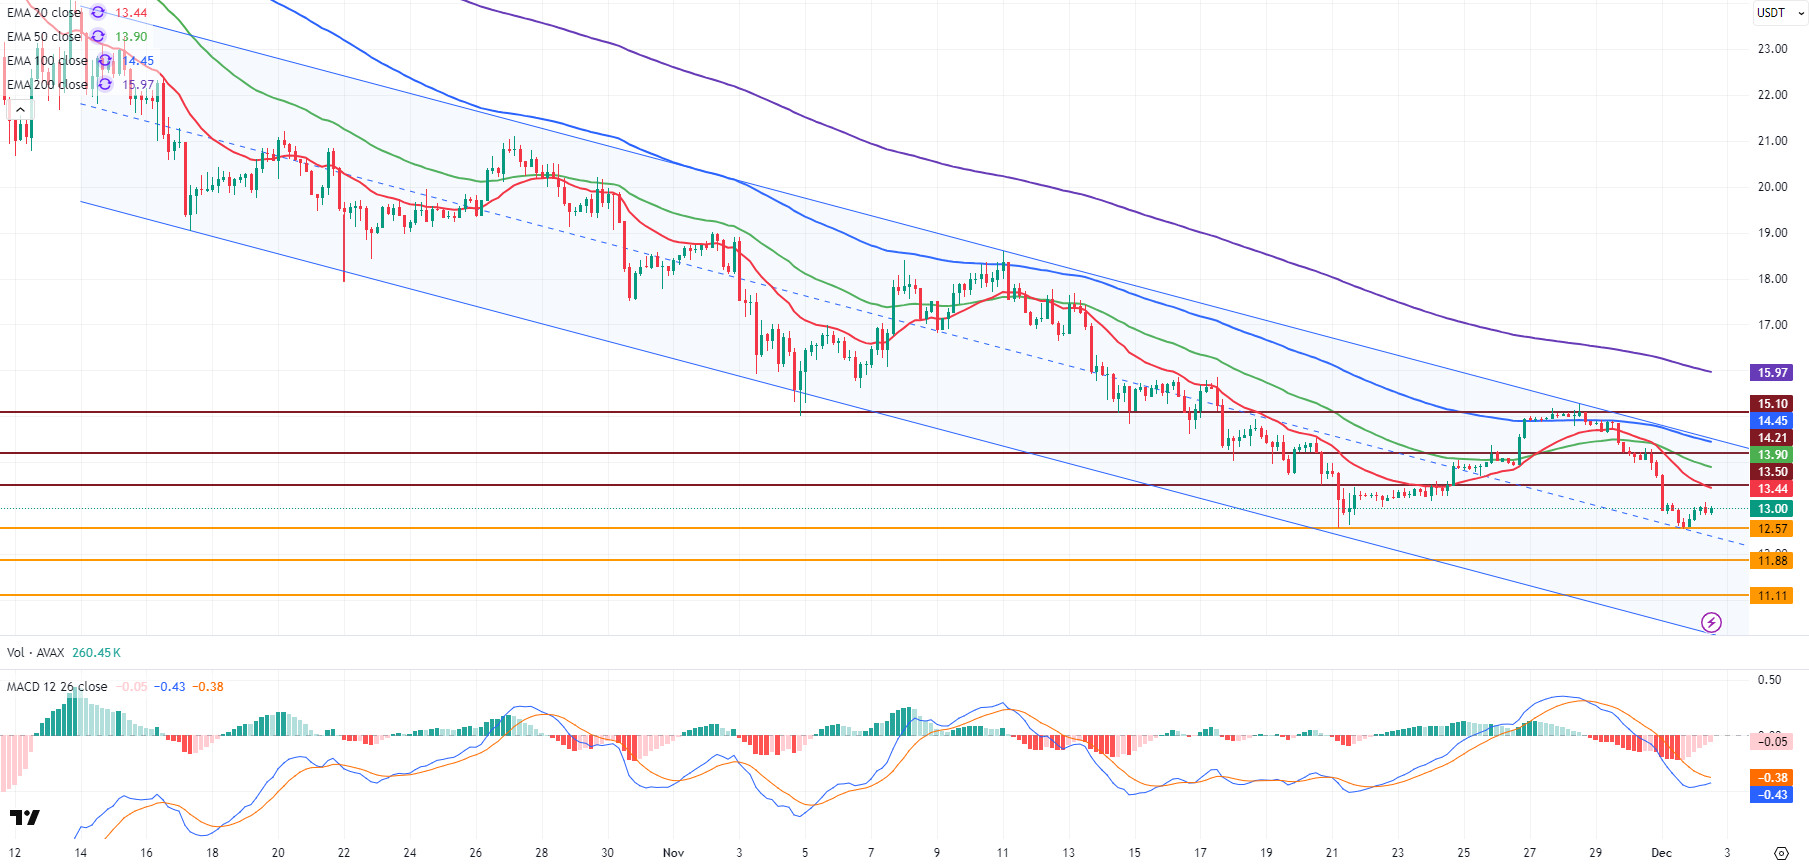
Starting at $12.76 today, AVAX began the new day with an uptrend and rose to $13.13. However, the uptrend was limited due to selling pressure in this region. AVAX continues to trade within a horizontal band at the $13 level. Due to weak momentum in recent days, AVAX’s rises are stuck at resistance levels, while declines can be faster. Positive news flow from the Avalanche ecosystem, combined with low volume in the broader crypto market and risk-off sentiment, is preventing a strong positive impact on the price in the short term. AVAX continues to trade within a bearish channel. Although trading above the channel’s middle band is a positive signal in the short term, it is difficult to talk about a strong trend reversal without approaching the upper band of the channel.
On the 4-hour chart, the Moving Average Convergence/Divergence (MACD) line remains below the signal line and continues to trade in negative territory. This indicates that selling pressure has not fully subsided and momentum remains weak. The MACD being both below the signal line and in negative territory supports the negative scenario in the technical outlook. For a recovery to gain strength in the short term, the MACD line needs to move upward, break the signal line, and rise towards positive territory. Otherwise, upward attempts may continue to face selling pressure at resistance levels. AVAX continues to trade below critical Exponential Moving Average (EMA) levels. These EMA levels form a strong resistance band, especially in the short and medium term. Despite these negative conditions, the fact that AVAX has not fallen below the middle band within the bearish channel is a positive development.
From a technical perspective, the $12.57 level is the first significant support for AVAX in downward movements. Closing below this level for the next four hours could increase selling pressure and cause AVAX to retreat to support levels of $11.88 and $11.11, respectively. On the upside, the $13.50 level and the EMA20 level stand out as the first important resistance. If AVAX manages to stay above this level, it could attempt to rise towards the $14.21 and $15.10 resistance zones. However, both the MACD being in negative territory and the price trading below all EMAs indicate that the trend remains negative in the short term. In the absence of a significant increase in trading volume and sustainability above the $13.50 level ( ), AVAX is likely to remain under pressure within the bearish channel, with upward attempts remaining limited.
(EMA20: Red Line, EMA50: Green Line, EMA100: Blue Line, EMA200: Purple Line)
Supports: 12.57 – 11.88 – 11.11
Resistances: 13.50 – 14.21 – 15.10
LINK/USDT
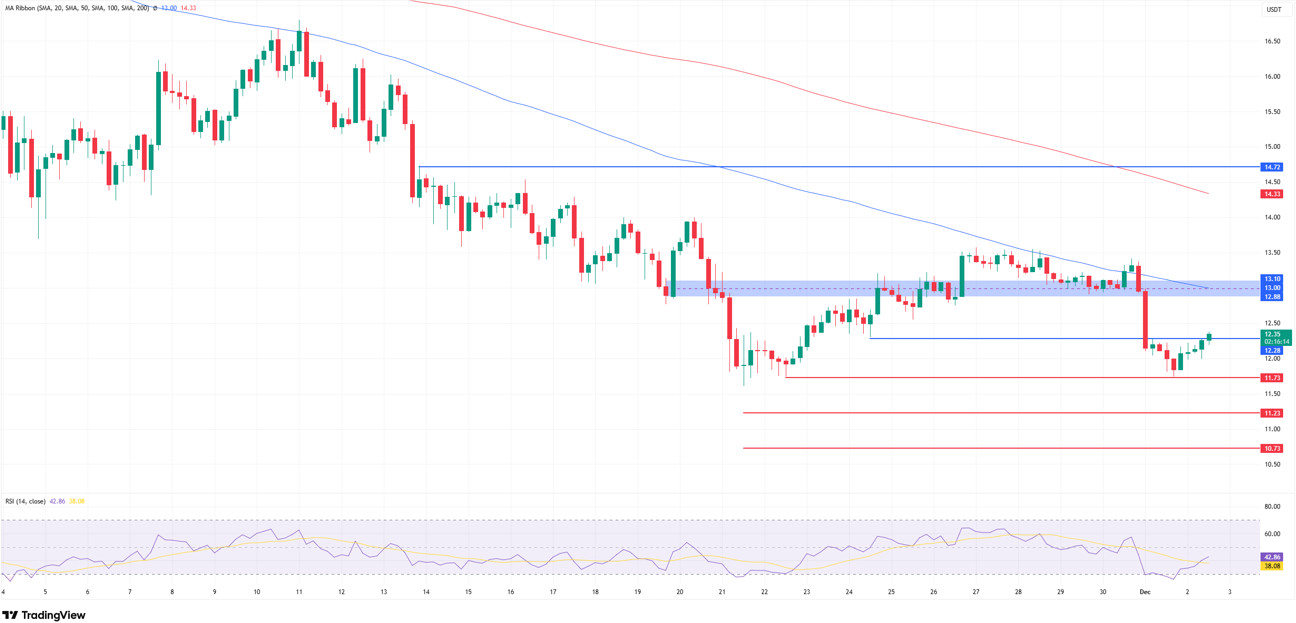
The first Chainlink spot ETF in the US began trading today. The fact that no trading fees will be charged for the first 3 months for the GLINK fund launched by Grayscale stands out as a step that could generate short-term interest, especially on the institutional side. While the news flow is generally positive, confirming technical levels remains important to be able to talk about a lasting effect on pricing. The price has risen above our resistance level of $12.28, which we highlighted in this morning’s analysis, but it will be important for risk management to see a 4-hour closing candle.
Looking at the chart structure, we see that the $12.28 level is the first critical barrier. It may be quite difficult to talk about an upward trend reversal without the price producing a sustained 4-hour close above this level. If 12.28 is breached, the 12.88–13.10 zone becomes a strong target. This area is where the 100-day moving average resides and also aligns with the reversal zone of the recent correction structure, making it a potential area where gains could be capped.
In downward price movements, the 11.73 level continues to be the first short-term support. However, if this level is lost, selling pressure may accelerate again and push the price first to the 11.23 level and then to the 10.73 dollar zone. Overall, it is possible to say that the price is still in a medium-term correction phase. However, if we see 4-hour closes above $12.88, we can say that the target is $14 and above.
Although we see the Relative Strength Index (RSI) recovering with a reaction from the oversold zone, the fact that it has not been able to break above the 45–50 band shows that momentum does not yet support a trend change. Therefore, when both the price structure and the RSI are evaluated together, we can say that the current upward movement does not produce a permanent reversal signal, but is a reaction movement towards resistance zones.
Supports: 11.73 – 11.23 – 10.73
Resistances: 12.28 – 12.88 – 13.10
Legal Notice
The investment information, comments, and recommendations contained herein do not constitute investment advice. Investment advisory services are provided individually by authorized institutions taking into account the risk and return preferences of individuals. The comments and recommendations contained herein are of a general nature. These recommendations may not be suitable for your financial situation and risk and return preferences. Therefore, making an investment decision based solely on the information contained herein may not produce results in line with your expectations.

