
Technical Analysis
BTC/USDT
US Treasury Secretary Bessent announced that Fed Chairman Powell’s dismissal is not on the agenda and that Powell has no intention of resigning from the board of directors. Japanese Prime Minister Shigeru Ishiba denied reports that he would resign and stated that he would continue in his position. The European Union announced that it is preparing retaliatory tariffs worth approximately 100 billion euros in response to Trump’s 30% tariff plan. Bitcoin mining company MARA Holdings announced that it plans to raise funds for potential Bitcoin purchases by issuing $850 million in convertible bonds.
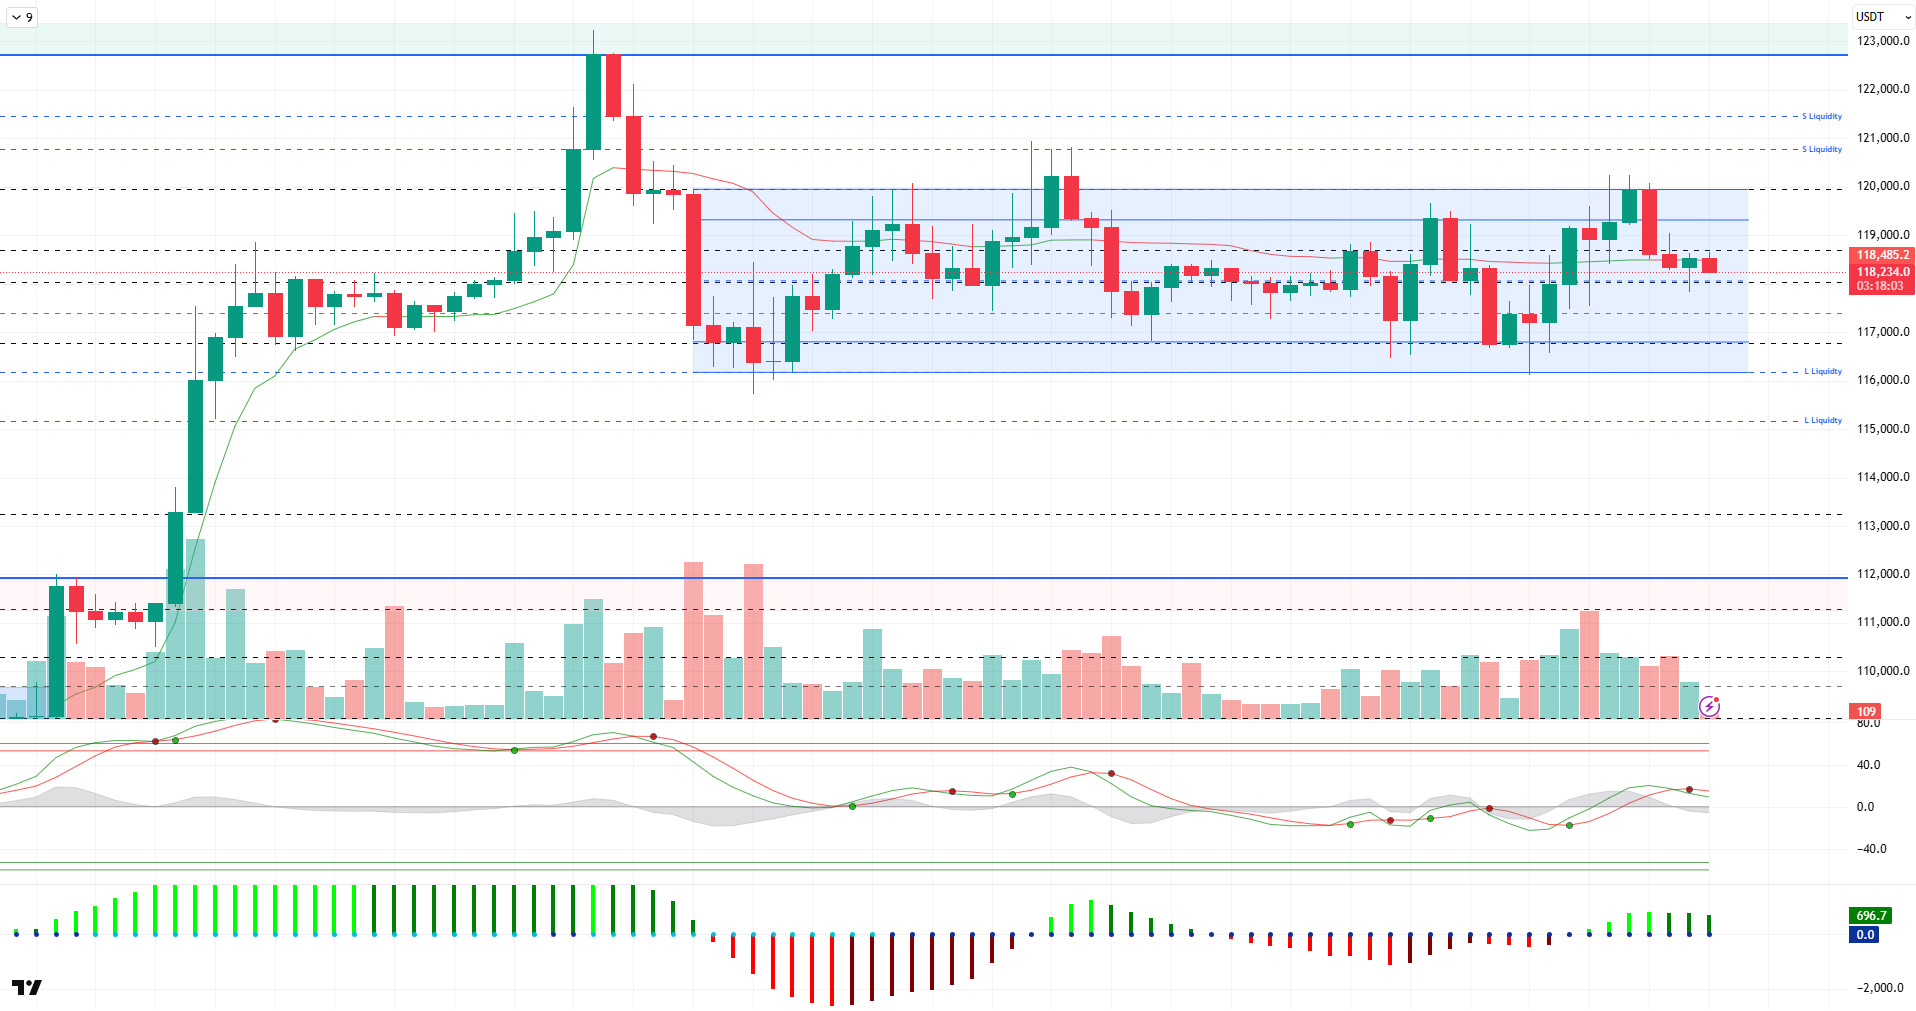
Looking at the technical picture, the BTC price continues to consolidate horizontally near its ATH level. BTC, which has been moving in the 116,000 – 119,000 band for some time, occasionally dips below these levels but then rebalances within this range. Compared to the previous analysis, BTC has not experienced any significant changes and continues to trade at the 118,200 level.
Looking at technical indicators, the Wave Trend (WT) oscillator continues to move within the middle band of the channel following the recent decline, though it appears to be weakening. The histogram of the Squeeze Momentum (SM) indicator has regained momentum and moved into the positive zone, but has not yet gained significant momentum. The Kaufman moving average is currently at the 118,500 level, just above the price.
When liquidity data is examined, the buy level stands out at 115,000, while the sell level is concentrated above 120,000. The price’s liquidity zones are highlighted as areas where reactions are expected.
In summary, with fundamental developments continuing to contribute positively to pricing, the price continues to consolidate near the ATH level. The technical outlook is causing horizontal movements with an indecisive structure in the short term, while liquidity data is determining the limits of price movements. A sustained rise above the 120,000 minor resistance level could bring new ATH levels into focus. In the event of a potential sell-off, a close below the 118,600 support level could drive the price toward the 115,000 liquidity level.
Supports 118,600 – 117,500 – 116,800
Resistance 120,000 – 121,000 – 123,300
ETH/USDT
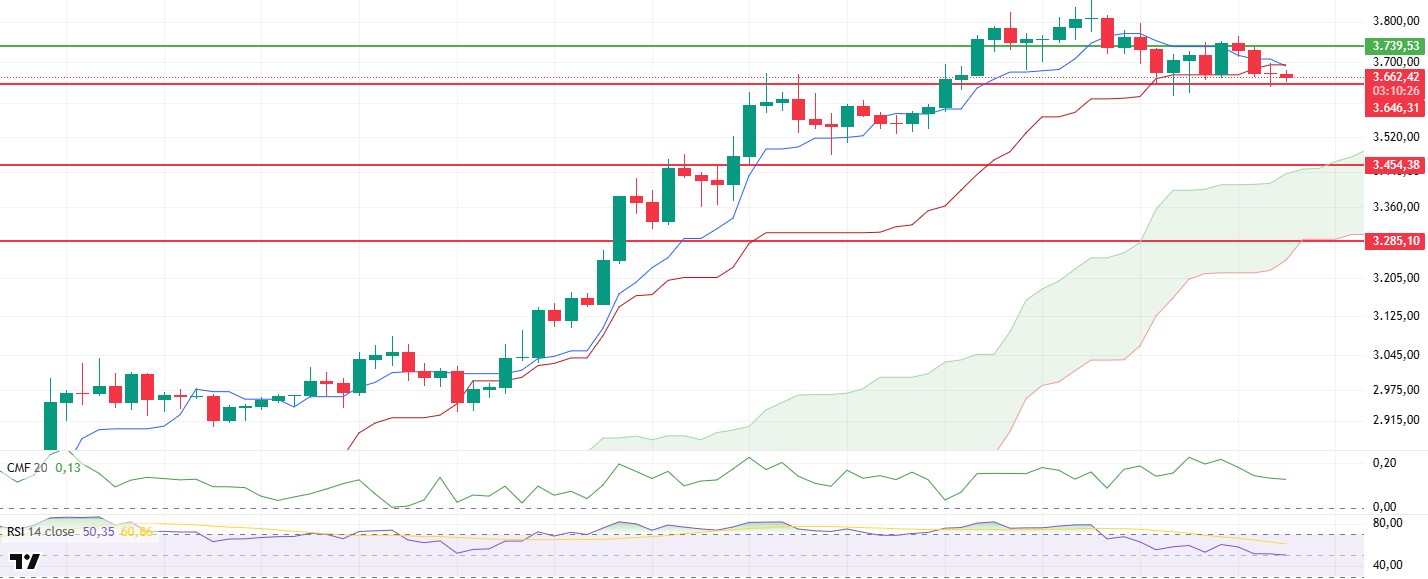
The ETH price fell back to $3,646 during the day, in line with expectations. This level was the first point where short-term rebound buying came in, as it had been acting as a strong demand zone in recent days. Indeed, the price managed to briefly regain the $3,670 level following the reaction from this support. However, this rally was not sustainable, and the price has since retreated back to the $3,646 support level amid selling pressure in the final hours. The volatility around this level clearly highlights the indecisive nature of investors and the market’s search for direction.
On the technical indicators side, the Relative Strength Index (RSI) indicator has fallen to 50 along with price movements. This threshold is generally considered a neutral zone, but it could be important for an upward recovery if it acts as support. However, if the RSI drops below the 50 level, it could signal a weakening of momentum and potentially lead to a strengthening of the short-term downward trend.
The Chaikin Money Flow (CMF) indicator continues to show a downward trend. Although the CMF remains in positive territory, the gradual decline in liquidity outflows indicates weakening buying appetite and slowing capital inflows. If the CMF crosses below the zero level, this could be interpreted as a signal that selling pressure may become more pronounced.
Although there is no clear confirmation of a trend reversal from the Ichimoku indicator, a classic sell signal has formed with the tenkan level crossing below the kijun level. If this crossover continues and the tenkan level remains below the kijun level in the coming hours, the downward trend could deepen. Additionally, if the price dips below the cloud within the Ichimoku indicator, this could trigger a technically negative medium-term outlook.
Within this context, if the $3.646 support level is broken downward, the decline is likely to accelerate and the price may retreat to the next support level at $3.454. This area is a structural support level where the price has previously shown strong reactions. On the other hand, if the 3,646 dollar level holds and a new upward equilibrium forms, the price is expected to first settle above 3,670 dollars, followed by the 3,739 dollar resistance level becoming a target again. In this scenario, a volume-supported breakout could strengthen short-term positive momentum.
Supports 3,646 – 3,455 – 3,285
Resistances 3,739 – 4,084 – 4,381
XRP/USDT
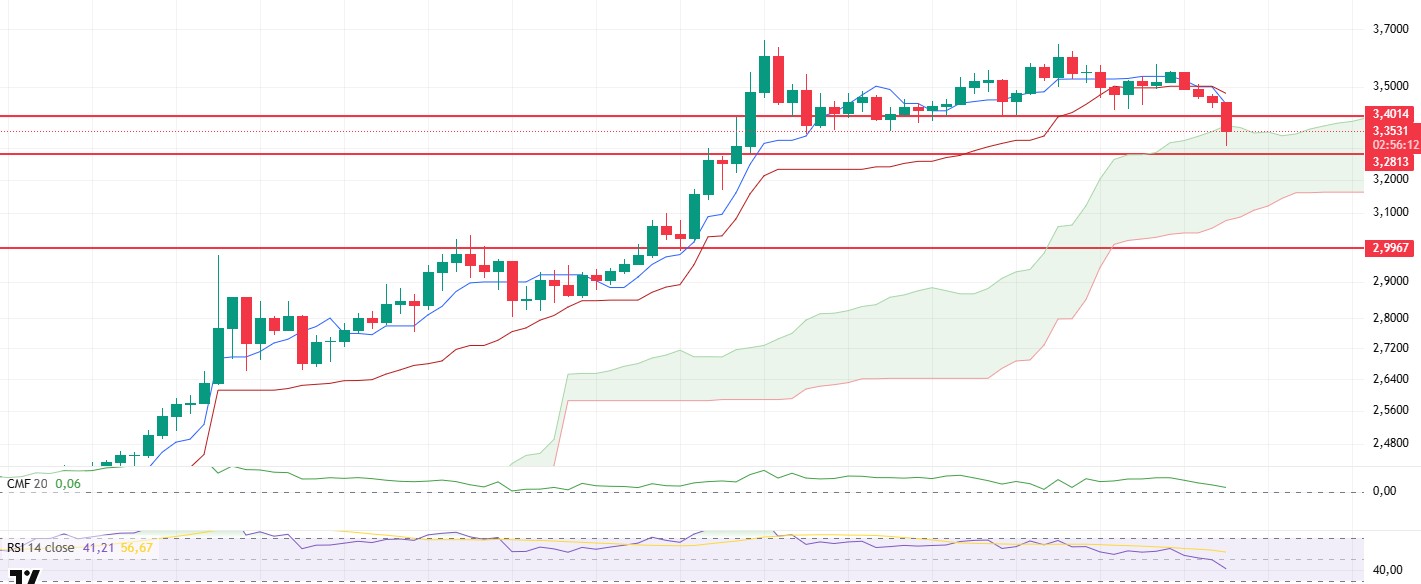
After losing the $3.40 level during the day, the XRP price faced a sharp sell-off and, as a result of this pressure, fell back to the Ichimoku indicator’s kumo cloud, reaching the $3.30 level. This movement indicates that the short-term technical structure has weakened and that the market has entered a period of uncertainty regarding its direction. Especially since the 3.40 dollar level has been a key psychological and technical threshold in recent days, a close below this level suggests that the bearish trend is gaining momentum in the market.
When examining the Ichimoku indicator, a classic sell signal has formed with the tenkan level crossing below the kijun level. This crossover typically confirms the start of short-term weakness. The price entering the Kumo cloud increases directional uncertainty, while a potential pullback toward the lower band of the cloud could strengthen the likelihood of the overall technical structure turning negative. In particular, if the price dips below the Kumo cloud, it becomes possible to confirm a medium-term downtrend scenario.
The Momentum and Relative Strength Index (RSI) indicators also broke down significantly with this decline. The RSI falling below the neutral zone indicates that buying power in the market is weakening and that selling pressure is dominant in the short term. Similarly, the deterioration in momentum shows that the price is struggling to respond upward and that negative momentum is becoming apparent.
On the other hand, the Chaikin Money Flow (CMF) indicator continues to remain in positive territory, which is interesting. This suggests that, despite selling pressure, liquidity outflows have remained limited across the market and that structural buyer interest has not completely disappeared. The CMF’s persistence in the positive zone can be interpreted as an indicator supporting the possibility that a recovery scenario has not been completely ruled out.
Overall, it appears that the critical area that will determine the short-term direction of the XRP price will be the kumo cloud region. If the price stabilizes within this region and manages to rise above the $3.40 level again, this downward movement could remain a technical correction. However, if the price remains below the 3.40 dollar level, especially if it dips below the Kumo cloud, there is a high risk of further declines extending down to the 3.28 dollar support zone. Therefore, the price movement within the 3.30-3.40 dollar range over the coming hours will be decisive for the short-term direction.
Supports 3.2813 – 2.9967 – 2.8434
Resistances 3.4014 – 3.8615 – 4.0000
SOL/USDT
Mercurity Fintech Holding Inc. (Nasdaq: MFH) announced that it has secured a strategic $200 million credit facility from Solana Ventures Ltd. Franklin filed an updated version of its spot Solana ETF S-1 application. VanEck Solana was listed on the DTCC under the ticker symbol $VSOL.
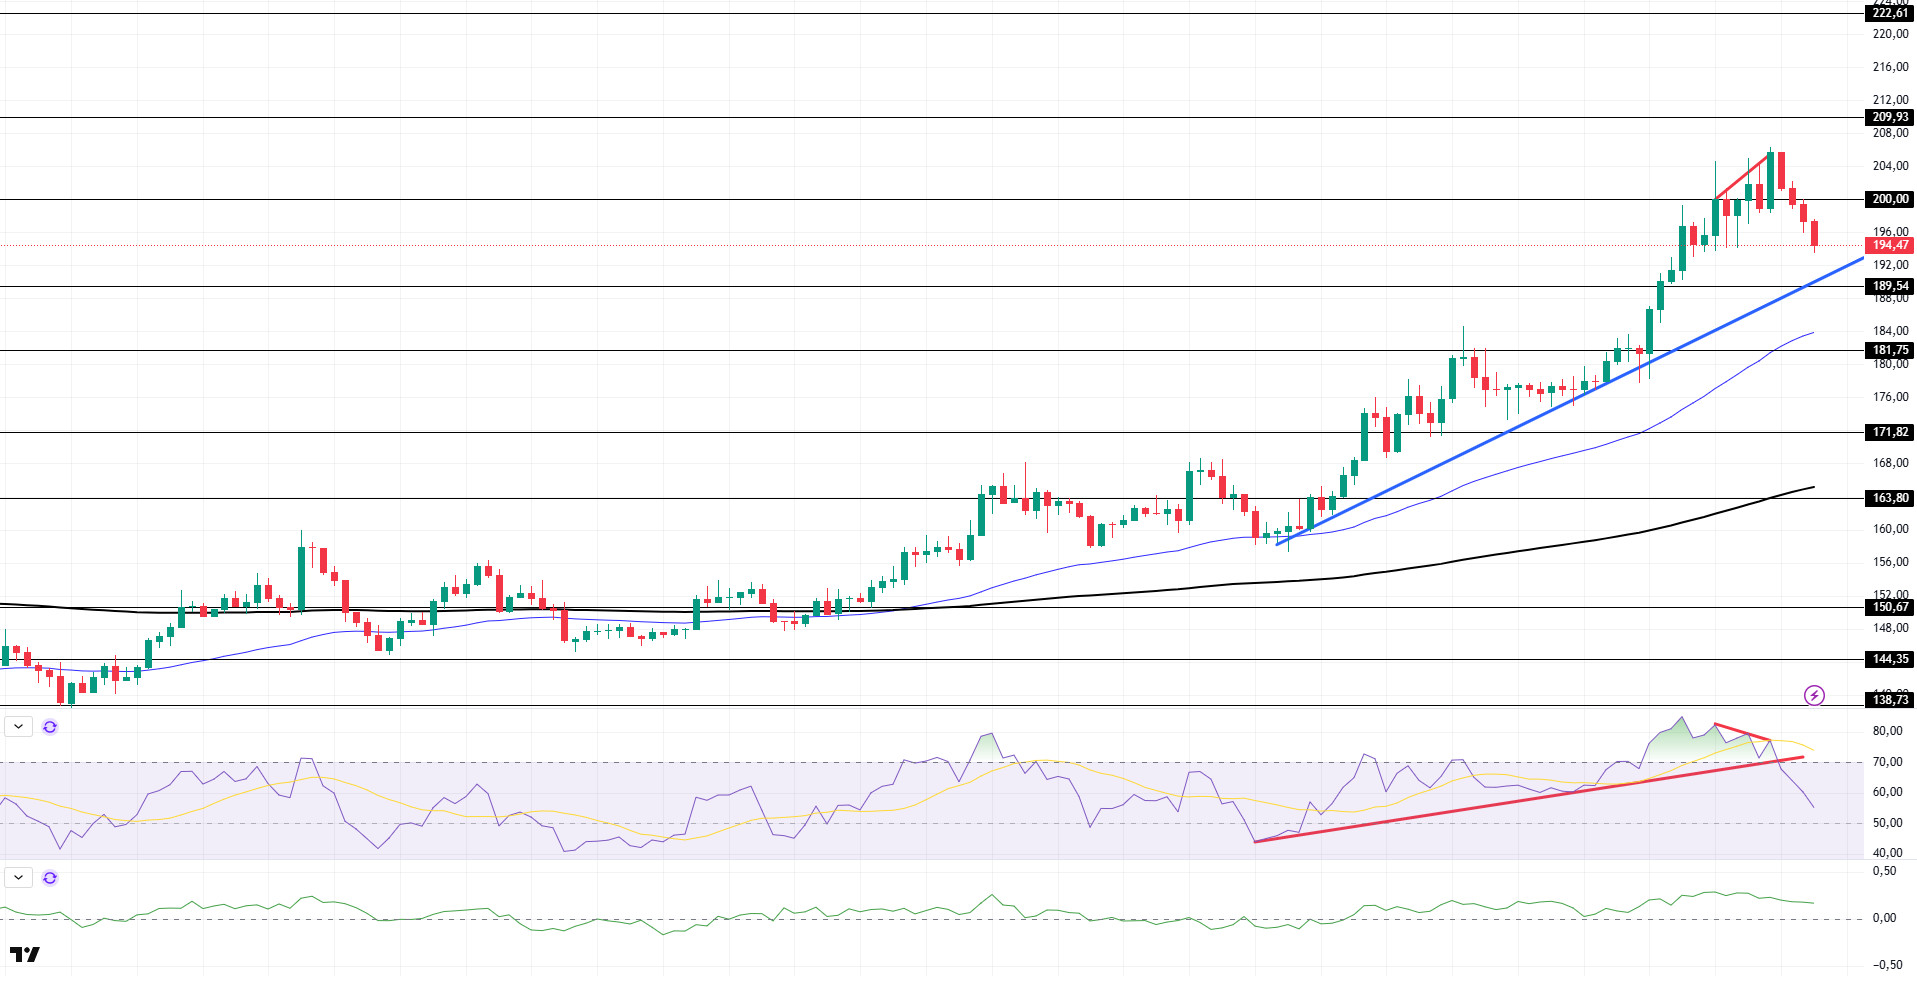
SOL price experienced a pullback during the day. The asset continues to remain above the upward trend that began on July 15. After experiencing a pullback from the $200.00 level, the asset continued its decline. If the pullback continues, it may test the upward trend as a support level. If the upward trend continues, it could test the 209.93 dollar level.
On the 4-hour chart, the 50 EMA (blue line) remains above the 200 EMA (black line). This indicates that the medium-term uptrend may continue. At the same time, the fact that the price is above both moving averages shows that the market is currently trending upward in the short term. On the other hand, a large difference between the two moving averages could trigger a decline or a sideways trend. Chaikin Money Flow (CMF-20) remained in positive territory. However, a decrease in money inflows could push the CMF into negative territory. The Relative Strength Index (RSI-14) remained in positive territory, falling from the overbought zone and retreating to the middle of the positive zone. At the same time, selling pressure has formed. Additionally, a negative divergence has emerged, which could lead to a decline. Furthermore, the upward trend that began on July 15 has been broken downward. If there is an upward movement due to macroeconomic data or positive news related to the Solana ecosystem, the $209.93 level stands out as a strong resistance point. If this level is broken upward, the upward trend is expected to continue. In the event of developments in the opposite direction or profit-taking, a pullback to the 189.54 dollar level could occur. A decline to these support levels could see an increase in buying momentum, potentially presenting an opportunity for an upward move.
Supports 189.54 – 181.75 – 171.82
Resistances 200.00 – 209.93 – 222.61
DOGE/USDT
21shares filed an amended S-1 form for a Dogecoin ETF.
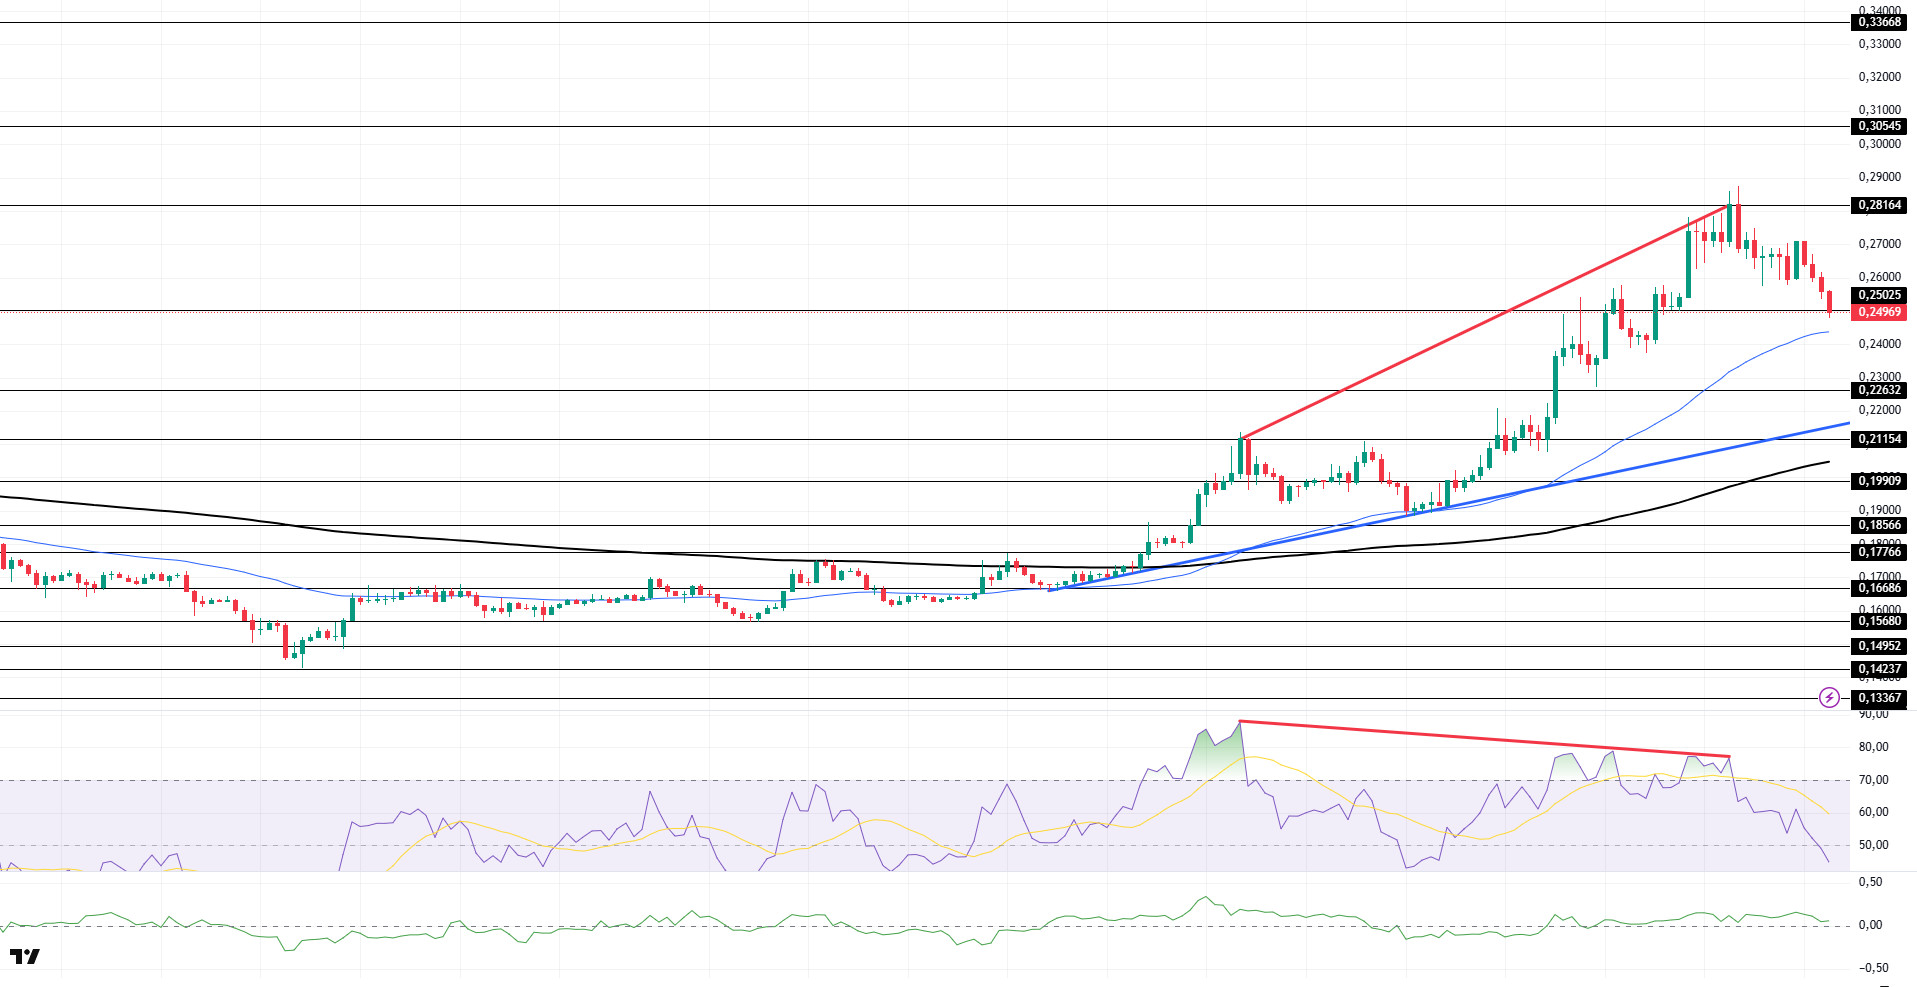
The price of DOGE continued to decline during the day. The asset remained above the 200 EMA (Black Line) and 50 EMA (Blue Line) moving averages, continuing the upward trend that began on July 7. The asset tested the $0.28164 level but failed to sustain its momentum, leading to a pullback from this point. If the pullback continues, the $0.25025 level should be monitored. In the event of a resumption of upward momentum, the $0.28164 level could be tested again.
On the 4-hour chart, the 50 EMA (Blue Line) remains above the 200 EMA (Black Line). This indicates that the asset is in an upward trend in the medium term. The price being above both moving averages indicates that the asset is in an upward trend in the short term. A large difference between the two moving averages may cause the price to decline or move sideways. Chaikin Money Flow (CMF-20) remained in positive territory. Additionally, negative cash inflows could push the CMF into the negative zone. The Relative Strength Index (RSI-14) has retreated to the middle of the positive zone. Furthermore, a regular divergence formation is present. This could cause the price to fall further. In the event of an uptrend driven by political developments, macroeconomic data, or positive news flow in the DOGE ecosystem, the $0.28164 level stands out as a strong resistance zone. In the opposite scenario or in the event of negative news flow, the 0.25025 dollar level could be triggered. A decline to these levels could increase momentum, potentially sparking a new upward wave.
Support 0.25025 – 0.22632 – 0.21154
Resistance levels 0.28164 – 0.30545 – 0.33668
Legal Notice
The investment information, comments and recommendations contained herein do not constitute investment advice. Investment advisory services are provided individually by authorized institutions taking into account the risk and return preferences of individuals. The comments and recommendations contained herein are of a general nature. These recommendations may not be suitable for your financial situation and risk and return preferences. Therefore, making an investment decision based solely on the information contained herein may not produce results in line with your expectations.

