Technical Analysis
BTC/USDT
Trump added $620 million to his net worth thanks to his crypto ventures, accelerating his shift from a traditional real estate-driven wealth structure to digital assets. On the other hand, US Treasury Secretary Bessant stated that the Fed may cut interest rates before September and the impact of tariffs on inflation remains limited. Today, US jobless claims, non-farm payrolls and Fed member Bostic’s statements will be followed in the data set.
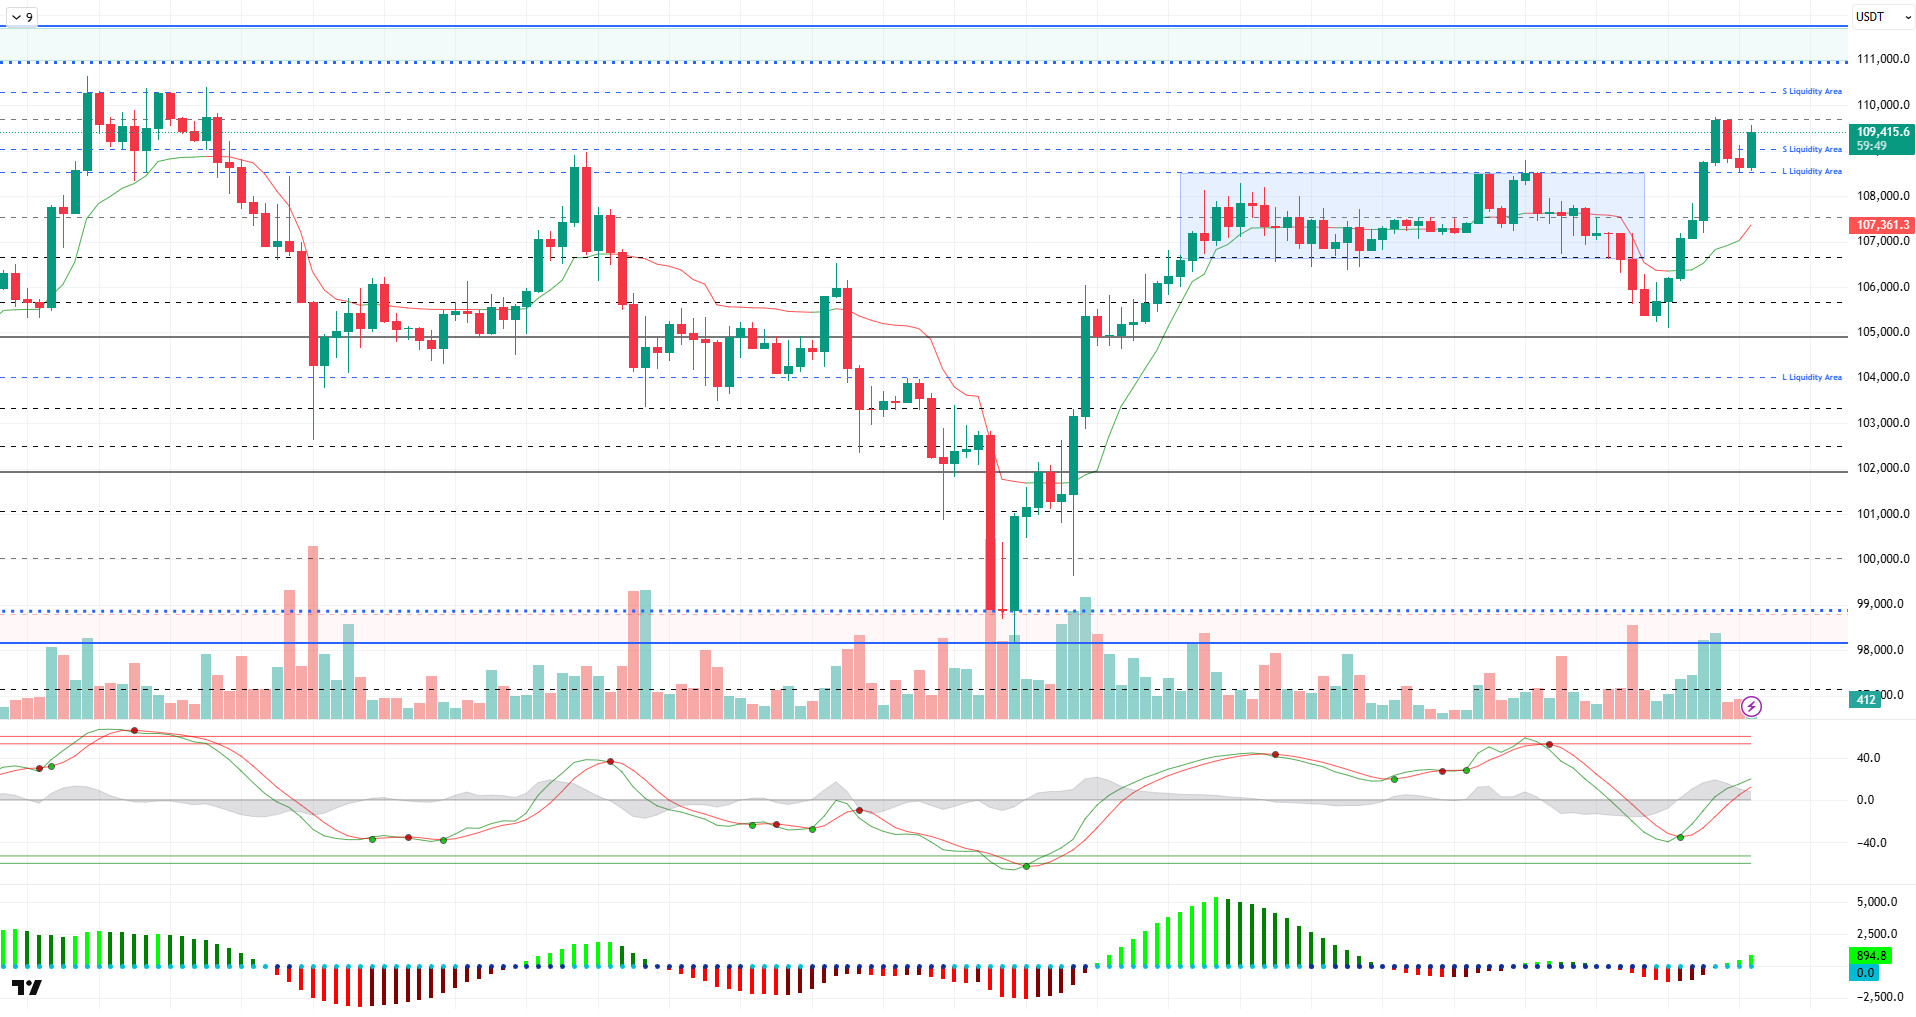
Looking at the technical outlook, BTC continues to build on yesterday’s gains, breaking through the 107,500 resistance point and hitting 110,000 levels. At the time of writing, it is trading at 109,400, maintaining its strong stance.
Technical indicators are moving towards the overbought zone with the Wave Trend (WT) trend reversal. The histogram on the Squeeze Momentum (SM) indicator is back in positive territory, while the Kaufman moving average continues to support the uptrend below the price at 107,400.
When liquidity data is analyzed, BTC, which headed towards the liquidity area with the recent rise, this time liquidated the selling positions within the 108,000 – 110,000 band. With the latest liquidation, buy and sell trades have become rare again, while the accumulation of sell-side positions is 110,500 and buy-side positions are squeezed into a narrow band range at 108,500. In this context, we can follow the volatile market with spike movements of the price during the day.
Overall, fundamental developments continued to be the catalyst for pricing, while liquidity data and technical indicators continued to accompany it. With the price trading close to the ATH zone, the data set mentioned above will be followed in the next process. After this stage, a new catalyst may be needed in order for the rise to gain momentum. In this context, 110,000 is followed as a critical resistance point in the continuation of the rise, while closures above it can move the price back to the ATH level. On the other hand, in case of a decline after the liquidity purchase, the price may be expected to be rejected from this region once again and follow the liquidity areas again. In this possibility, 108,500 level will be followed.
Supports 109,000 – 108,500 – 106,600
Resistances 110,000 – 111,000 – 111,970
ETH/USDT
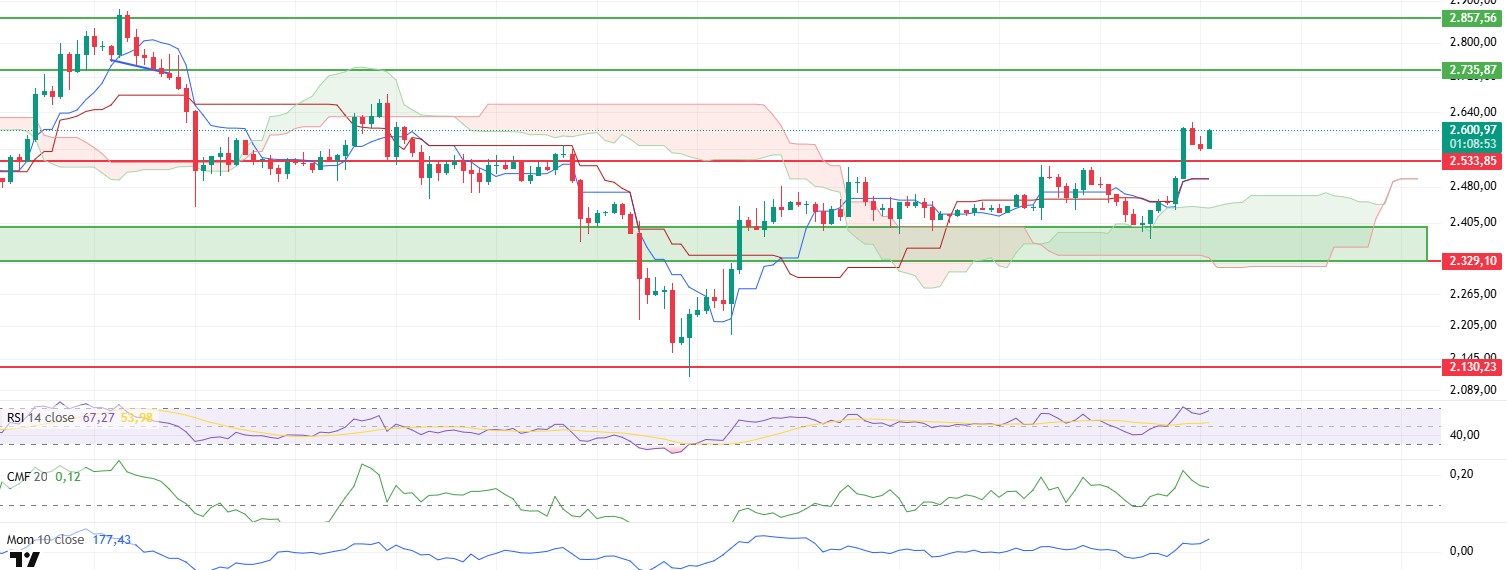
ETH price rallied strongly yesterday evening with support from the $2,436 level, the upper band of the kumo cloud, and managed to surpass the $2,533 level and then the $2,600 level, which is an important psychological and technical threshold. Although this upward movement shows that buyers are getting aggressive in the short term, the underlying dynamics do not point to a strong structure.
When the technical indicators are analyzed in detail, it is seen that the Chaikin Money Flow (CMF) indicator switched to the positive area especially at the beginning of the uptrend and caught an upward momentum with the price. However, this momentum could not last for long and CMF showed a downward trend again as the price eased slightly just after the $2,600 level. This suggests that there was not enough net liquidity inflows behind the price increase and that the rise was largely limited to short-term purchases or low-volume transactions.
Cumulative Volume Delta (CVD) data also support this picture. The increase in buying volume, which is clearly visible in the futures market, is not reflected in the spot market to the same extent. This shows that the speculative side of the market is predominant, and that the main force driving the price up is leveraged positions and short-term trades rather than permanent investors. This parallelism between CVD and CMF data suggests that the uptrend is not fully supported by fundamental market dynamics.
The Ichimoku indicator, on the other hand, is more positive in terms of the overall trend. The fact that the kumo cloud continues its upward trend, the price remains above the cloud and the price is priced above the tenkan and kijun levels indicates that the short-term as well as the medium-term technical trend remains positive. This structure indicates that the trend remains intact and the upside potential is still preserved despite technical corrections.
The Relative Strength Index (RSI) indicator, on the other hand, has continued its upward movement with momentum and has risen to the overbought zone. This indicates that the market has a strong momentum in the short term and technically points to a positive momentum. However, if the RSI cannot be sustained in this region, the risk of a short-term correction should not be ignored.
Overall, the majority of technical indicators show a positive trend. If the price continues to hold above the $2,533 level, it is possible that the upward movement may expand with a new momentum and the $2,736 level may become a target. However, the imbalances in liquidity flows pointed out by both CMF and CVD, especially the insufficient spot demand, remind us to be cautious about the sustainability of the uptrend. In this context, a price correction back towards the $2,533 level could come as a result of weak spot volume and insufficiently strong buy side.
Top of Form
Below the Form
Supports 2,329 – 2,130 – 2,029
Resistances 2,533 – 2,736 – 2,857
XRP/USDT
Ripple aimed to further consolidate its place in the financial system by applying for a banking license in the US. With the general bullish trend in the crypto market, XRP managed to surpass the $2.21 level again and rose as high as $2.29 in a short time. This move shows that buyers are becoming active again in line with the general mood of the market. However, it is important to evaluate the indicators in detail to understand to what extent the rise is on a strong technical basis.
First of all, there is a remarkable recovery on the momentum indicators front. The sharp turns and upward trends seen especially in short-term momentum indicators indicate that the positive outlook is at the forefront of short-term pricing. This momentum indicates that investors have started to reposition towards buying and strengthens the possibility of a continuation of the upward movement in the short term.
When the Chaikin Money Flow (CMF) indicator is analyzed, the volumetric structure created by the rise remains more limited. Although CMF supports the price action by transitioning to the positive area, the fact that the indicator cannot show a strong enough rise indicates that the liquidity entering the market is still weak and buying volumes remain limited. This situation reveals that caution should be exercised in terms of liquidity, which is the main force required for the continuation of the rise.
Looking at the Ichimoku indicator, there is a clearer technical positivity. The fact that the price has managed to stay above both the kumo cloud and the tenkan and kijun levels indicates that the upward trend continues, not only in the short term but also in the overall trend structure. This technical positioning provides an important structure that supports the bullish potential of the price towards the resistance levels.
Considering the overall technical outlook, there is a strong possibility that the price may make a bullish attempt towards the $2.33 level during the day, especially with the recovery in momentum and the structural support offered by the Ichimoku indicator. However, given the lack of liquidity reflected by CMF, clearer and stronger spot inflows to the market are required for this rise to be permanent. Otherwise, the $2.21 level should be followed as the first strong support point in a possible pullback.
Supports 2.2111 – 2.0841 – 1.9115
Resistances 2.3376 – 2.5900 – 2.8347

SOL/USDT
Solana raised $4 billion in one day with the launch of the first US SOL ETF. On the other hand, the first spot Solana stake ETF reached a volume of $33 million in first-day trading. Solana treasury company DeFi Development Corp. increased its convertible bond offering to $112 million.
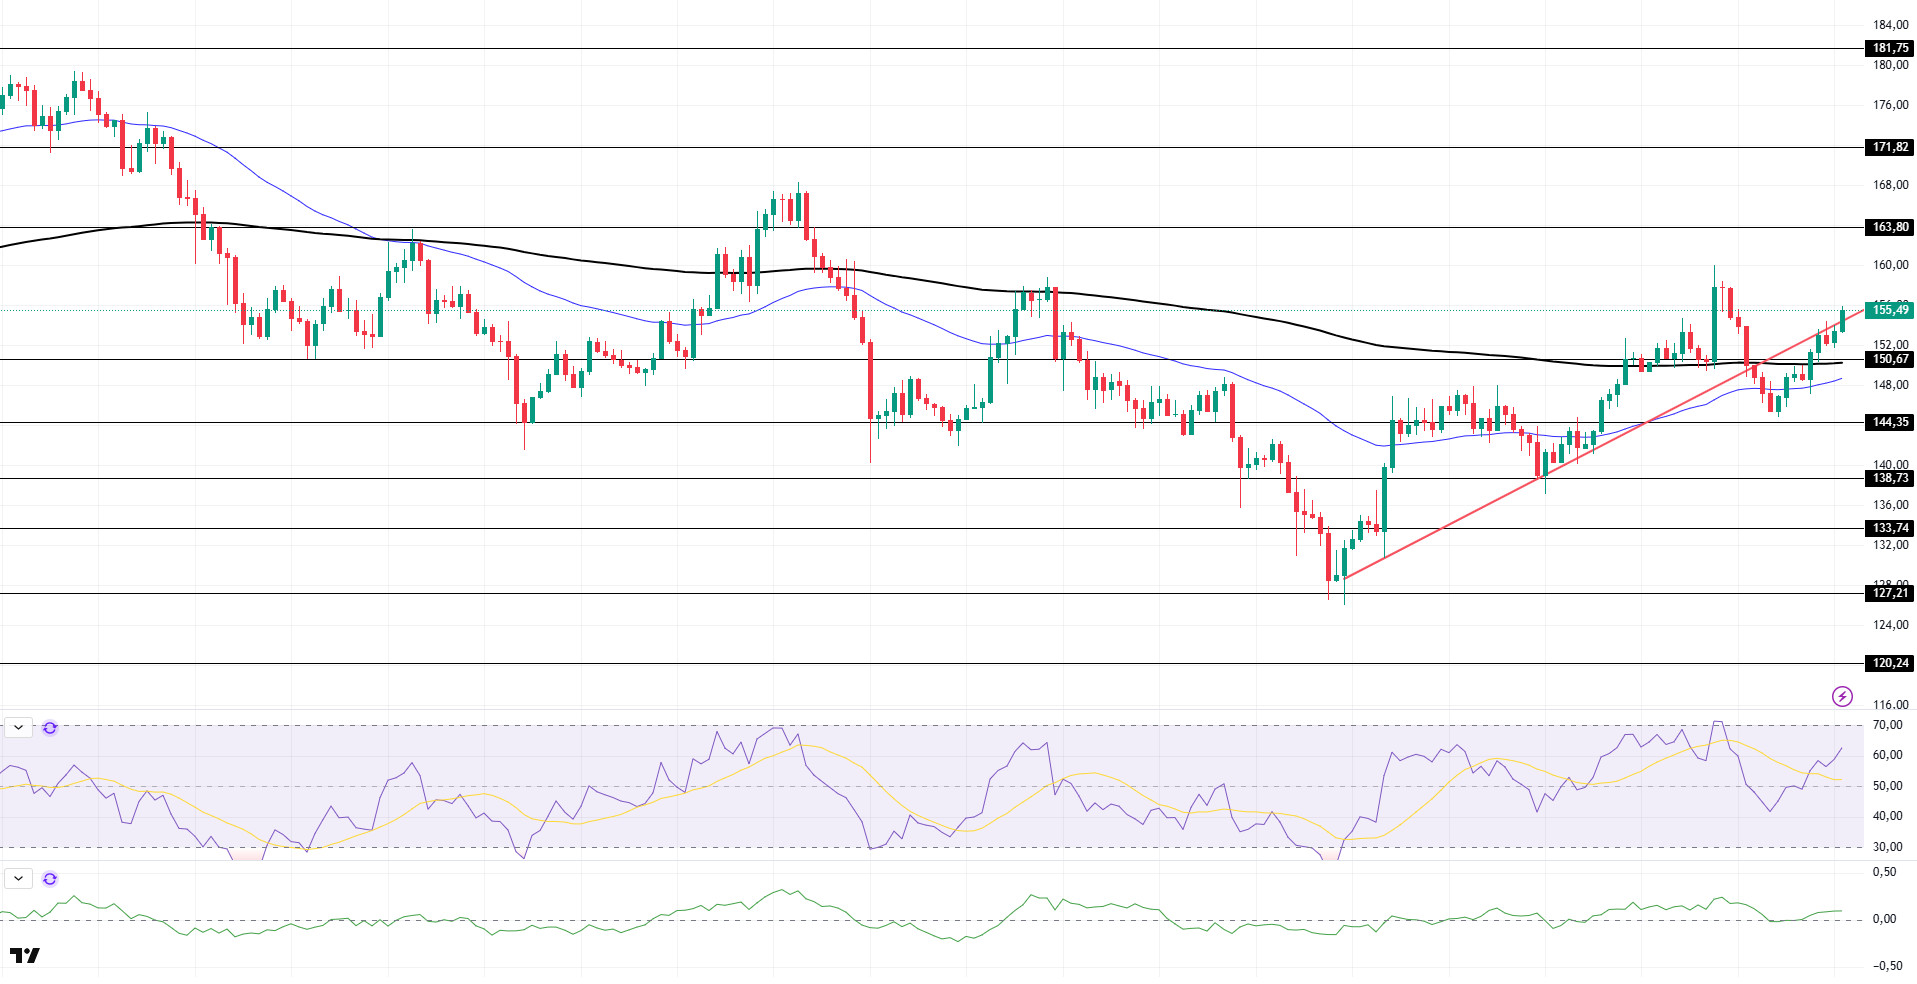
SOL price continued its uptrend. The asset accelerated by testing the $ 144.35 level, a strong support place, and rose from there. Breaking the 50 EMA (Blue Line) and 200 EMA (Black Line) moving average upwards with this rise, the price continued its acceleration and is currently testing the uptrend that started on June 22 as resistance. The $163.80 level can be followed on candle closes above the uptrend.
On the 4-hour chart, the 50 EMA continued to be below the 200 EMA. This suggests that the bearish trend may continue in the medium term. At the same time, the fact that the price is above both moving averages suggests that the market is currently in a bullish trend in the short term. Chaikin Money Flow (CMF-20) has started to be in the positive territory; in addition, an increase in inflows may push the CMF to the upper levels of the positive zone. Relative Strength Index (RSI-14) has also moved into positive territory. The $163.80 level stands out as a strong resistance point in case of a bullish breakout on the back of macroeconomic data or positive news on the Solana ecosystem. If this level is broken upwards, the rise can be expected to continue. If there are pullbacks due to contrary developments or profit realizations, the $150.67 level can be tested. In case of a decline to these support levels, the increase in buying momentum may offer a potential bullish opportunity.
Supports 150.67 – 144.35 – 138.73
Resistances 163.80 – 171.82 – 181.75
DOGE/USDT
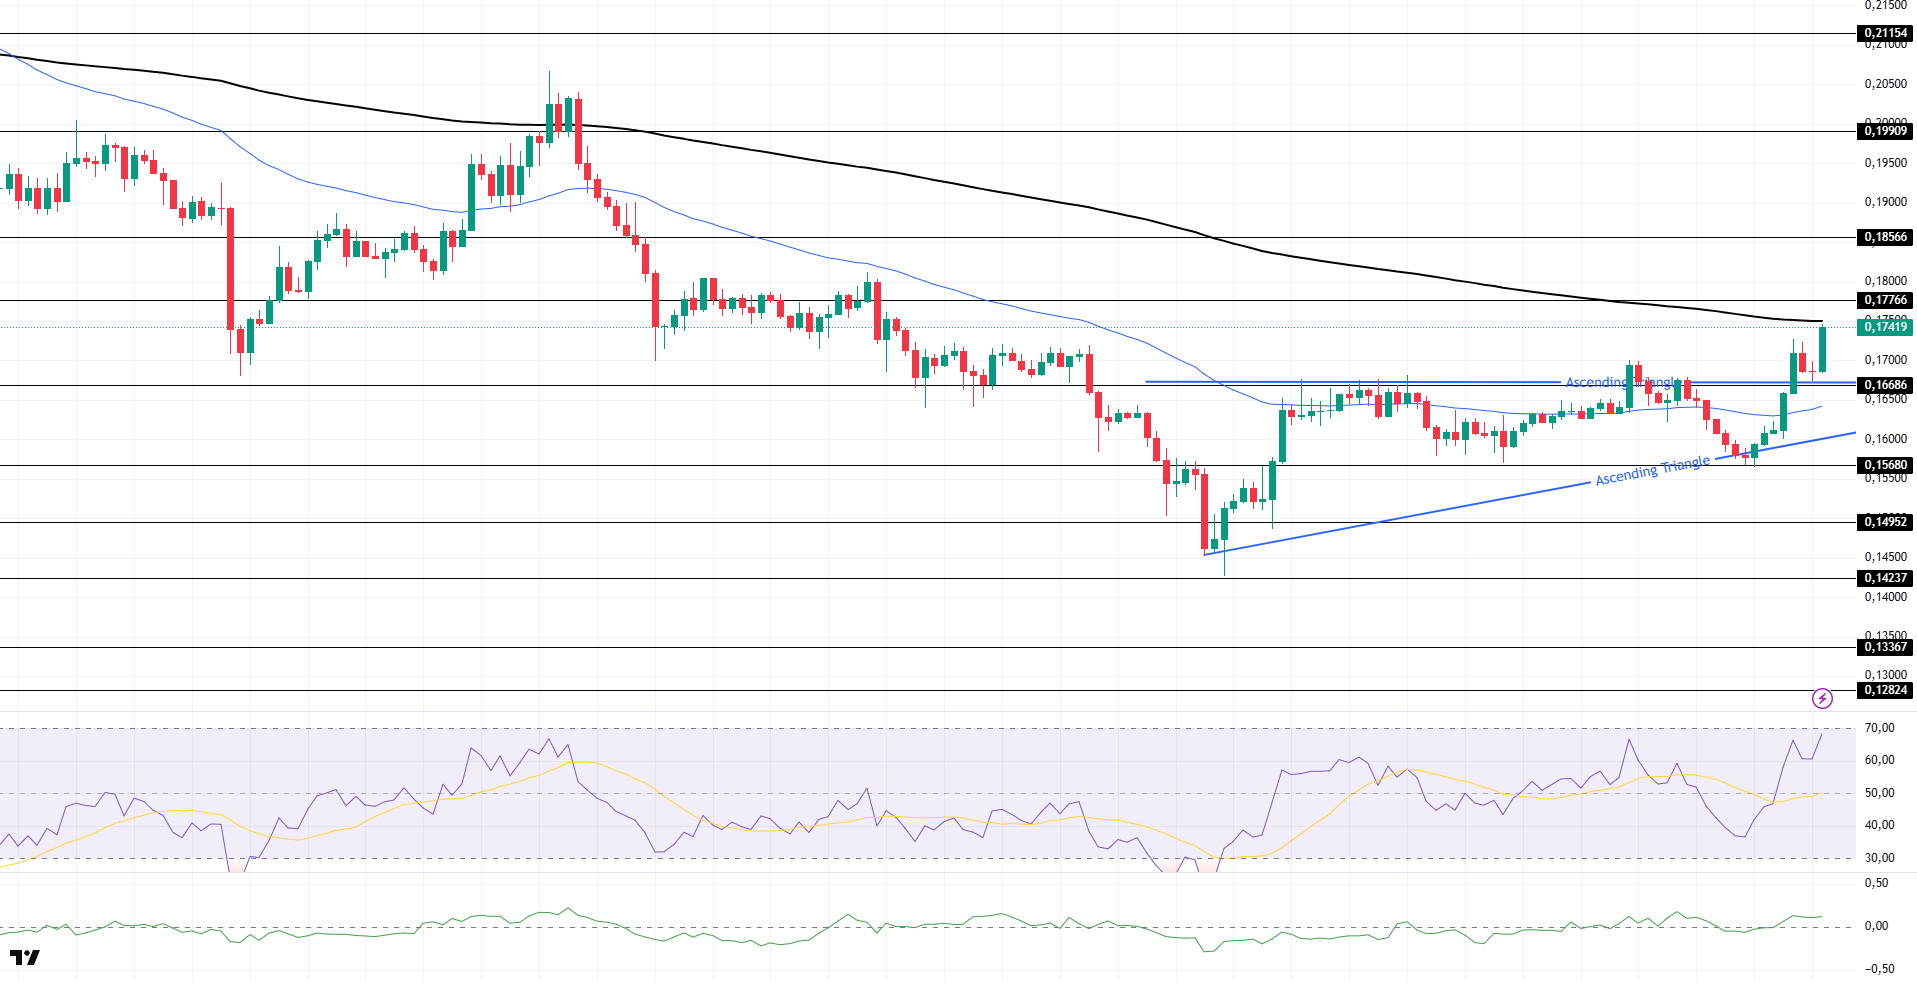
DOGE price broke the ceiling of the ascending triangle pattern to the upside. Breaking the 50 EMA (Blue Line) moving average, the asset continued its ascent and broke the ceiling of the ascending triangle pattern and is currently testing the 200 EMA (Black Line) moving average as resistance. The $0.17766 level can be followed on candle closes above the 200 EMA.
On the 4-hour chart, the 50 EMA (Blue Line) continues to be below the 200 EMA (Black Line). This shows us that the asset is bearish in the medium term. The fact that the price is between both moving averages indicates that the asset is in the decision phase in the short term. Chaikin Money Flow (CMF-20) maintains its neutral position. In addition, positive inflows may move CMF into positive territory. Relative Strength Index (RSI-14) started to be in positive territory. In line with political developments, macroeconomic data or positive news flow in the DOGE ecosystem , the $0.17766 level stands out as a strong resistance zone. In the opposite case or possible negative news flow, the $0.16686 level may be triggered. In case of a decline to these levels, the momentum may increase and start a new bullish wave.
Supports 0.16686 – 0.15680 – 0.14952
Resistances 0.17766 – 0.18566 – 0.19909
Legal Notice
The investment information, comments and recommendations contained herein do not constitute investment advice. Investment advisory services are provided individually by authorized institutions taking into account the risk and return preferences of individuals. The comments and recommendations contained herein are of a general nature. These recommendations may not be suitable for your financial situation and risk and return preferences. Therefore, making an investment decision based solely on the information contained herein may not produce results in line with your expectations.