
Technical Analysis
BTC/USDT
The crypto and fintech sectors in the US jointly called on the Consumer Financial Protection Bureau (CFPB) to maintain open banking rules. On the corporate side, Strategy board member Jarrod Patten renewed his confidence in the company’s long-term Bitcoin strategy by purchasing 23,780 MSTR shares worth $2.31 million. The UK-based Smarter Web Company also purchased 10 more Bitcoins, increasing its total holdings to 2,660 BTC. On-chain data showed that Bitcoin open positions have decreased by 30% in recent weeks.
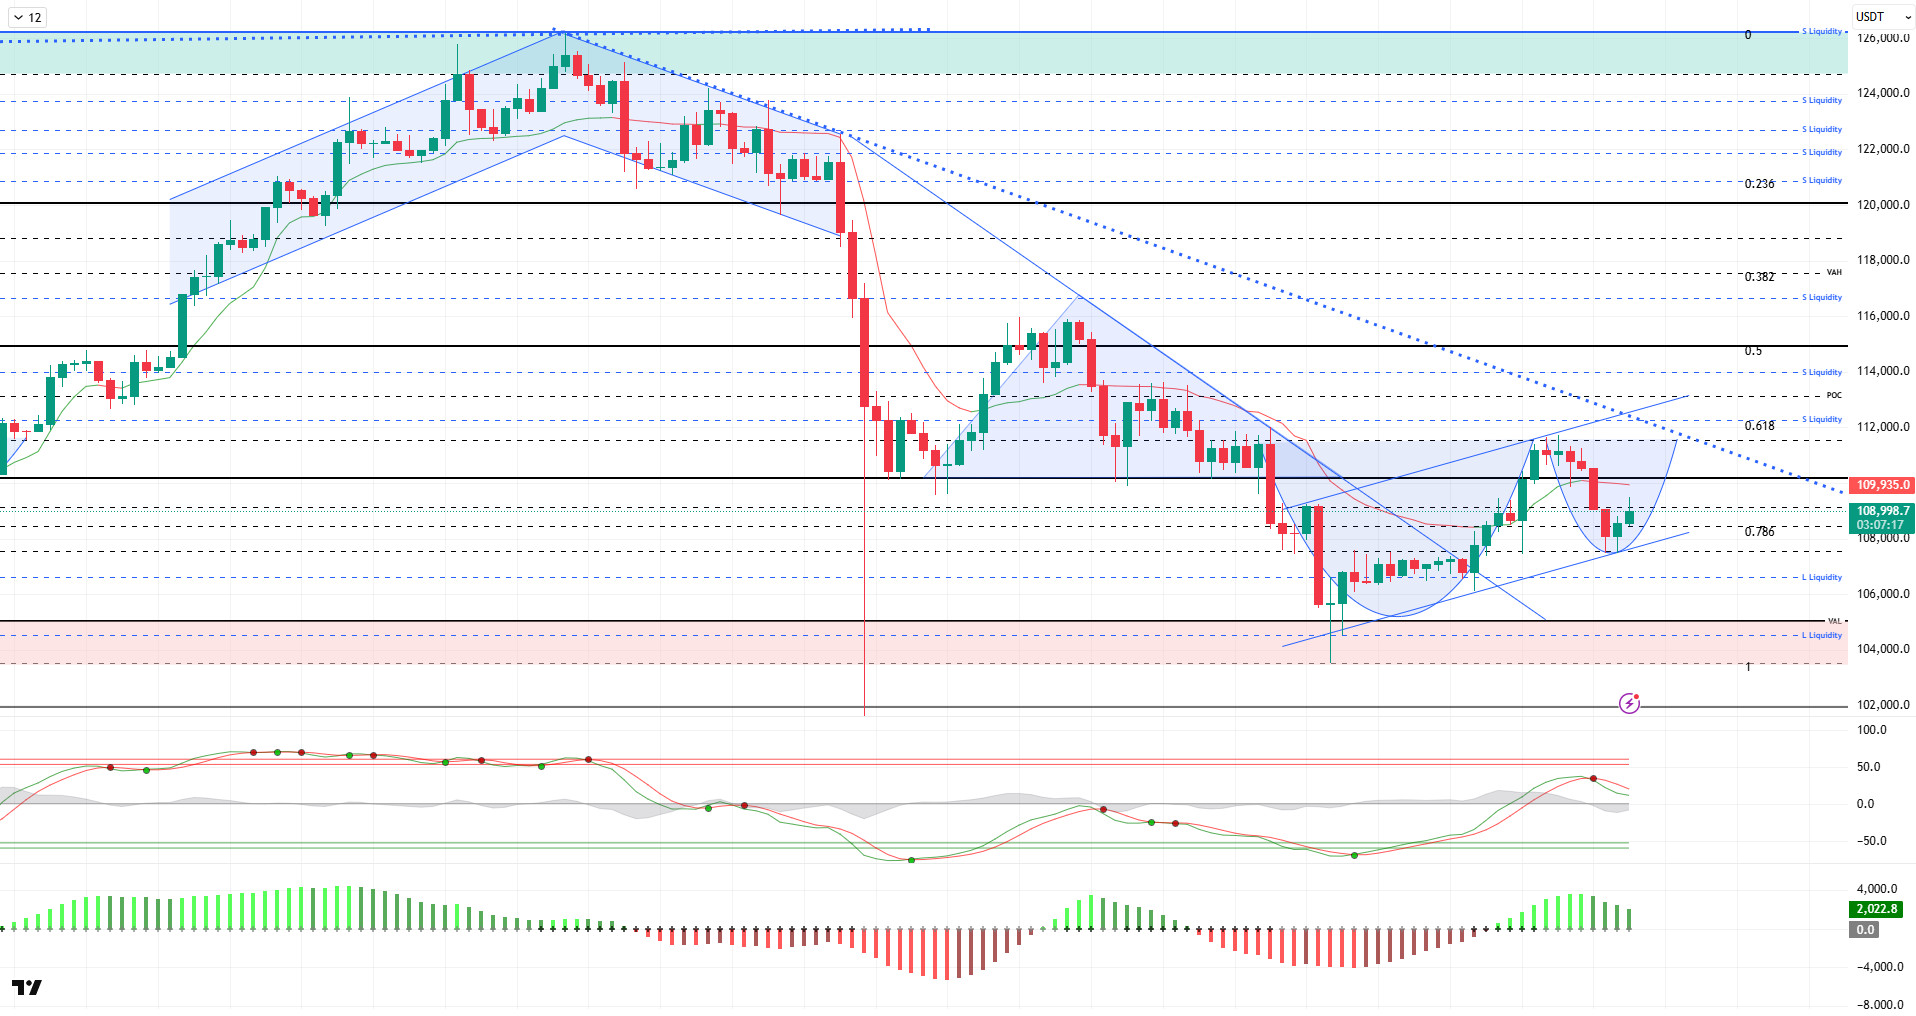
From a technical perspective, BTC, which was moving in a bearish pattern in the previous analysis, found support at the 107,400 level and formed a minor upward channel. Turning its direction upward in parallel with another technical structure it formed, the cup-and-handle pattern, BTC is attempting to complete the formation and continues to trade at the 109,300 level at the time of writing.
Technical indicators show that the Wave Trend (WT) oscillator is giving a weakening sell signal above the channel middle band, while the Squeeze Momentum (SM) indicator’s momentum, which had gained positive momentum, has weakened. The Kaufman moving average (KAMA) is currently at $109,950, positioned above the price.
According to liquidation data, the short-term buy level stands out as a liquidity zone between 106,000 and 106,600. In a broader time frame, the buying level continues to maintain its intensity at the 104,300 level. In contrast, the selling level is concentrated at 112,300 in the short term, followed by the 113,700–113,900 range, while in the long term, intensity continues above the 120,000 level.
In summary, on the fundamental side, the renewed tariff tensions between the US and China, the continued US government shutdown, and the Russia-Ukraine crisis continue to weigh on the price, while statements from the Trump camp are determining the direction of the markets during this process. Technically, BTC lost the 110,000 reference and critical support zone, causing the price to fall to the 103,300 level. The price, which gathered demand from this level, once again exceeded the 110,000 level but failed to hold there and fell back to the 107,000 level. Liquidation data continues to stand out as test areas during this process. In the coming period, the continuation of the price’s rise parallel to the minor upward channel is seen as critical for the transition to the positive zone at the 110,000 level. If the rise continues, we will follow the 112,000 level, which is another falling trend line. On the other hand, in the event of a potential selling pressure, the 107,400 level will be a critical support, and in case of a breakout, we will monitor the 105,000 level as a reference area again.
Supports: 107,400 – 106,600 – 105,000
Resistances: 108,500 – 110,000 – 111,400
ETH/USDT
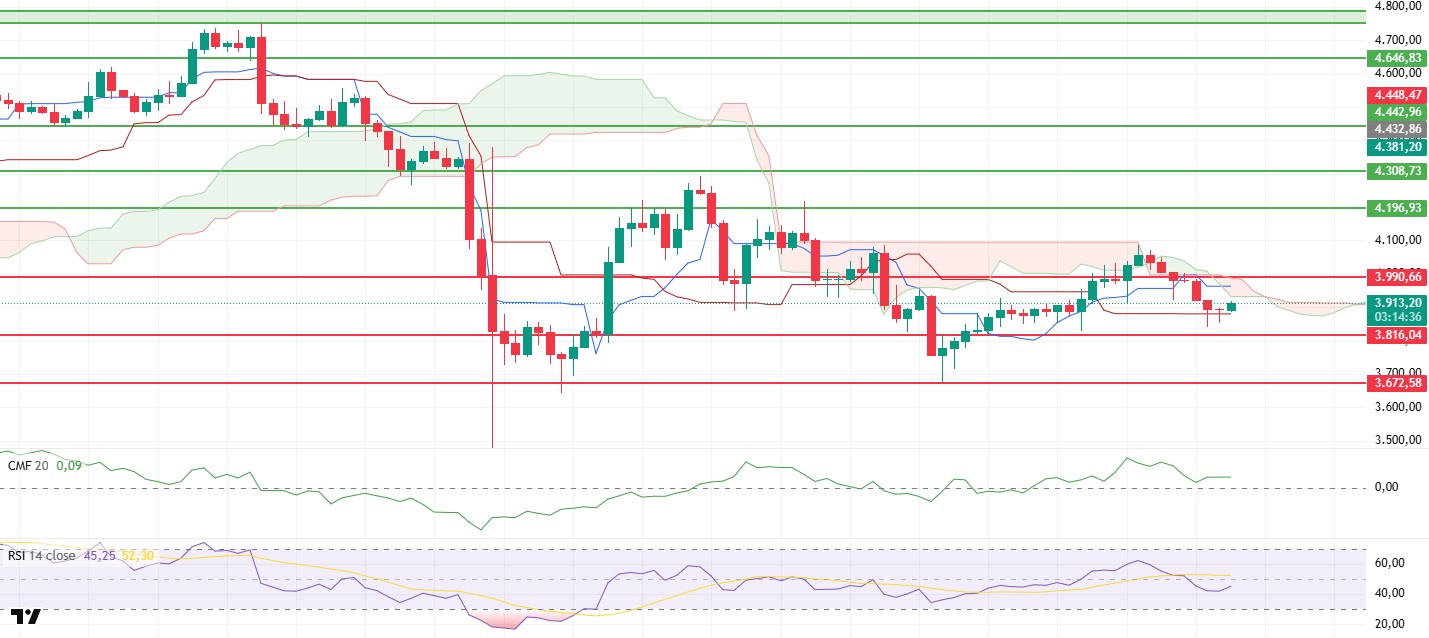
After losing the $3,990 support level the previous evening, the ETH price came under selling pressure and fell to $3,840. The price falling back to the $3,840 level during the day showed that sellers were still effective. However, buying at this level and Sharplink’s announcement that it purchased 19,271 Ethereum (ETH) at an average price of $3,892 on October 21 caused the price to rise to $3,915. This rise showed that buyers had re-entered the market in the short term and that the market was continuing to seek equilibrium.
The Chaikin Money Flow (CMF) indicator remained in positive territory, continuing its upward movement. This outlook shows that capital inflows are still favoring the price and that the market is supported in terms of liquidity. The liquidity flow remaining in positive territory stands out as a factor that could support upward attempts in the short term.
On the Relative Strength Index (RSI) side, there was no significant change. The indicator maintains its weak trend, as seen in the morning analysis. The RSI remaining below the 50 level indicates that buyers are losing momentum and that the price is likely to move sideways or downward in the short term.
Looking at the Ichimoku indicator, the price continues to remain below the kumo cloud. This points to a technically negative structure being maintained. However, as long as the price stays above the Kijun line at $3,880, there is a possibility of the price rising to the $3,990 resistance level. If $3,990 is exceeded, the uptrend is expected to gain momentum and stronger buying activity may come into play. Conversely, a downward break of the $3,880 level could trigger a pullback to the $3,816 level.
Overall, the ETH price is showing a volatile outlook in the short term. While institutional buying news provides short-term support, technical indicators still point to a cautious picture. If the $3,880 support holds, a rise towards $3,990 in the evening hours is likely, but falling below this level could increase selling pressure again.
Top of Form
Below the Form
Supports: 3,816 – 3,672 – 3,500
Resistances: 3,990 – 4,196 – 4,308
XRP/USDT
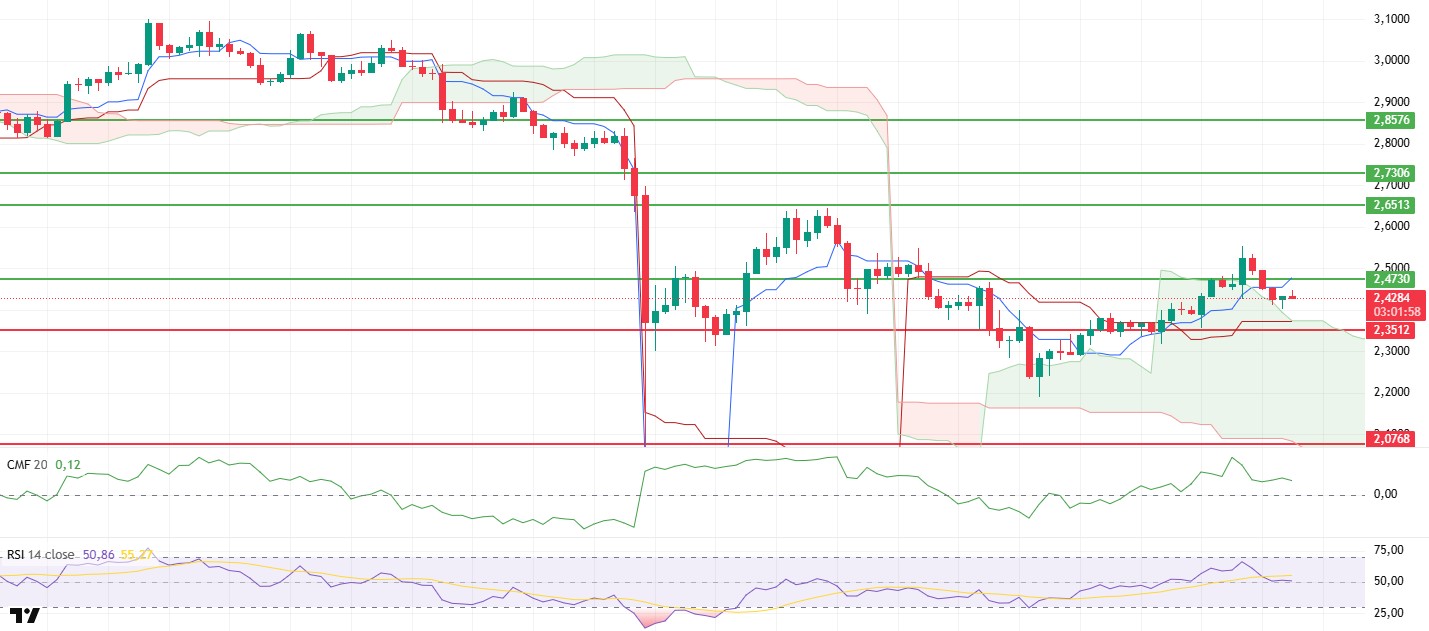
The XRP price moved sideways within a narrow range throughout the day and is currently trading at $2.43. The tight intraday trading range indicates that the market is still searching for direction and that short-term equilibrium efforts are continuing.
The Chaikin Money Flow (CMF) indicator remains in positive territory. This outlook reveals that capital continues to enter the market and liquidity still favors buyers. The CMF maintaining its positive position signals that the buying trend is still technically supported.
The Relative Strength Index (RSI) indicator remains steady at the 50 level, indicating that short-term momentum is balanced. The RSI holding at this level suggests that the price is attempting to gather strength at current levels and that upside potential remains on the table.
The overall structure of the Ichimoku indicator remains intact. The price trading above the Kumo cloud and remaining above both the Tenkan and Kijun levels confirms that the upward trend is technically continuing. This structure indicates that buyers still control the market and that the uptrend remains intact.
Overall, the XRP market continues its recovery process. The CMF remaining in positive territory, the RSI showing a balanced outlook, and the price continuing to move above the kumo cloud confirm that buyers are still in an advantageous position. If the $2.47 resistance level is breached again, the $2.65 target could come back into focus. Remaining below this level, however, could cause short-term sideways movements to continue for a while longer.
Supports: 2.3512 – 2.2100 – 2.0768
Resistances: 2.4730 – 2.6513 – 2.7306
SOL/USDT
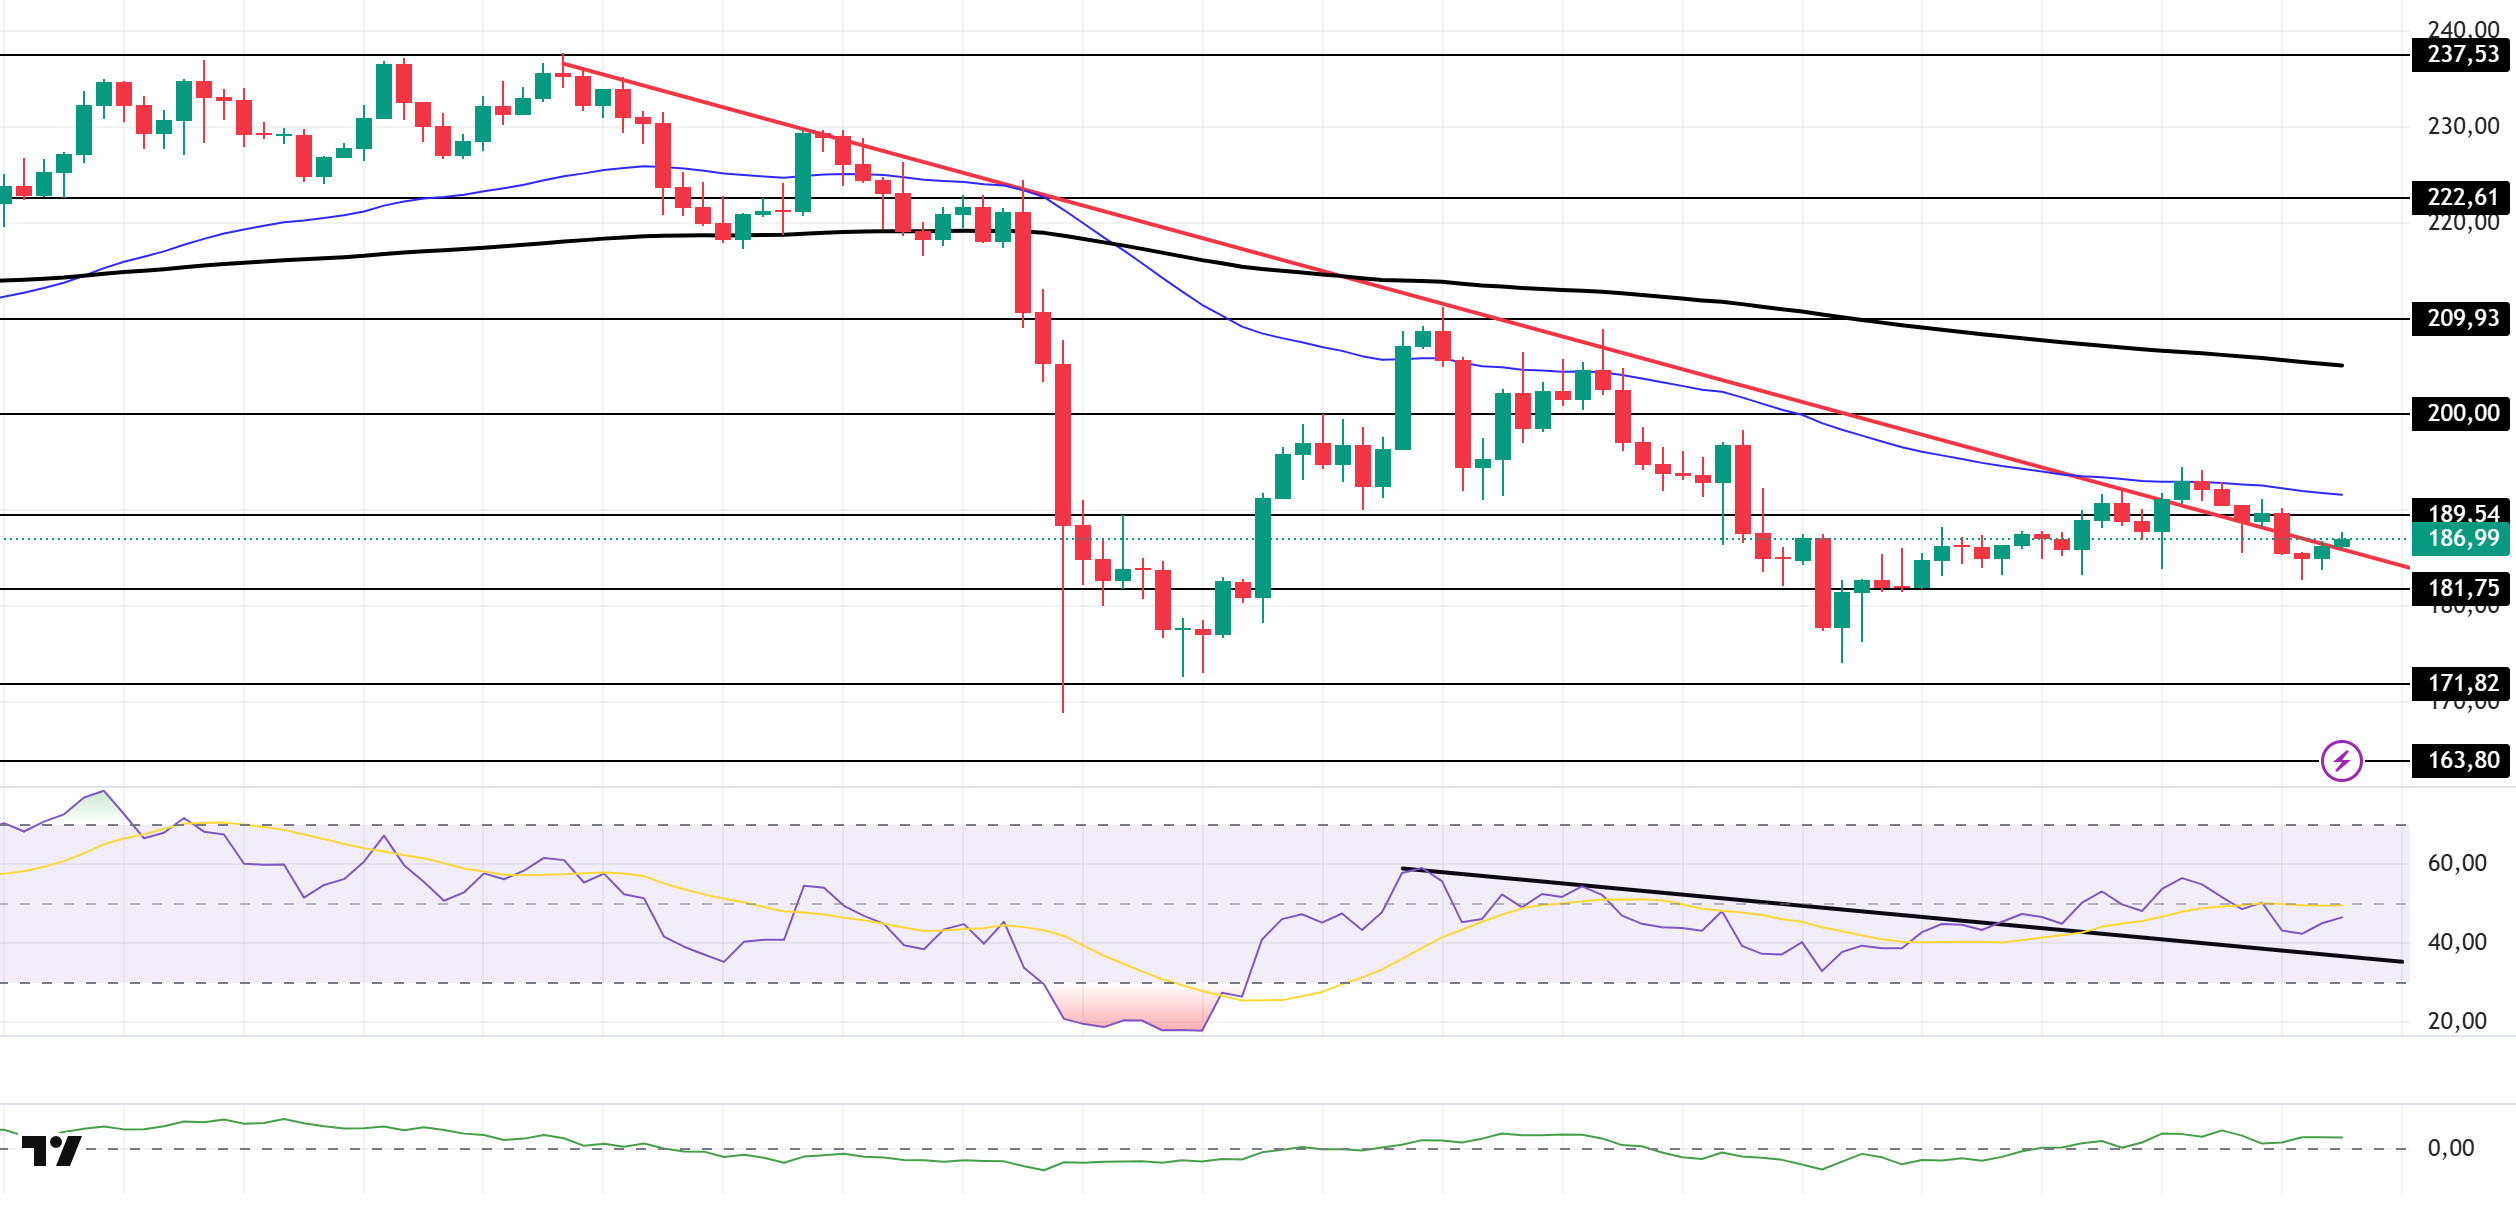
The SOL price traded sideways during the day. The asset faced resistance from the 50 EMA (Blue Line) moving average and failed to hold above the downward trend line that began on October 6, starting to trade below the line again. Currently testing the downward trend line as resistance, the price may test the 200 EMA (Black Line) moving average on candle closes above this line. In case of a pullback, the $181.75 level should be monitored.
On the 4-hour chart, it continued to remain below the 50 EMA (Exponential Moving Average – Blue Line) and 200 EMA (Black Line). This indicates that it may be in a downtrend in the medium term. At the same time, the price being below both moving averages shows us that the asset is in a downtrend in the short term. The Chaikin Money Flow (CMF-20) remained in positive territory. However, a decrease in money inflows could push the CMF into negative territory. The Relative Strength Index (RSI-14), which has remained in the upper region of the downward trend that began on October 13, continued to be in negative territory. In the event of an upturn due to macroeconomic data or positive news related to the Solana ecosystem, the $200.00 level stands out as a strong resistance point. If this level is broken upwards, the uptrend is expected to continue. In the event of pullbacks due to developments in the opposite direction or profit-taking, the $171.82 level may be tested. A decline to these support levels could increase buying momentum, presenting a potential opportunity for an upward move.
Supports: 181.75 – 171.82 – 163.80
Resistances: 189.54 – 200.00 – 209.93
DOGE/USDT
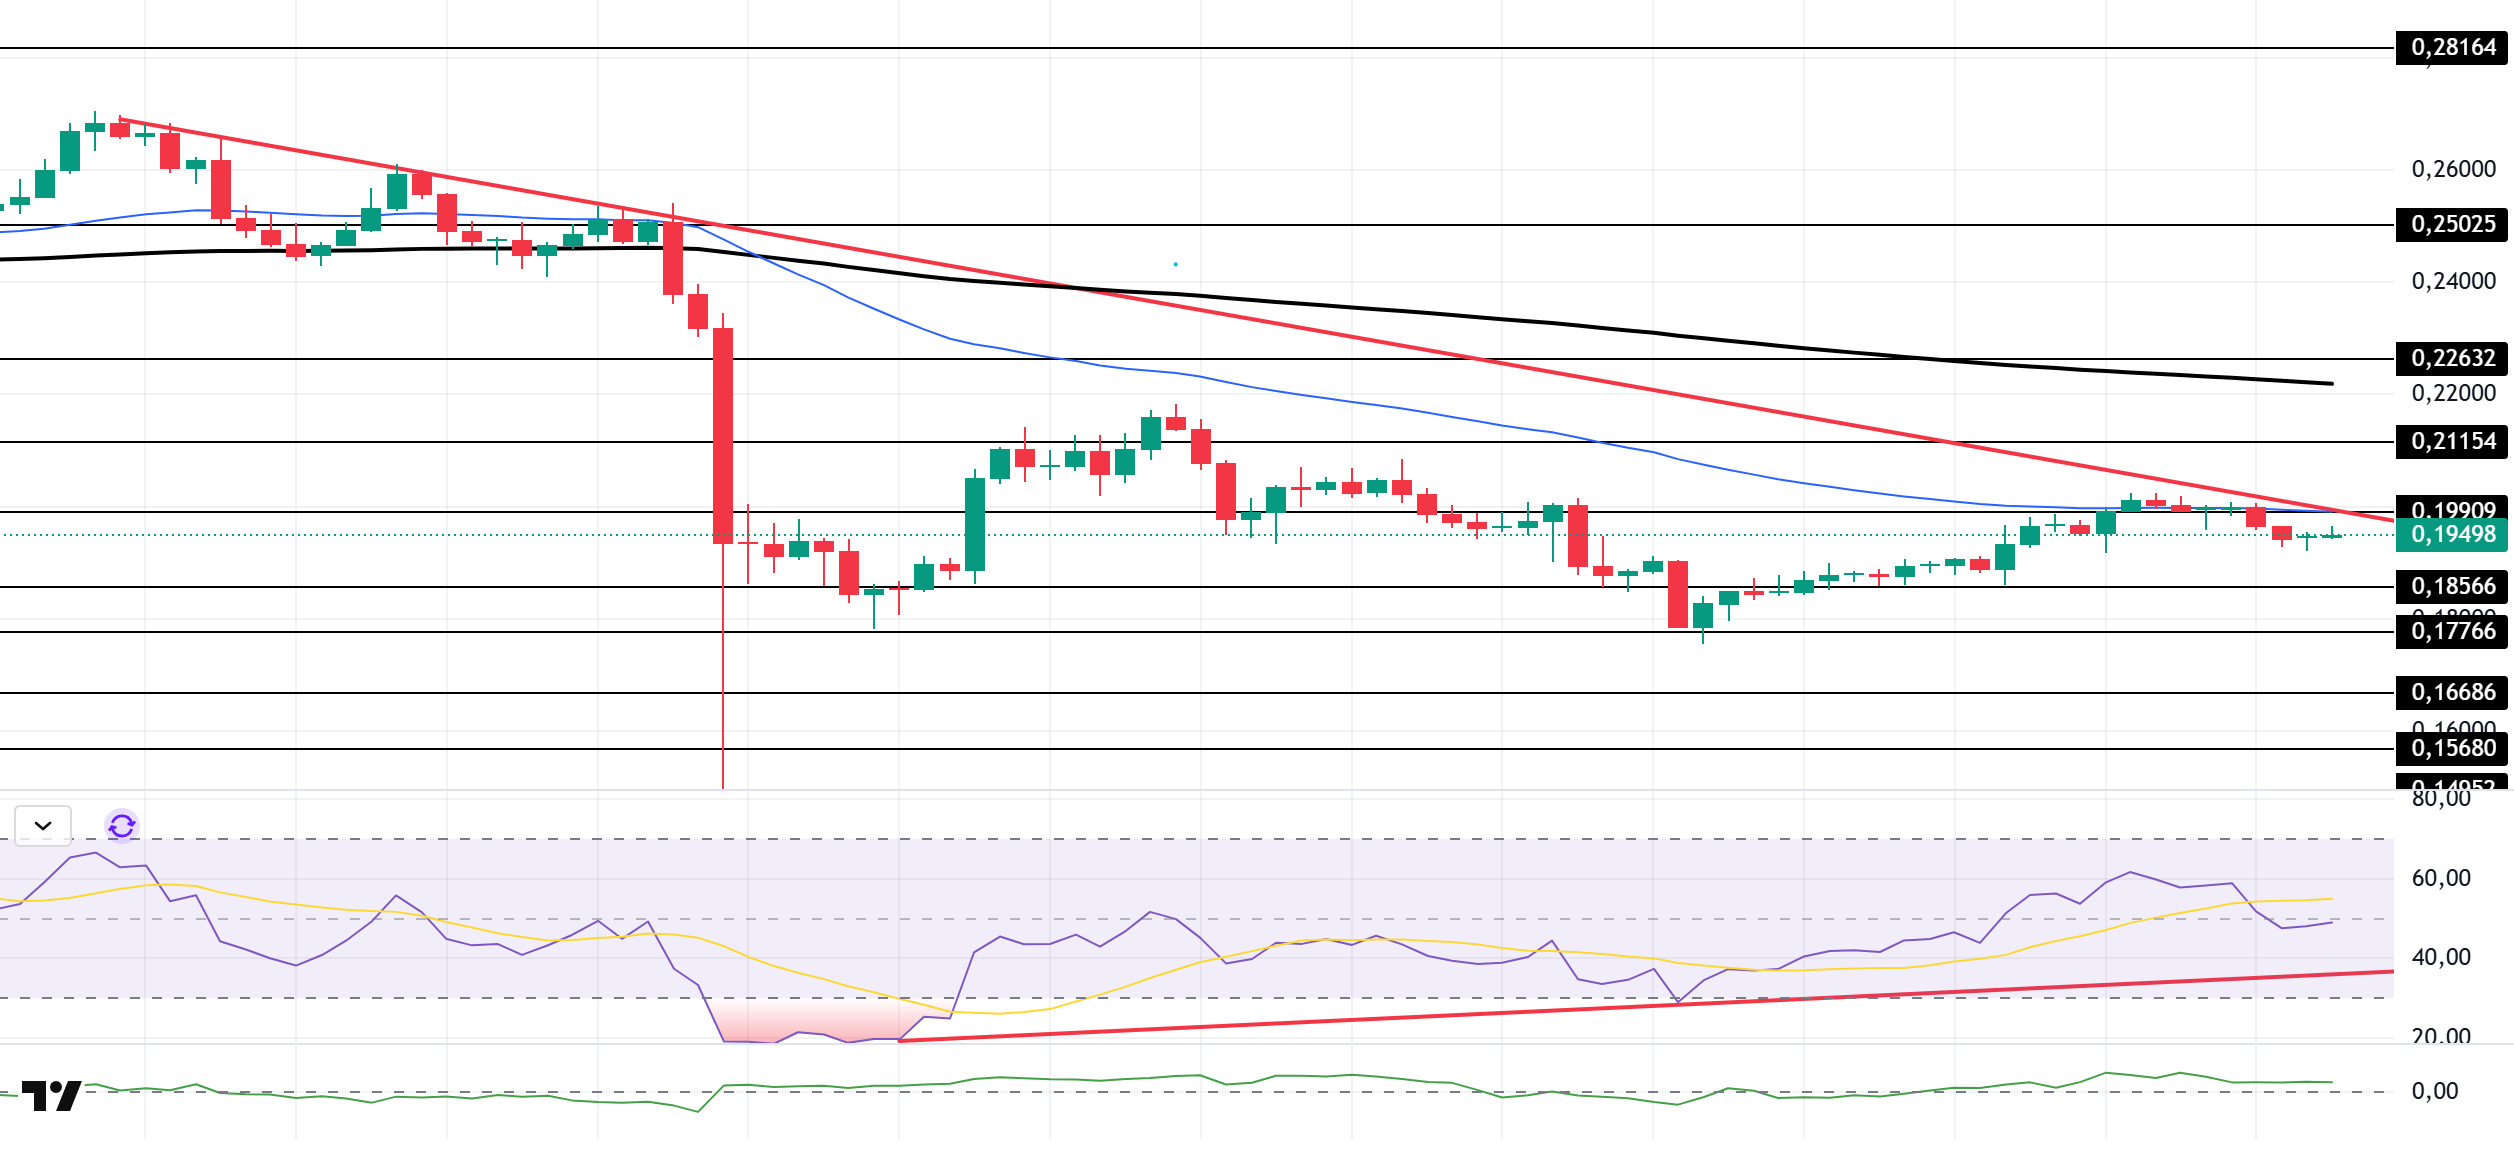
The DOGE price traded sideways during the day. The asset continues to trade in the lower region of the downtrend that began on October 6. Testing the 50 EMA (Blue Line) moving average, a strong resistance level, and the downtrend as resistance, the price failed to break through and experienced a pullback, deepening its decline. If the pullback continues, the $0.18566 level could trigger as a strong support zone. If the price closes above the 50 EMA and the upper boundary of the downtrend line, the 200 EMA (Black Line) moving average should be monitored.
On the 4-hour chart, the 50 EMA (Exponential Moving Average – Blue Line) remained below the 200 EMA (Black Line). This indicates that a downtrend may begin in the medium term. The price being below both moving averages indicates that the price is trending downward in the short term. Chaikin Money Flow (CMF-20) continues to hold its positive position. Additionally, a decrease in money inflows could push CMF into negative territory. The Relative Strength Index (RSI-14) continues to remain above the upward trend that began on October 12. At the same time, its neutral level indicates that it is at a decision point. In the event of a rise due to political developments, macroeconomic data, or positive news flow in the DOGE ecosystem, the $0.22632 level stands out as a strong resistance zone. Conversely, in the event of negative news flow, the $0.16686 level could be triggered. A decline to these levels could increase momentum and potentially initiate a new upward wave.
Supports: $0.18566 – $0.17766 – $0.16686
Resistances: 0.19909 – 0.21154 – 0.22632
AVAX/USDT
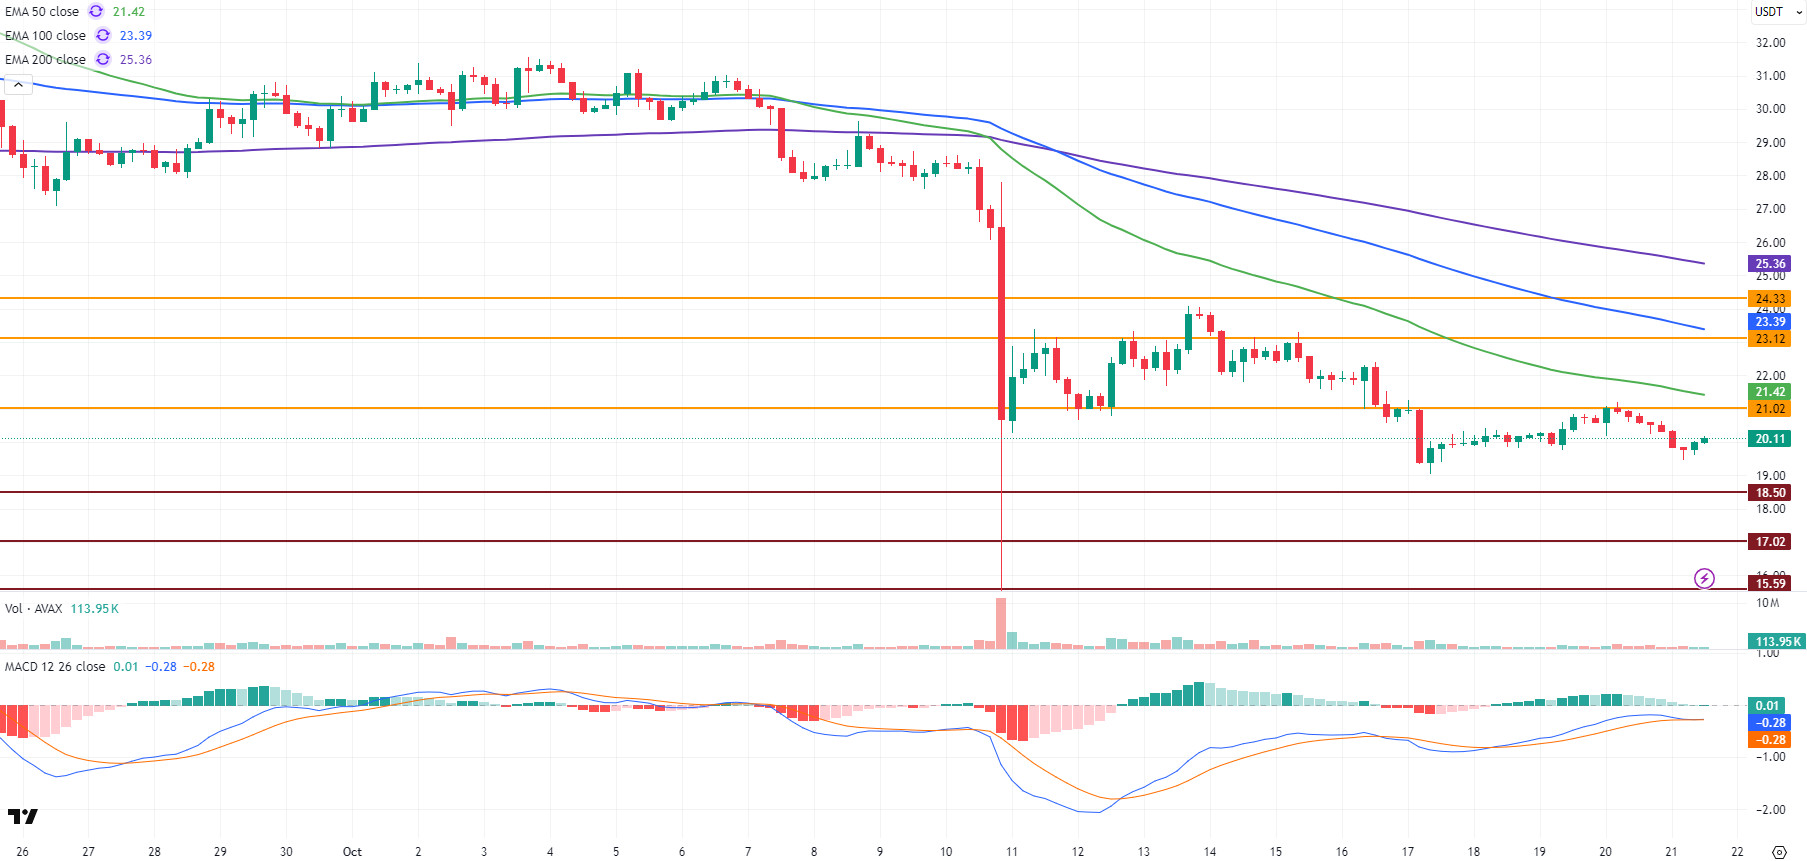
AVAX started the day at $20.34 and continued its weak performance throughout the day, currently trading at around $20. AVAX, which has lost approximately 1.5% in value on a daily basis, continues to be affected by low volume and a negative market outlook. Despite limited recovery attempts seen during the day, buying appetite remains quite weak. Increased selling pressure at resistance levels is causing the price to retreat again. Although long-term confidence in the Avalanche ecosystem remains strong, this confidence has yet to be reflected positively in the price in the short term.
Although the last two candles on the 4-hour chart show an upward movement in AVAX, the Moving Average Convergence/Divergence (MACD) line has now crossed the signal line, indicating a weakening momentum. If the MACD line crosses the signal line downward, the likelihood of a deeper decline will increase. However, AVAX is still trading below all critical Exponential Moving Average (EMA) levels. This situation technically indicates that the negative trend is maintained and selling pressure remains strong.
From a technical perspective, the $21.02 level stands out as the first significant resistance for AVAX’s upward movement. Unless it manages to stay above this level, the recovery may remain limited. However, if it closes above $21, the price could enter a gradual recovery process. If the $21.02 resistance is broken, AVAX could test the $23.12 and $24.33 levels in succession. In downward movements, the $18.50 level stands out as the first support zone. If there are closes below this level, selling pressure may increase, and AVAX may retreat to the $17.02 and $15.59 support levels. In the overall outlook, both the MACD and EMA indicators continue to produce negative signals. Weak momentum is limiting rallies to resistance zones. However, increased trading volume and stronger short-term buying interest could trigger a gradual recovery in AVAX with closes above $21.
(EMA50: Green Line, EMA100: Blue Line, EMA200: Purple Line)
Supports: 18.50 – 17.02 – 15.59
Resistances: 21.02 – 23.12 – 24.33
LINK/USDT
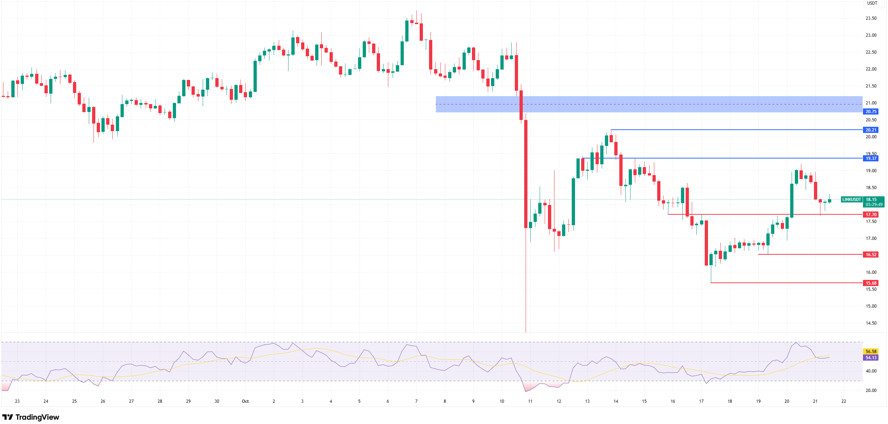
As we mentioned in our morning analysis, selling pressure from the $19 level caused Link to retreat to the $17.70 support level. We noted that this region is critically important and that the price holding above this level would support a bullish scenario. During the day, the price rebounded from the $17.70 support level and showed signs of recovery. We can say that it is currently seeking to stabilize around $18.40.
Looking at the current technical outlook, as long as the price remains above $17.70 in the short term, we can expect the upward movement to regain momentum. In such a scenario, the price will gain upward potential towards the $19.37 level first, and then towards the $20.21 – $21.00 band, which we emphasized in our morning analysis. However, as this region is a resistance area that has seen strong selling in the past, profit-taking may increase and the risk of a short-term correction may return. This could bring short-term volatility.
In downward movements, the $17.70 level again stands out as the main support. If the price closes below this level for 4 hours, it could trigger the decline scenario we mentioned in this morning’s analysis, bringing the $16.00 and then $15.00 targets into focus. The Relative Strength Index (RSI) is currently above 55, trading in positive territory. An RSI value above this level could add momentum, triggering buying appetite and pushing the price strongly towards our first resistance zone at $19.37.
Supports: 17.70 – 16.52 – 15.68
Resistances: 19.37 – 20.21 – 20.75
Legal Notice
The investment information, comments, and recommendations contained herein do not constitute investment advice. Investment advisory services are provided individually by authorized institutions taking into account the risk and return preferences of individuals. The comments and recommendations contained herein are of a general nature. These recommendations may not be suitable for your financial situation and risk and return preferences. Therefore, making an investment decision based solely on the information contained herein may not produce results in line with your expectations.


