
Technical Analysis
BTC/USDT
The European Central Bank kept its interest rate unchanged at 2% after seven consecutive rate cuts. Circle announced that its USYC stablecoin can be used as institutional collateral on a centralized exchange and announced that CUSDO will also be integrated. British artificial intelligence company Satsuma Technology raised $135 million in funding for Bitcoin reserves. Canada’s Belgravia Hartford bought another 25 BTC, bringing its total Bitcoin holdings to 40.8 units. Japan-based Convano Co., Ltd. reported holding a total of 79.92 BTC. Semler Scientific from the US bought another 175 BTC, bringing its total Bitcoin holdings to 5,021.
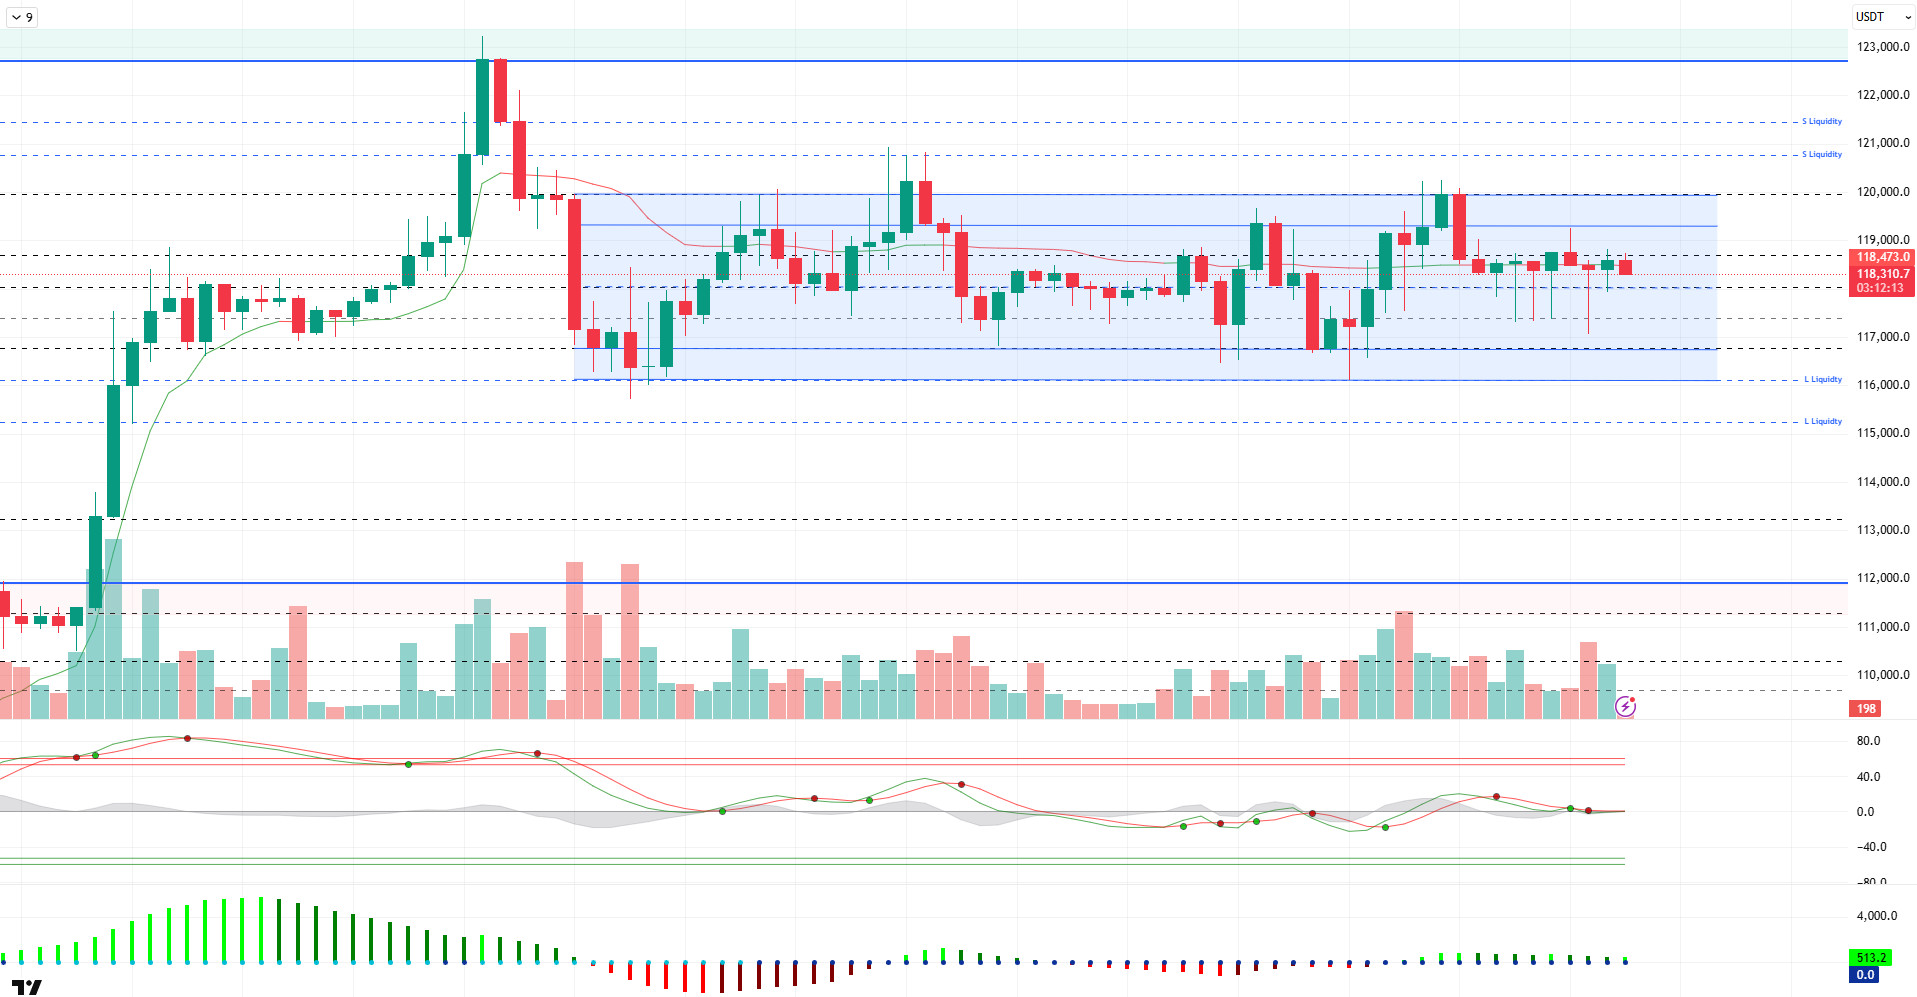
Looking at the technical outlook, BTC price continues to consolidate horizontally near the ATH level. BTC, which has been moving in the 116,000 – 119,000 band for a while, is rebalancing within this range, although it occasionally sags outside these levels. BTC, which threw a needle to the level of 117,350 during the day, continues to be traded at the level of 118,500, managing to recover again.
Looking at the technical indicators, the Wave Trend (WT) oscillator continues to move in the mid-band of the channel with the recent decline, but is showing indecisive movements again. The histogram on the Squeeze momentum (SM) indicator regained momentum and moved into positive territory, but did not gain momentum. The Kaufman moving average is just above the price at 118.450.
When the liquidity data is analyzed, 115,000 – 116,000 stands out as the buying level, while the selling level seems to intensify above 120,000. The liquidity zones of the price stand out as areas expected to receive a reaction.
In summary, the price continues to consolidate near the ATH level as fundamental developments continue to contribute positively to pricing. While the technical outlook is unstable in the short term, causing horizontal movements, liquidity data sets the limits of price movements. In the continuation of the rise, closes above the 120,000 minor resistance point may bring new ATH levels to the agenda. In a possible selling pressure, closures below the 118,600 support level may lead the price towards the 115,000 liquidity level.
Supports 118,600 – 117,500 – 116,800
Resistances 120,000 – 121,000 – 123,300
ETH/USDT
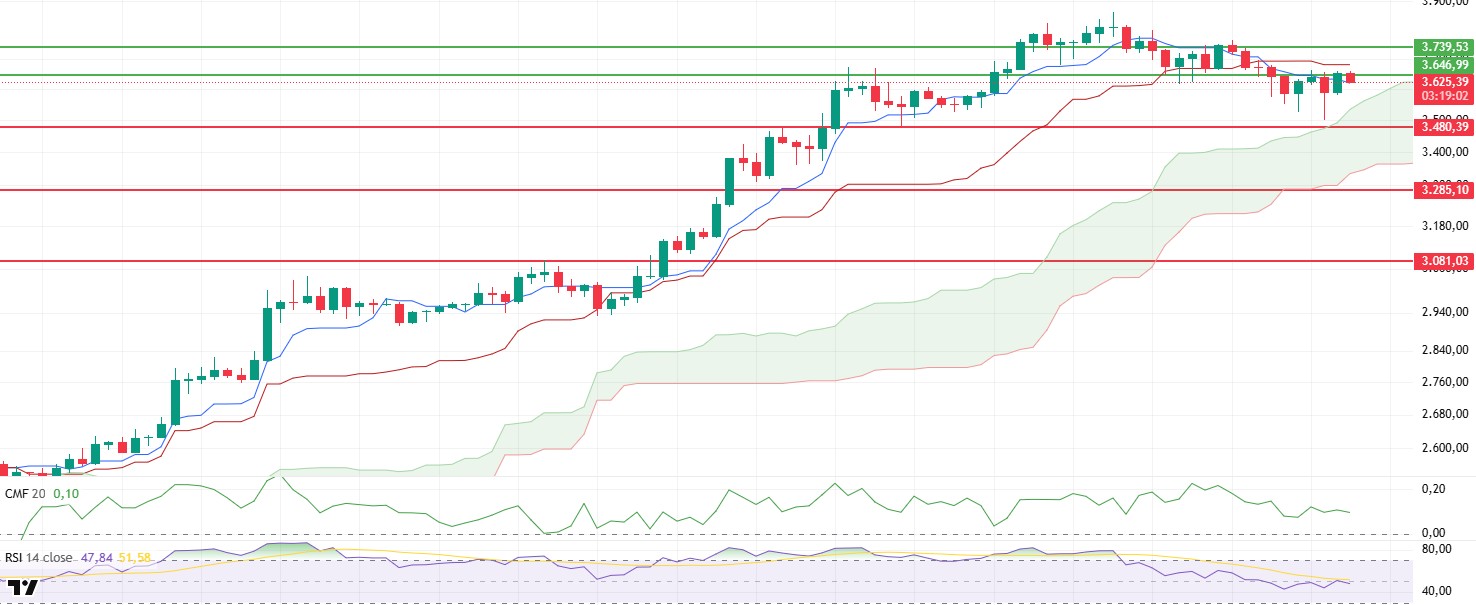
ETH suffered a sharp pullback in the morning hours to the $3.503 level, close to the upper band of the kumo cloud. However, with the purchases coming from this region, the price was able to rebound and rise to the resistance level of $3,646. The price’s rise to this level has been supported by some positive signals, especially in technical indicators.
When the Ichimoku indicator is analyzed, the price regained the tenkan level, indicating that recovery efforts are strengthening in the short term. However, the fact that the tenkan level is still below the kijun level indicates that the bearish pressure has not completely disappeared and short-term risks remain. On the other hand, the fact that the price remains within the kumo cloud and the cloud support has not yet been broken suggests that the overall structure may still remain in positive territory and the current declines may be considered as a correction.
The Chaikin Money Flow (CMF) indicator remained flat during the recent decline with no significant negative divergence. This suggests that there has not been a significant outflow of liquidity in the market, but rather a balance of inflows and outflows. The fact that CMF continues to remain in positive territory can be taken as a positive signal that the recent price pullback may be temporary and is potentially setting the stage for a rebound.
Relative Strength Index (RSI), on the other hand, rebounded to both the based MA line and the 50 reference level, indicating that short-term momentum is strengthening. This suggests that both the selling pressure is weakening and the buying side is regaining momentum. In particular, this strengthening in the RSI provides an important technical sign that the price may continue its upward movement in the coming hours.
While the price and indicators are generally more positive compared to the morning hours, the scenario is strengthening that this structure can quickly strengthen and ETH can experience sharp rises if the resistance of $3,646 is exceeded. However, as long as it remains below this level, the possibility of the market weakening again and retreating towards the $3,503 region should not be ignored. As long as the Kumo cloud support is not broken, it is possible to talk about a structure where the general trend continues to be maintained, but short-term volatility continues.
Supports 3,480 – 3,825 – 3,081
Resistances 3,646 – 3,739 – 4,084
XRP/USDT
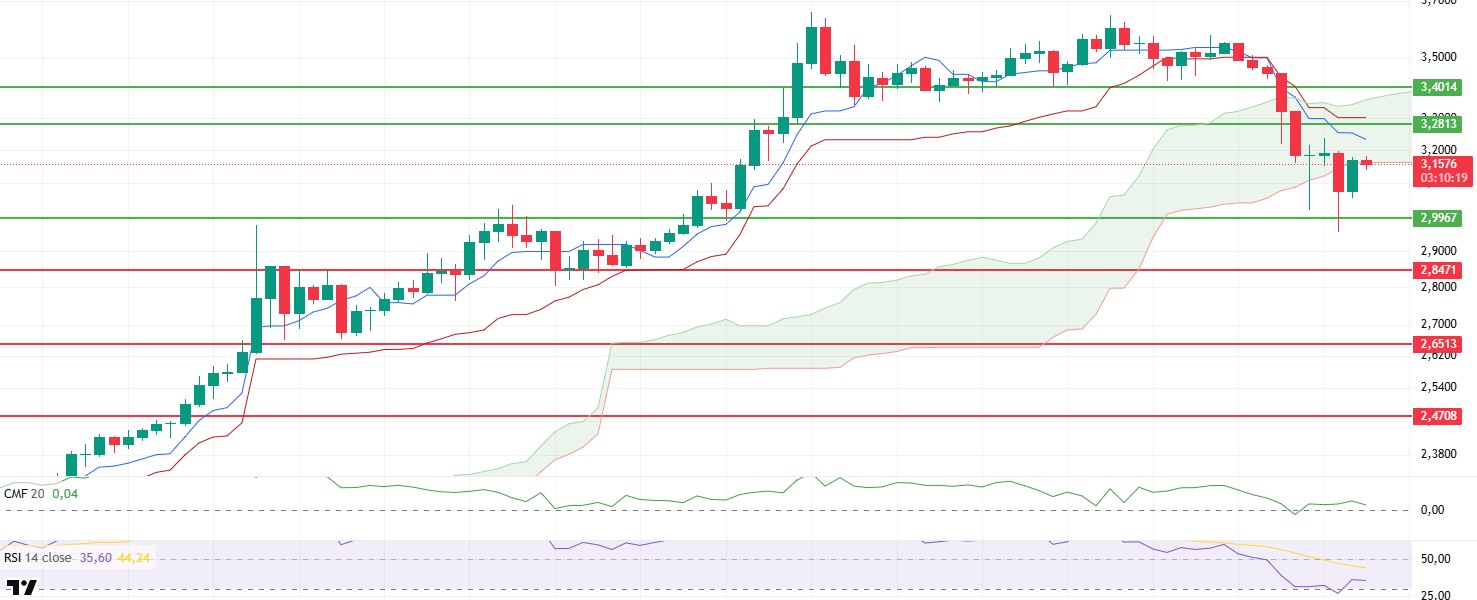
XRP price fell to the support zone at the level of $2.99 with a sharp retreat in the morning hours. With the purchases from this region, the price gradually recovered and managed to rise again to the lower band of the kumo cloud. The signs of recovery, especially in short-term technical indicators, suggest that the price’s reaction from this support level may not be a temporary recovery, but the first step of a potential change of direction.
The Relative Strength Index (RSI) indicator had fallen to the oversold zone along with the price. However, from this point on, the RSI turned upwards and started to rise again from the oversold zone, confirming that the short-term momentum has started to regain strength and buyers have become active again. This structure on the RSI stands out as an important signal that the reaction rises, especially after oversold, are technically supported.
The Chaikin Money Flow (CMF) indicator, on the other hand, remains in positive territory, indicating that liquidity inflows continue in the market, albeit limited. However, the lack of a clear upward momentum in this indicator indicates that the market structure has not yet fully strengthened and the pressures on the price have not completely disappeared, albeit alleviated. Therefore, unless the current recovery evolves into a structural strengthening, it may remain a process that should be approached cautiously.
On the Ichimoku indicator, the price re-entering the kumo cloud is an important signal that the trend has not yet turned negative. However, this outlook will become more meaningful when the price settles permanently above the $3.16 level, which is the lower band of the kumo cloud. Closing below this level may pave the way for the negative scenario to re-engage and the downtrend to continue with strength. At the same time, the fact that the tenkan level is still below the kijun level indicates that short-term risks persist and the price is struggling to create a strong upward structure.
In the general evaluation, with the reaction from the $2.99 level, XRP is seen to give a certain technical recovery signal. However, in order for these signals to gain permanence, it is critical to have stable closures, especially above the $3.16 level. Otherwise, the current rises may remain only a correction and the price is likely to come under bearish pressure again.
Supports 2.9967 – 2.8471 – 2.6513
Resistances 3.2813 – 3.4014 – 3.8615
SOL/USDT
Accelerate aims to build massive Solana treasury with $1.51 billion fundraising. Solana plans to increase block capacity from 60 million to 100 million Units of Computation under SIMD-0286 and increase throughput by 66% to reduce congestion.
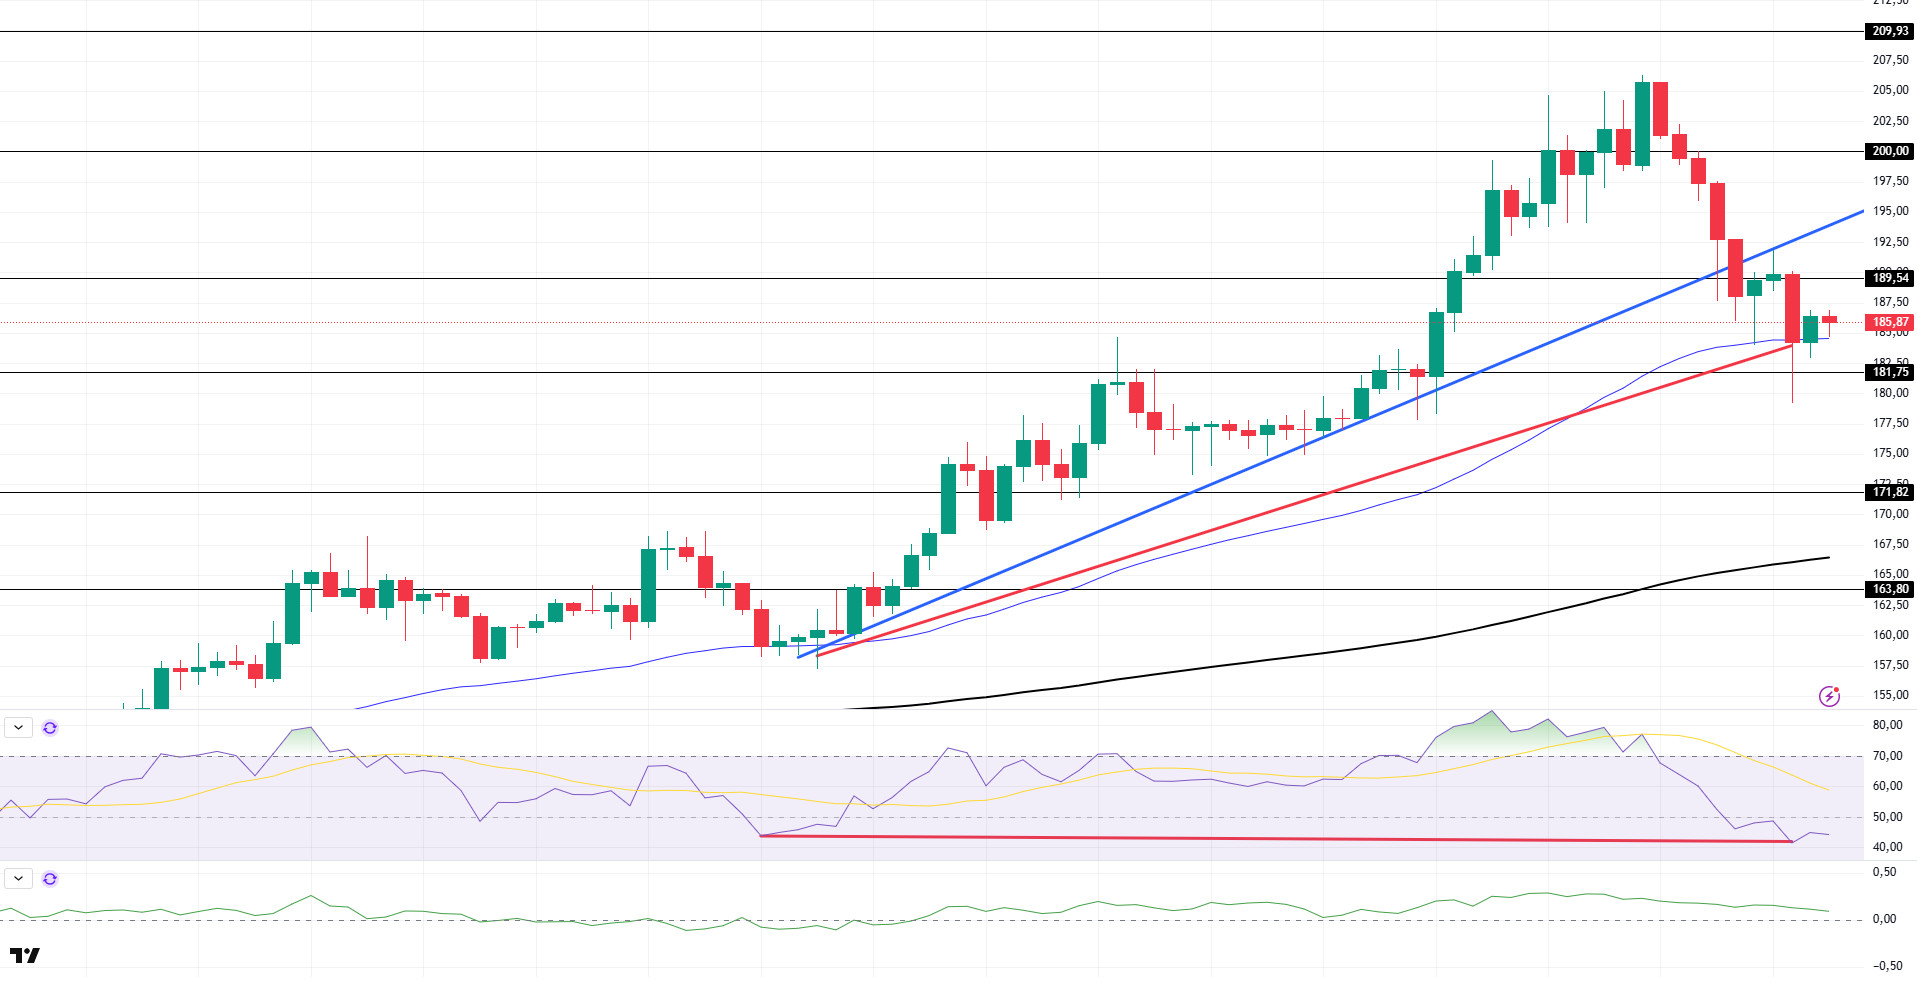
SOL price was flat during the day. The asset broke the uptrend that started on July 15 to the downside and lost its momentum. Taking support from the 50 EMA (Blue Line) moving average, the price was slightly bullish. If the uptrend continues, it may test the uptrend as resistance. If the retracement continues, the $ 181.75 level can be followed.
On the 4-hour chart, the 50 EMA (Blue Line) continues to be above the 200 EMA (Black Line). This suggests that the uptrend may continue in the medium term. At the same time, the fact that the price is above both moving averages suggests that the market is currently in a bullish trend in the short term. On the other hand, a large difference between the two moving averages may trigger a bearish or sideways trend. Chaikin Money Flow (CMF-20) remained in positive territory. However, a decrease in money inflows may move CMF into negative territory. Relative Strength Index (RSI-14), on the other hand, moved into negative territory and increased selling pressure. However, a positive divergence has formed. This could be a bullish harbinger. The $200.00 level stands out as a strong resistance point in case of a bullish breakout on the back of macroeconomic data or positive news on the Solana ecosystem. If this level is broken upwards, the rise can be expected to continue. If there are pullbacks due to contrary developments or profit realizations, the $ 181.75 level can be tested. In case of a decline to these support levels, the increase in buying momentum may offer a potential bullish opportunity.
Supports 181.75 – 171.82 – 163.80
Resistances 189.54 – 200.00 – 209.93
DOGE/USDT
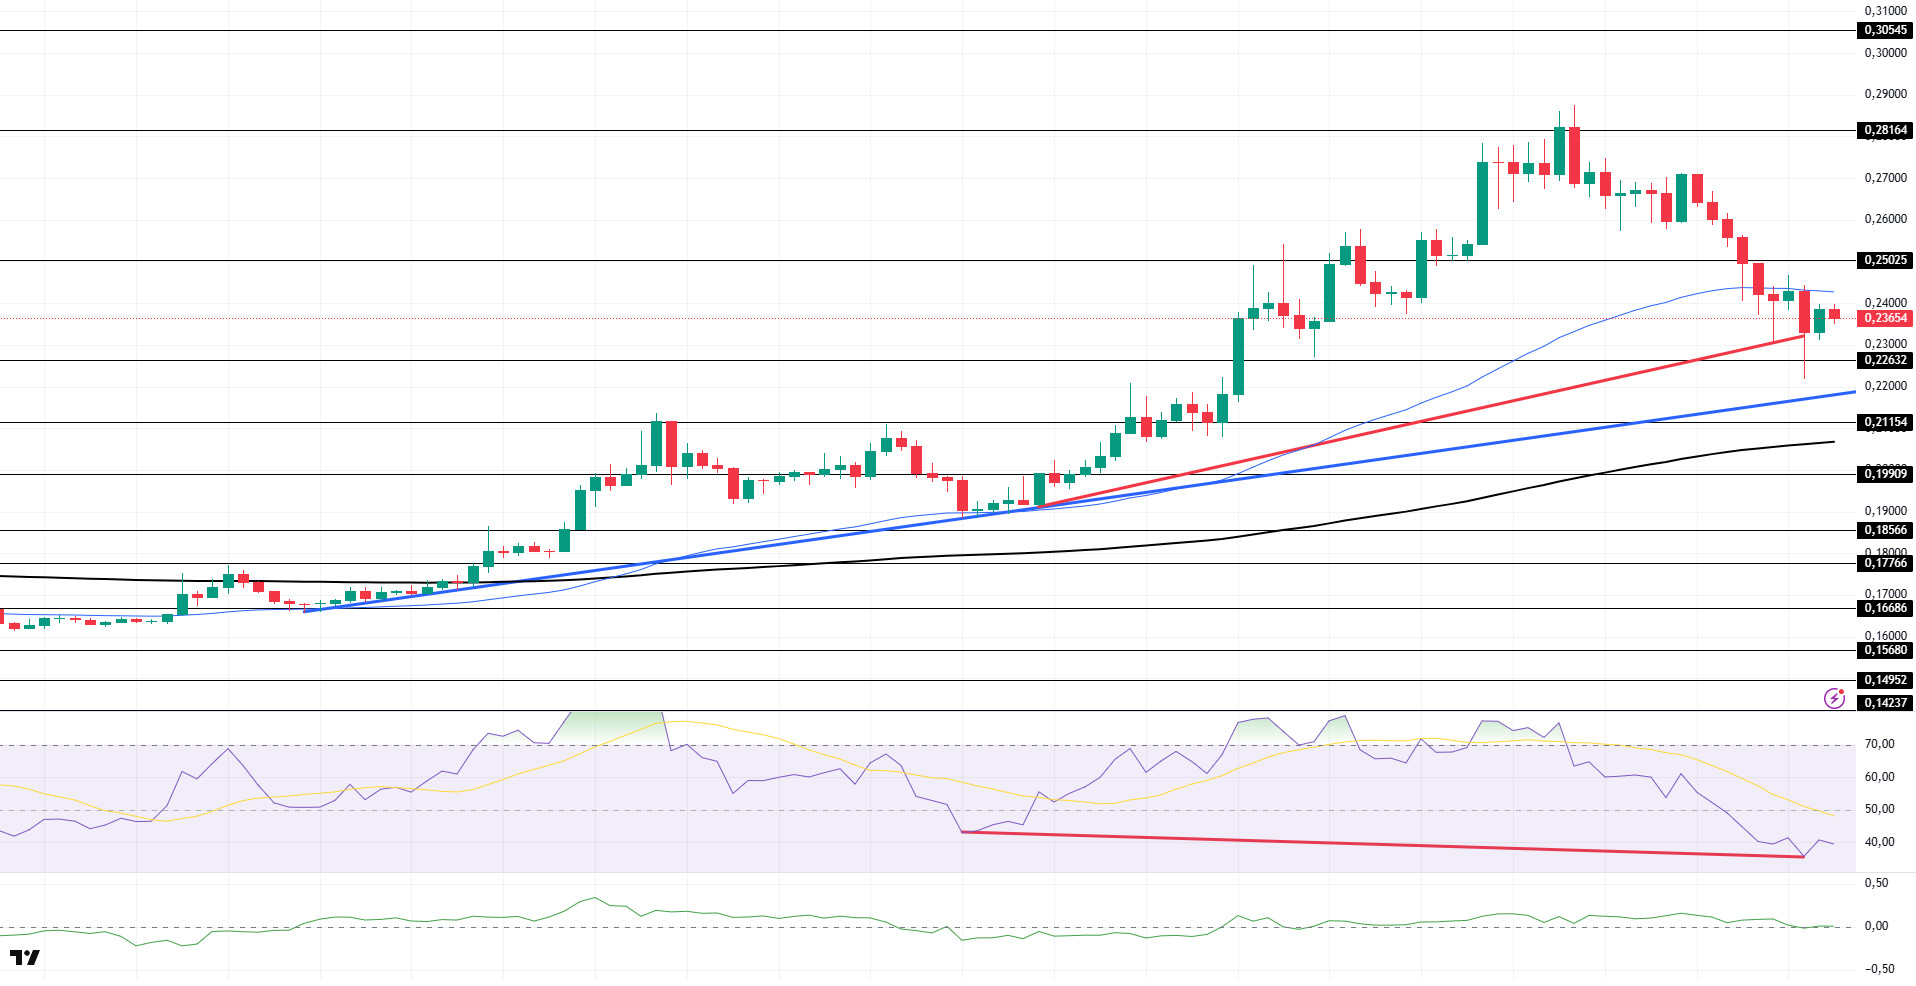
DOGE price moved sideways during the day. The asset continued to stay above the 200 EMA (Black Line) moving average with the uptrend that started on July 7. The price, which tested the $ 0.22632 level as support, accelerated upwards from here and rose slightly. In case of a continuation of the retracement, the $ 0.22632 level should be followed. If the upward acceleration starts again, it may test the $ 0.25025 level.
On the 4-hour chart, the 50 EMA (Blue Line) continues to be above the 200 EMA (Black Line). This suggests that the asset is bullish in the medium term. The fact that the price is between both moving averages indicates that the asset is in the decision phase in the short term. A large difference between the two moving averages may cause the price to follow a bearish or sideways trend. Chaikin Money Flow (CMF-20) is in neutral territory. In addition, positive money inflows may move CMF into positive territory. Relative Strength Index (RSI-14) retreated to the middle of the negative zone. In addition, there is a positive mismatch pattern. This may push the price higher. The $0.25025 level stands out as a strong resistance zone in the event of a rally in line with political developments, macroeconomic data or positive news flow in the DOGE ecosystem. In the opposite case or possible negative news flow, the $0.22632 level may be triggered. In case of a decline to these levels, the momentum may increase and a new bullish wave may start.
Supports 0.22632 – 0.21154 – 0.19909
Resistances 0.25025 – 0.28164 – 0.30545
Legal Notice
The investment information, comments and recommendations contained herein do not constitute investment advice. Investment advisory services are provided individually by authorized institutions taking into account the risk and return preferences of individuals. The comments and recommendations contained herein are of a general nature. These recommendations may not be suitable for your financial situation and risk and return preferences. Therefore, making an investment decision based solely on the information contained herein may not produce results in line with your expectations.

