
Technical Analysis
BTC/USDT
The meeting between Trump and Powell focused on key issues such as growth, inflation and employment in the US economy. There is no consensus between the parties, Trump continues to insist on interest rate cuts while Powell reiterates that steps will be taken based on data. In addition, the Trump administration announced that they are considering imposing tariffs of up to 15% for 150 days. On the other hand, the Federal Court of Appeals issued a temporary stay on the International Trade Court’s ruling against Trump’s tariff policies. While all these developments are taking place, the Fed’s monetary policymakers continue to make cautious statements on economic uncertainties and the possibility of a rate cut. On the last day of the Bitcoin 2025 conference, important names gave messages about the importance of Bitcoin. On the last trading day of the week, US PCE data in the data set will be followed by statements from Fed members.
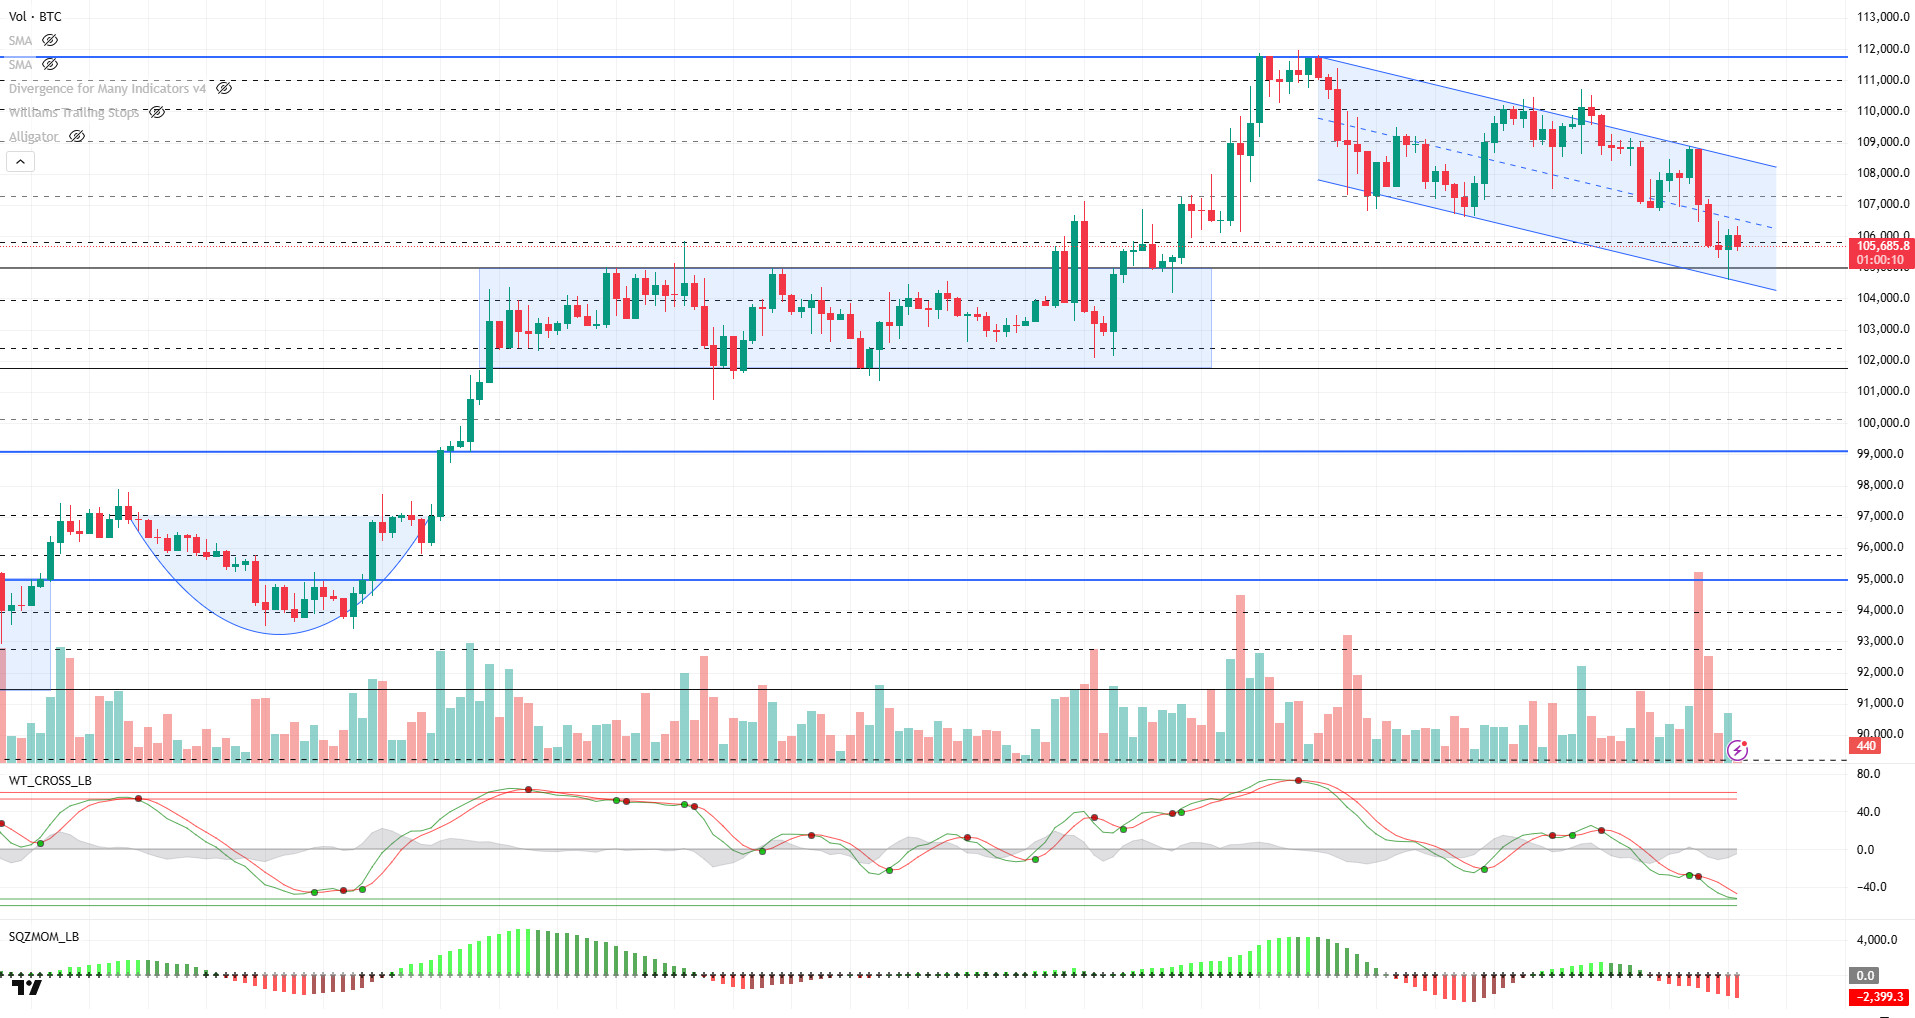
When we look at the technical outlook with the latest developments, it is seen that BTC continues to move within the downtrend structure and despite the buying signal yesterday, it has moved down again by not exceeding the trend upper line. With the loss of the 107,300 support level, testing the 105,800 level, where there were intense buying positions in liquidation data, was one of the expected technical scenarios. Although there was a short-term recovery with the reaction from this level, BTC has fallen back to this level again. As we emphasized in previous analyses, there was not enough technical ground to break the downtrend structure and the price did not seem ready for a strong rise without liquidity cleansing. Currently, BTC is trading in a critical demand gathering zone for bullish potential. The technical oscillator maintains a sell signal despite being in oversold territory, while momentum indicators remain weak. This suggests that there are still technical barriers to a strong upside move in the short term. In the future, the 105,000 level will be followed as a critical threshold. As long as the price stays above this level, a new upward trend may be possible. In this scenario, the 107,300 level stands out as the first resistance point, while a breakout of this level on volume could give BTC momentum again and start a move towards the ATH level. Liquidation data shows that sell positions are on the rise and there is significant accumulation, especially at the ATH level (around 111,800). This supports that this could be the targeted area in case the uptrend resumes. On the other hand, if the selling pressure continues, the 104,400 – 104,000 band will be followed as the next support area in case of loss of 105,000 level.
Supports 105,800 -105,000 -104,400
Resistances 107,300 – 109,000 – 110,000
ETH/USDT
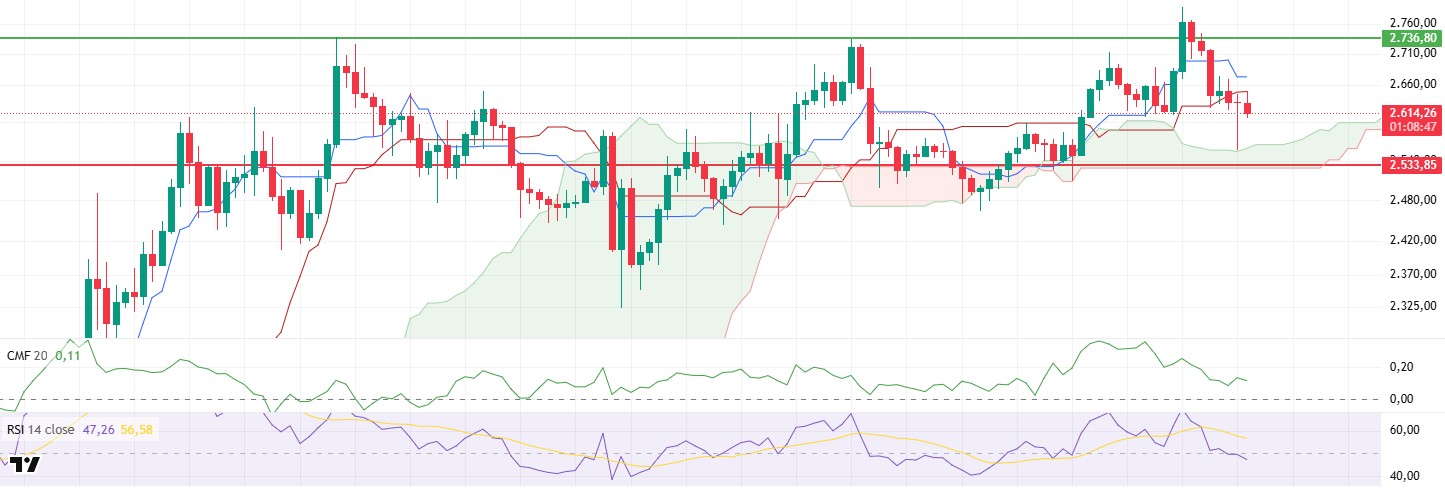
As mentioned in yesterday’s evening analysis, ETH experienced a sharp retracement yesterday evening due to technical weaknesses. In particular, bullish attempts without volume and the weak structure seen in technical indicators prepared this decline step by step. The price fell as low as $2,558, the upper band of the kumo cloud on the ichimoku indicator. This area was an important support point and the price took a short-term reaction from here and rose above the $2,600 level again. However, this recovery was not permanent. Although the price approached the kijun line at $2,650, it turned down again with sales from this region.
Analysing the Ichimoku indicator, the price is still trying to stay above the kumo cloud. While this seems to be technically supportive, it is not enough on its own. The fact that the tenkan line has turned down and the price has made four-hour closes below both the tenkan and kijun levels suggests that upside momentum remains weak. This type of structure usually reflects that buyers are holding back in the short term and the market is struggling to find direction. The Relative Strength Index (RSI) is not much better. The indicator continues to move down without producing any positive divergence despite the price decline. This suggests that the market currently lacks the potential for a strong rebound and the lack of momentum is evident. This weakness in the RSI is an important signal to understand why bullish attempts are met with continuous selling. The Chaikin Money Flow (CMF) indicator also remains bearish. Although it is still in positive territory, the decline in momentum and its approach to the zero line indicates a weakening in the internal dynamics of the market. In other words, capital inflows remain limited and even outflows are becoming more prominent. This suggests that the strong buying waves that would support the price movement are not in place for now.
To assess the possibilities for future movements; If the price sags below the $2,600 level again, it may lead to a retest of the $2,558 level. If this area is lost, the decline may deepen a bit more and lower supports may come into play. On the other hand, in order for the recovery scenario to come into play, the price needs to clearly break the kijun resistance around $2,650 in the first place. Exceeding this level could trigger a recovery in technical indicators and change the market perception upwards. However, as of the current structure, there is no strong sign yet that this resistance level can be easily overcome.
Top of Form
Below the Form
Supports 2,533 – 2,254 – 2,029
Resistances 2,736 – 3,062- 3,246
XRP/USDT
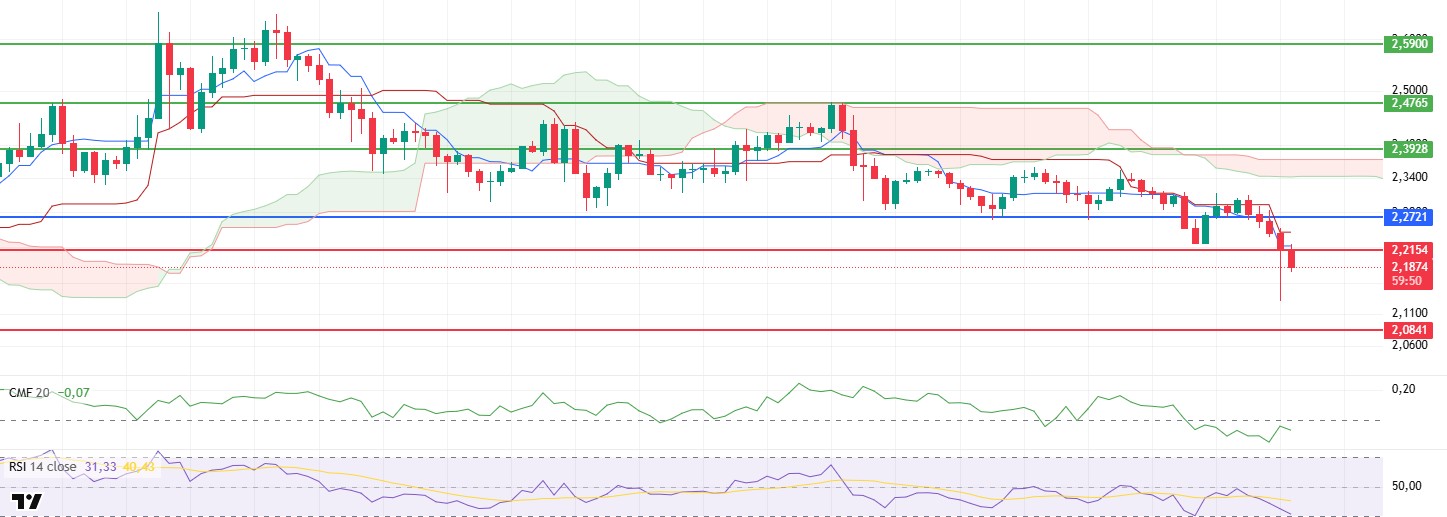
XRP accelerated its downward movement by breaking the intermediate support at the $2.27 level yesterday evening. After this break, it first fell to the main support at the level of $2.21. However, when there was not enough buyer response from this region, the decline deepened, and the price fell sharply to $2.13. In the morning hours, the price recovered again and tested the $2.21 level but could not be sustained at this level. After this attempt, where buyers remained weak, the selling pressure gained weight again and the price continued its downward movement.
Relative Strength Index (RSI) was the most striking element on the technical indicators. The RSI indicator fell to the oversold zone after the sharp decline. This suggests that the momentum in the market has seriously weakened, and buyers have not yet clearly stepped in. This low level in the RSI also suggests that the price remains under pressure and even if there is an upward reaction in the short term, it may be difficult to persist. The Chaikin Money Flow (CMF) indicator also clearly reflects the liquidity situation in the market. Although there was a short-lived recovery effort in the indicator after the recent decline, this attack was limited and CMF headed down again. This picture reveals that there is no meaningful inflow of money into the market, on the contrary, outflows continue. Looking at the Ichimoku indicator, it is seen that the negative structure is maintained. The price continues to trade below the kumo cloud and the ichimoku levels are generally trending down. The widening distance between the kijun and tenkan lines indicates that the price is unstable and technically unlikely to recover. Staying below the cloud structure also supports that the risks are still to the downside in the medium-term outlook.
The overall outlook shows that the decline is supported after technical breakouts, and the market is not in a position to make an upward turn for the time being. The $2.08 level is the most critical support. Since this region has been a ground where reaction purchases have come in the past, the possibility of holding the price here in the short term is on the table. However, if this support is broken, it may become possible to deepen the decline and test psychological supports. In order to be able to talk about an upward scenario, the price must first regain the $2.215 level. Exceeding this region in a voluminous way may both initiate a recovery on the RSI side and open the way for the price to make a bullish attempt up to the lower band of the ichimoku cloud.
Supports 2.0841 – 2.0402 – 1.9276
Resistances 2.2154 – 2. 3928 – 2. 4765
SOL/USDT
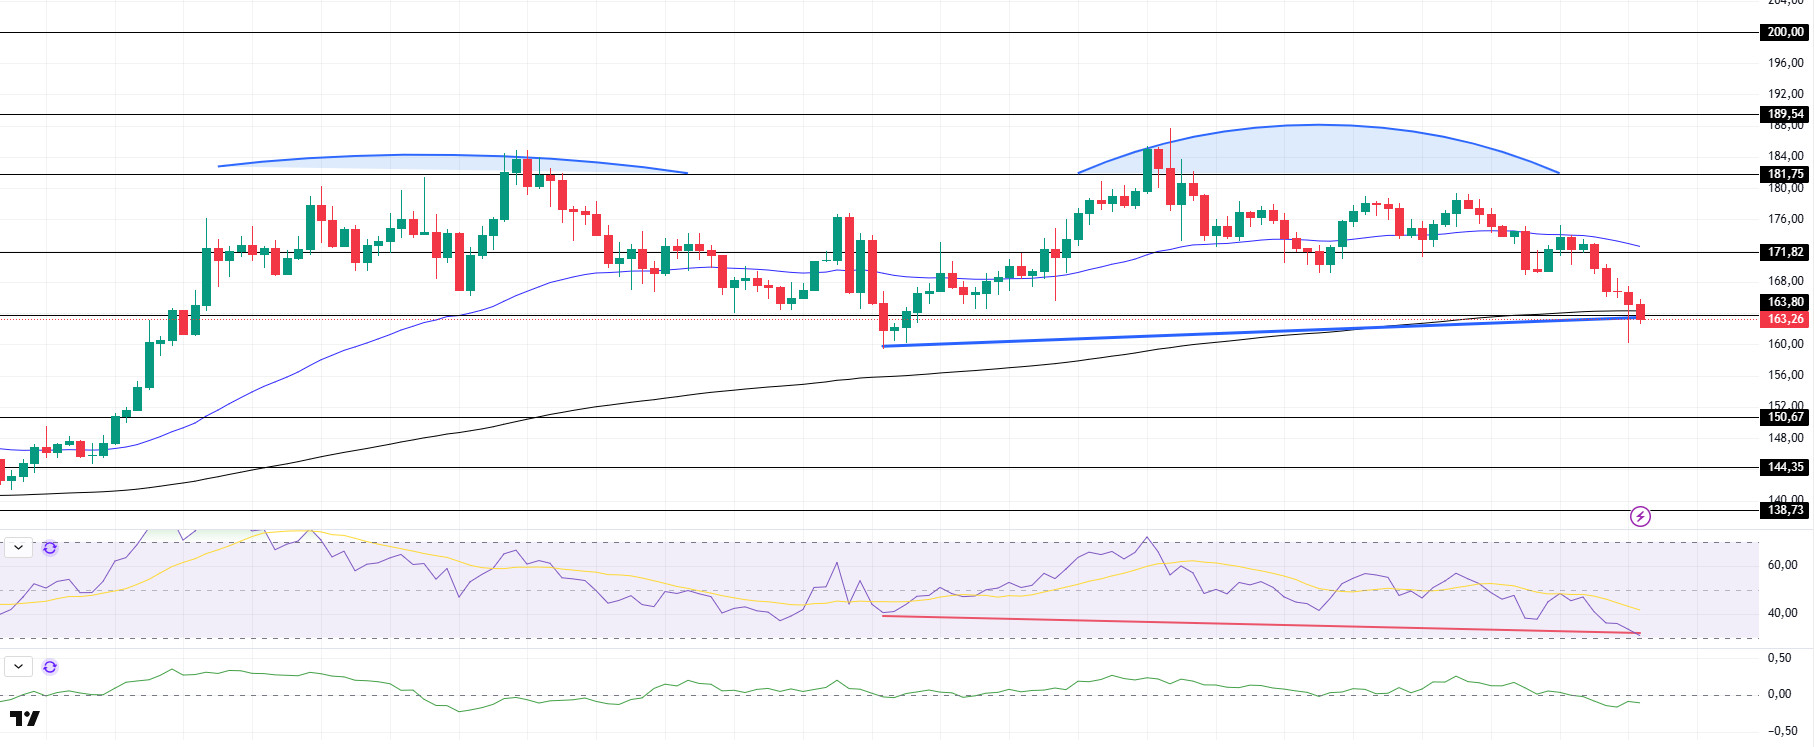
SOL price was bearish. The asset tested the strong support at $163.80 as a support and was slightly bullish. Currently, it continues to test the 200 EMA (Black Line) as support. On the other hand, the double top pattern should be followed. On the 4-hour chart, the 50 EMA (Blue Line) remained above the 200 EMA (Black Line). This suggests that the uptrend may continue in the medium term. However, the fact that the price is between both moving averages suggests that the market is currently in a decision-making phase. Chaikin Money Flow (CMF-20) is in the negative territory near the neutral level; in addition, a decline in daily inflows may move CMF into negative territory. Relative Strength Index (RSI-14) continued to be in negative territory again. At the same time, there is an upside divergence. This could be bullish. The $181.75 level stands out as a strong resistance point in case of a bullish breakout on the back of macroeconomic data or positive news on the Solana ecosystem. If this level is broken upwards, the rise can be expected to continue. If there are pullbacks due to contrary developments or profit realizations, the $150.67 level may be retested. In case of a decline to these support levels, the increase in buying momentum may offer a potential bullish opportunity.
Supports 163.80 – 150.67 – 144.35
Resistances 171.82 – 181.75 – 189.54
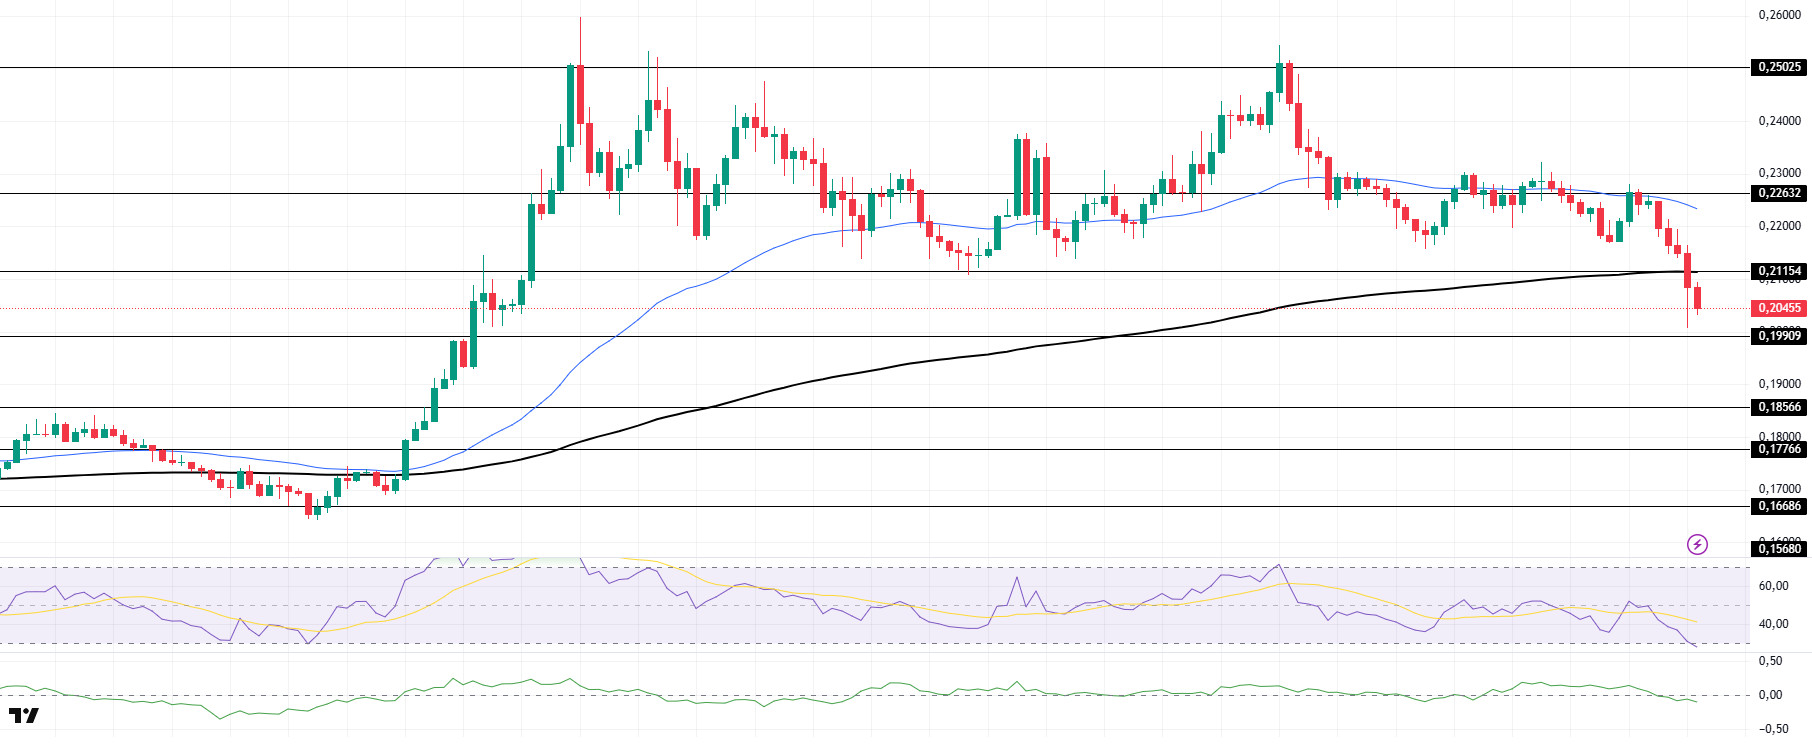
DOGE/USDT
The DOGE price kept pace with the crypto market and declined. The asset broke the long-held $0.25025 to $0.21154 band to the downside and continued to depreciate. The price broke the 200 EMA (Black Line) moving average with a strong candle to the downside and positioned below the moving average. The $0.19909 level should be followed in case the retracement falls. On the 4-hour chart, the 50 EMA (Blue Line) continued to hold above the 200 EMA (Black Line). The fact that the price remains below the two moving averages shows us that the asset has a bearish bias in the short term. The Chaikin Money Flow (CMF-20) indicator is at a neutral level. In addition, negative money inflows may move CMF into negative territory. The Relative Strength Index (RSI-14), on the other hand, has moved into negative territory and is now in the oversold zone. This may lead to slight rises. The $0.22632 level stands out as a strong resistance zone in case of a rally in line with political developments, macroeconomic data or positive news flow in the DOGE ecosystem. In the opposite case or possible negative news flow, the $0.19909 level may be triggered. In case of a decline to these levels, the increase in momentum may start a new bullish wave.
Supports 0.19909 – 0.18566 – 0.17766
Resistances 0.21154 – 0.22632 – 0.25025
Legal Notice
The investment information, comments and recommendations contained herein do not constitute investment advice. Investment advisory services are provided individually by authorized institutions taking into account the risk and return preferences of individuals. The comments and recommendations contained herein are of a general nature. These recommendations may not be suitable for your financial situation and risk and return preferences. Therefore, making an investment decision based solely on the information contained herein may not produce results in line with your expectations.


