
Technical Analysis
BTC/USDT
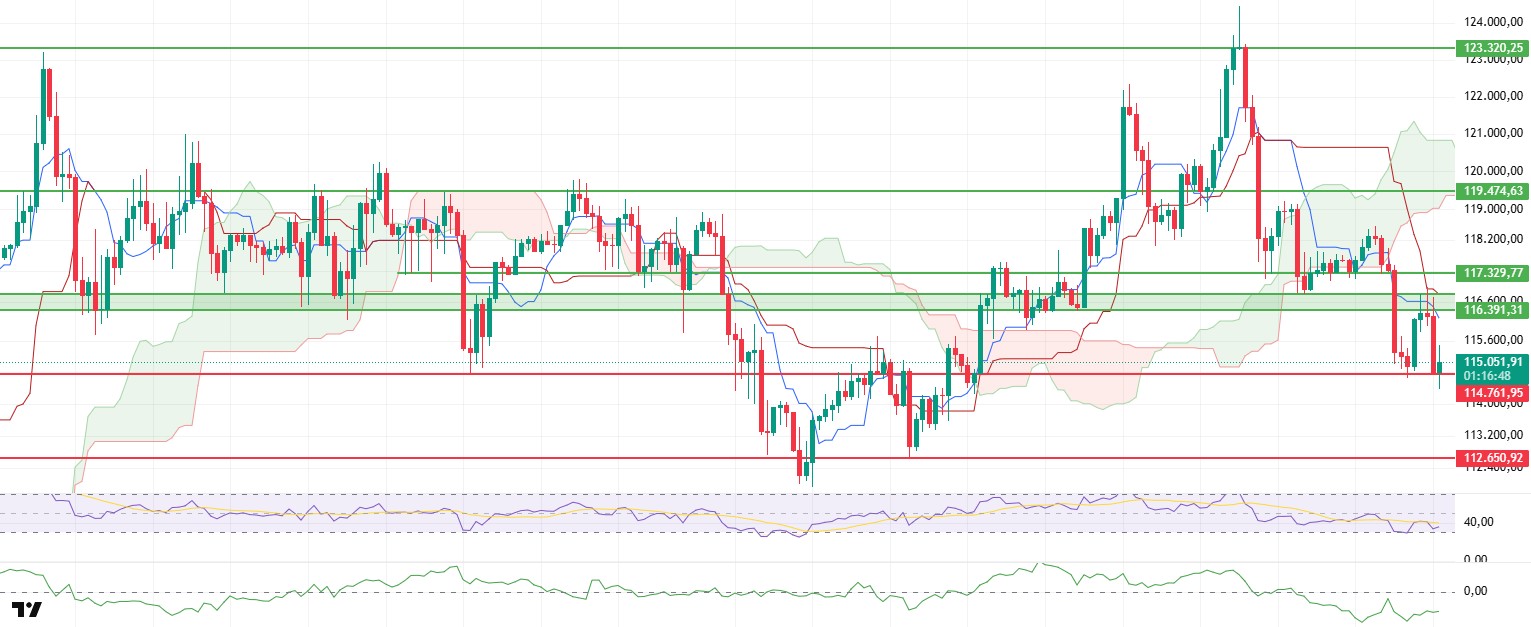
The Bitcoin price rose to the upper boundary of the critical resistance zone marked in green on the chart at the 116,900-dollar level during the evening hours yesterday but then faced a sharp sell-off during the night, retreating back to the support zone at the 114,761-dollar level. While the price is currently attempting to hold steady in this area, both on-chain data and technical indicators continue to show signs of weakness.
The decline in open interest in the futures markets to $38.59 billion indicates that long positions opened at very high levels in the market have begun to close. Meanwhile, the decline in the funding rate also supports this view, pointing to a decline in leveraged buying appetite.
On the liquidity front, the Chaikin Money Flow (CMF) indicator continuing its horizontal trend in the negative zone indicates that outflows from the market are continuing and that selling pressure remains strong.
From a technical perspective, yesterday’s short-term rebound carried the price up to the kijun and tenkan levels on the Ichimoku indicator, but it encountered renewed selling pressure in this region. The price continuing to trade below the kumo cloud in the Ichimoku structure confirms that both the short-term trend and the overall market structure appear negative.
The Relative Strength Index (RSI) momentum indicator remains below the reference MA line and near the oversold zone, maintaining its structural weakness. This serves as another factor supporting the increased risk of a decline in the short term.
When evaluating the overall outlook, if the support level of $114,761 is lost, the price is likely to retreat to $112,650. On the other hand, if this support level is maintained, the price is expected to continue its consolidation process and maintain its horizontal movement in the short term.
Support levels: 114,761 – 112,650 – 110,936
Resistance levels: 117,329 – 119,474 – 123,320
ETH/USDT
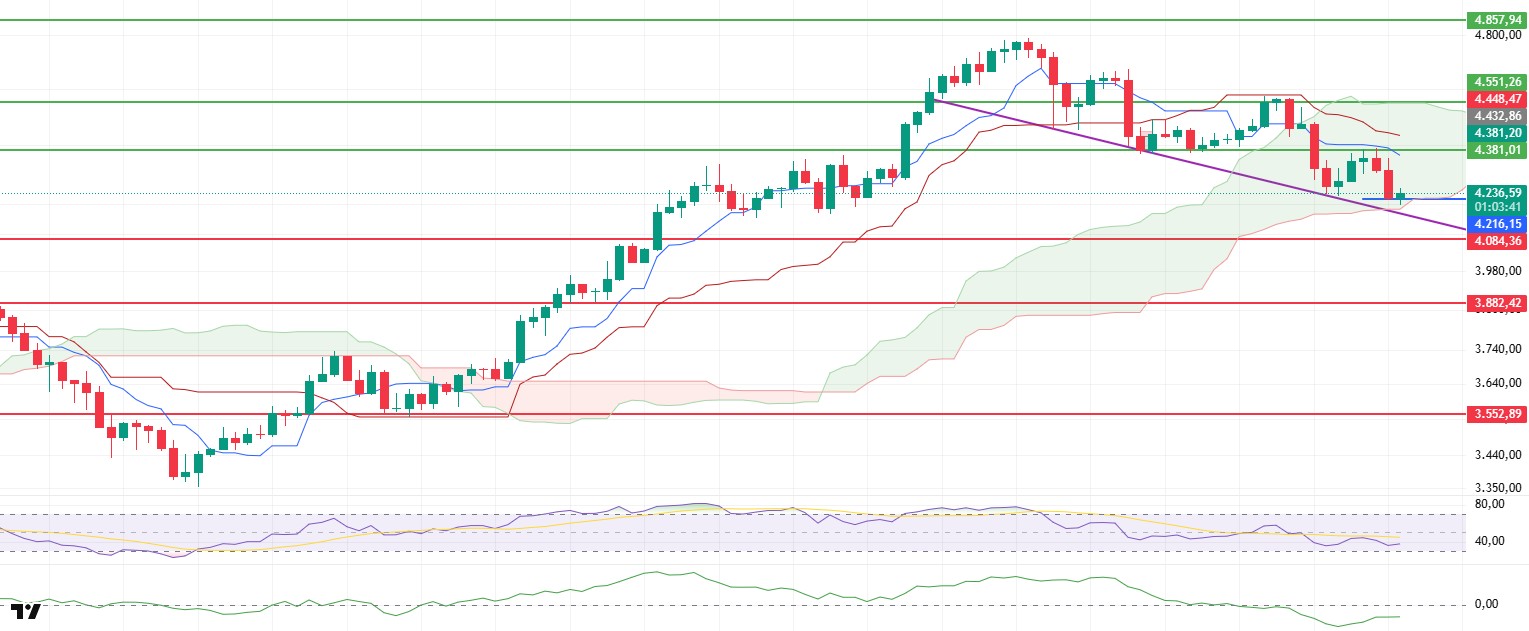
As mentioned in yesterday evening’s analysis, the ETH price rose to the resistance level of $4,381 due to the impact of technical weakness. However, it quickly retreated to the $4,200 level after encountering selling pressure in this region. This movement indicates that short-term buying power is weak and that the uptrend is not supported by volume.
Looking at the spot trading volume, the continued decline in the Cumulative Volume Delta (CVD) indicator indicates that buying volume in spot markets is decreasing and participants are tending to avoid risk at current price levels. This erosion in volume could pave the way for declines to occur more rapidly and deeply under low liquidity conditions. Meanwhile, despite price pullbacks, the long/short ratio shows that long positions continue to be opened. This scenario suggests potential liquidation clusters, meaning the current downtrend could intensify further as newly opened long positions are unwound.
The Chaikin Money Flow (CMF), which measures liquidity flow, has seen a slight rebound from negative territory but remains negative, clearly confirming that fund outflows are continuing and that sellers remain dominant.
From the Ichimoku indicator perspective, the price has retreated to the lower band of the Kumo cloud and found weak support here. In technical terms, daily closes below the lower band of the kumo cloud at 4,216 dollars will be considered a breakout confirmation. In such a breakout, the first major support level is at 4,084 dollars. A move below 4,084 would deepen the technical breakdown and could trigger a faster downward movement.
In the alternative scenario, if the price holds above $4,216, the market may attempt a limited recovery, targeting the $4,300–$4,381 range. However, for such a recovery to be sustainable, CVD, CMF, and futures market indicators (open interest, funding rate) must also show positive signs of recovery. Otherwise, upward attempts will remain volume-less and short-lived.
In conclusion, the short-term outlook is risk-heavy. The lower band of the Kumo cloud at $4,216 should be monitored as a key threshold. Closures below this level would confirm a bearish scenario, while holding above it would increase the likelihood of consolidation and a limited rebound. Changes in on-chain liquidity indicators and futures market dynamics (particularly the long/short ratio, open interest, and funding rate) will provide critical confirmations regarding trend changes or momentum gains.
Top of Form
Below the Form
Support levels: 4,084 – 3,882 – 3,552
Resistance levels: 4,381 – 4,551 – 4,857
XRP/USDT
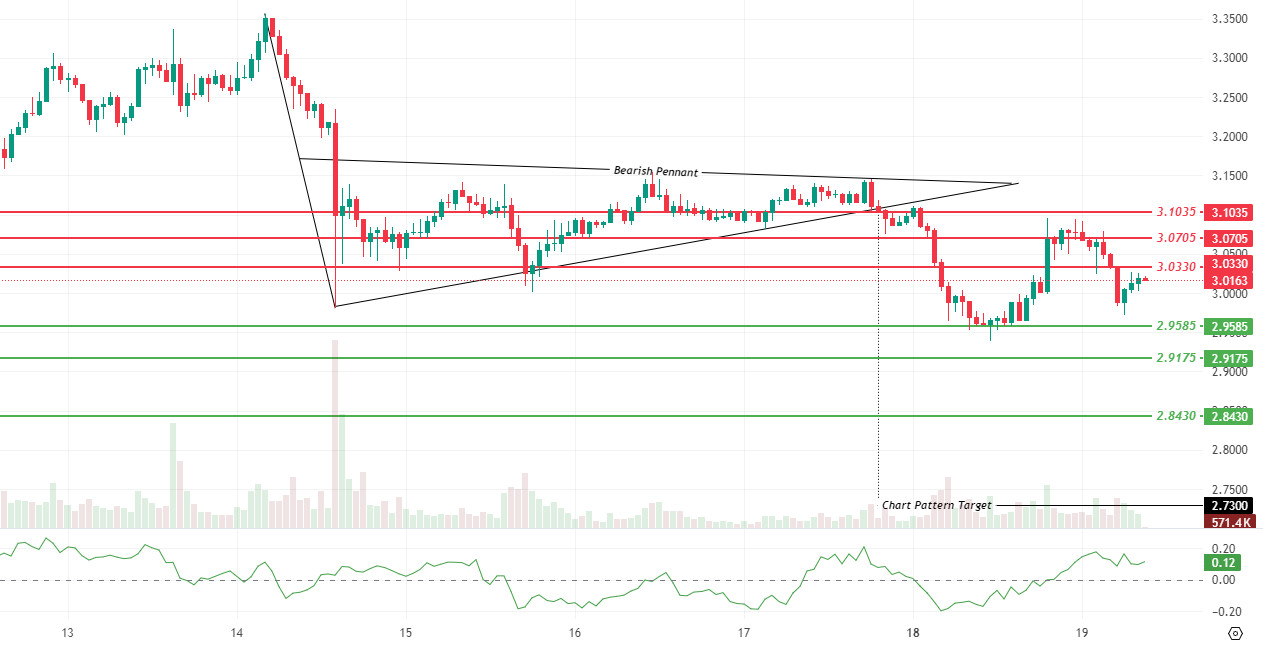
Significant developments in the XRP market have drawn attention from both the regulatory front and market behavior. The U.S. Securities and Exchange Commission (SEC) has postponed the review period for spot and derivative ETF applications for numerous cryptocurrencies, including XRP, until October. This decision has left the long-awaited process of opening institutional investment channels in the market shrouded in uncertainty. While spot ETF approvals are critical for the crypto market, the postponement decision has created limited pressure on investor confidence in the short term. The delay in the entry of institutional funds has not caused sudden price movements but has led to continued cautious appetite. Within the XRP community, the view emerged that the delay in approval does not cast doubt on the ecosystem’s regulatory compliance but merely extends the timeline. Meanwhile, another development capturing market attention was the price movements of XRP around the $3 level. This threshold serves not only as a technical barrier but also as a significant psychological turning point for investors. In particular, transactions originating from a single large wallet significantly influenced market commentary. Shortly after approximately $2 million in long positions were closed at the $3.10 level, the same wallet opened $1 million in short positions at the $3.08 level. This sudden and sharp position shift demonstrated that the $3 level was an actively traded decision point. The fact that the transactions were executed through a single address highlighted the influence of major players in determining the market’s direction. The key point of debate within the community was the opening of a short position shortly after the long position was closed. This suggested that the actor in question was not only taking profits but also strategically attempting to increase downward pressure. The $3 band has thus become a testing ground not only in technical analysis but also in market psychology. While some analysts interpreted this move as an attempt to instill fear in the market, others argued that it could simply be a risk-hedging strategy. However, in either case, signs of the fragility of the $3 level and the possibility of high volatility in the coming days have strengthened.
On the technical side, the selling pressure that began after the downward break of the Bearish Pennant formation carried over to the $2.9585 support level. With the reaction from this level, the price entered a recovery attempt and is currently trying to hold above the $3.0025 support level. In the short term, the $3.0025 and $3.0330 range is a critical resistance level, and any upward attempts may remain limited unless hourly closes above this band occur. Above that, the $3.0705 and $3.1035 levels stand out as strong resistance levels. , the first support level, remains at $2.9585. If this level is broken, the $2.9175 and $2.8430 regions could come back into focus. The measured target of the formation at $2.73 reminds us that the downside risk remains.
Although trading volume increased during the breakout, it remained weak during recent recovery attempts, indicating that buyers are struggling to gain momentum. The Chaikin Money Flow (CMF) indicator is at around 0.12 and in positive territory, signaling a recovery from the previous days’ negative trend. This suggests that capital inflows have shifted back to the positive side, albeit limited, and are acting as a supportive factor in the short term. If the price manages to sustain a move above the 3.0330 dollar level, this signal could gain more strength; otherwise, selling pressure may resurface.
Support levels: 2.9585 – 2.9175 – 2.8430
Resistance levels: 3.0330 – 3.0705 – 3.1035
SOL/USDT
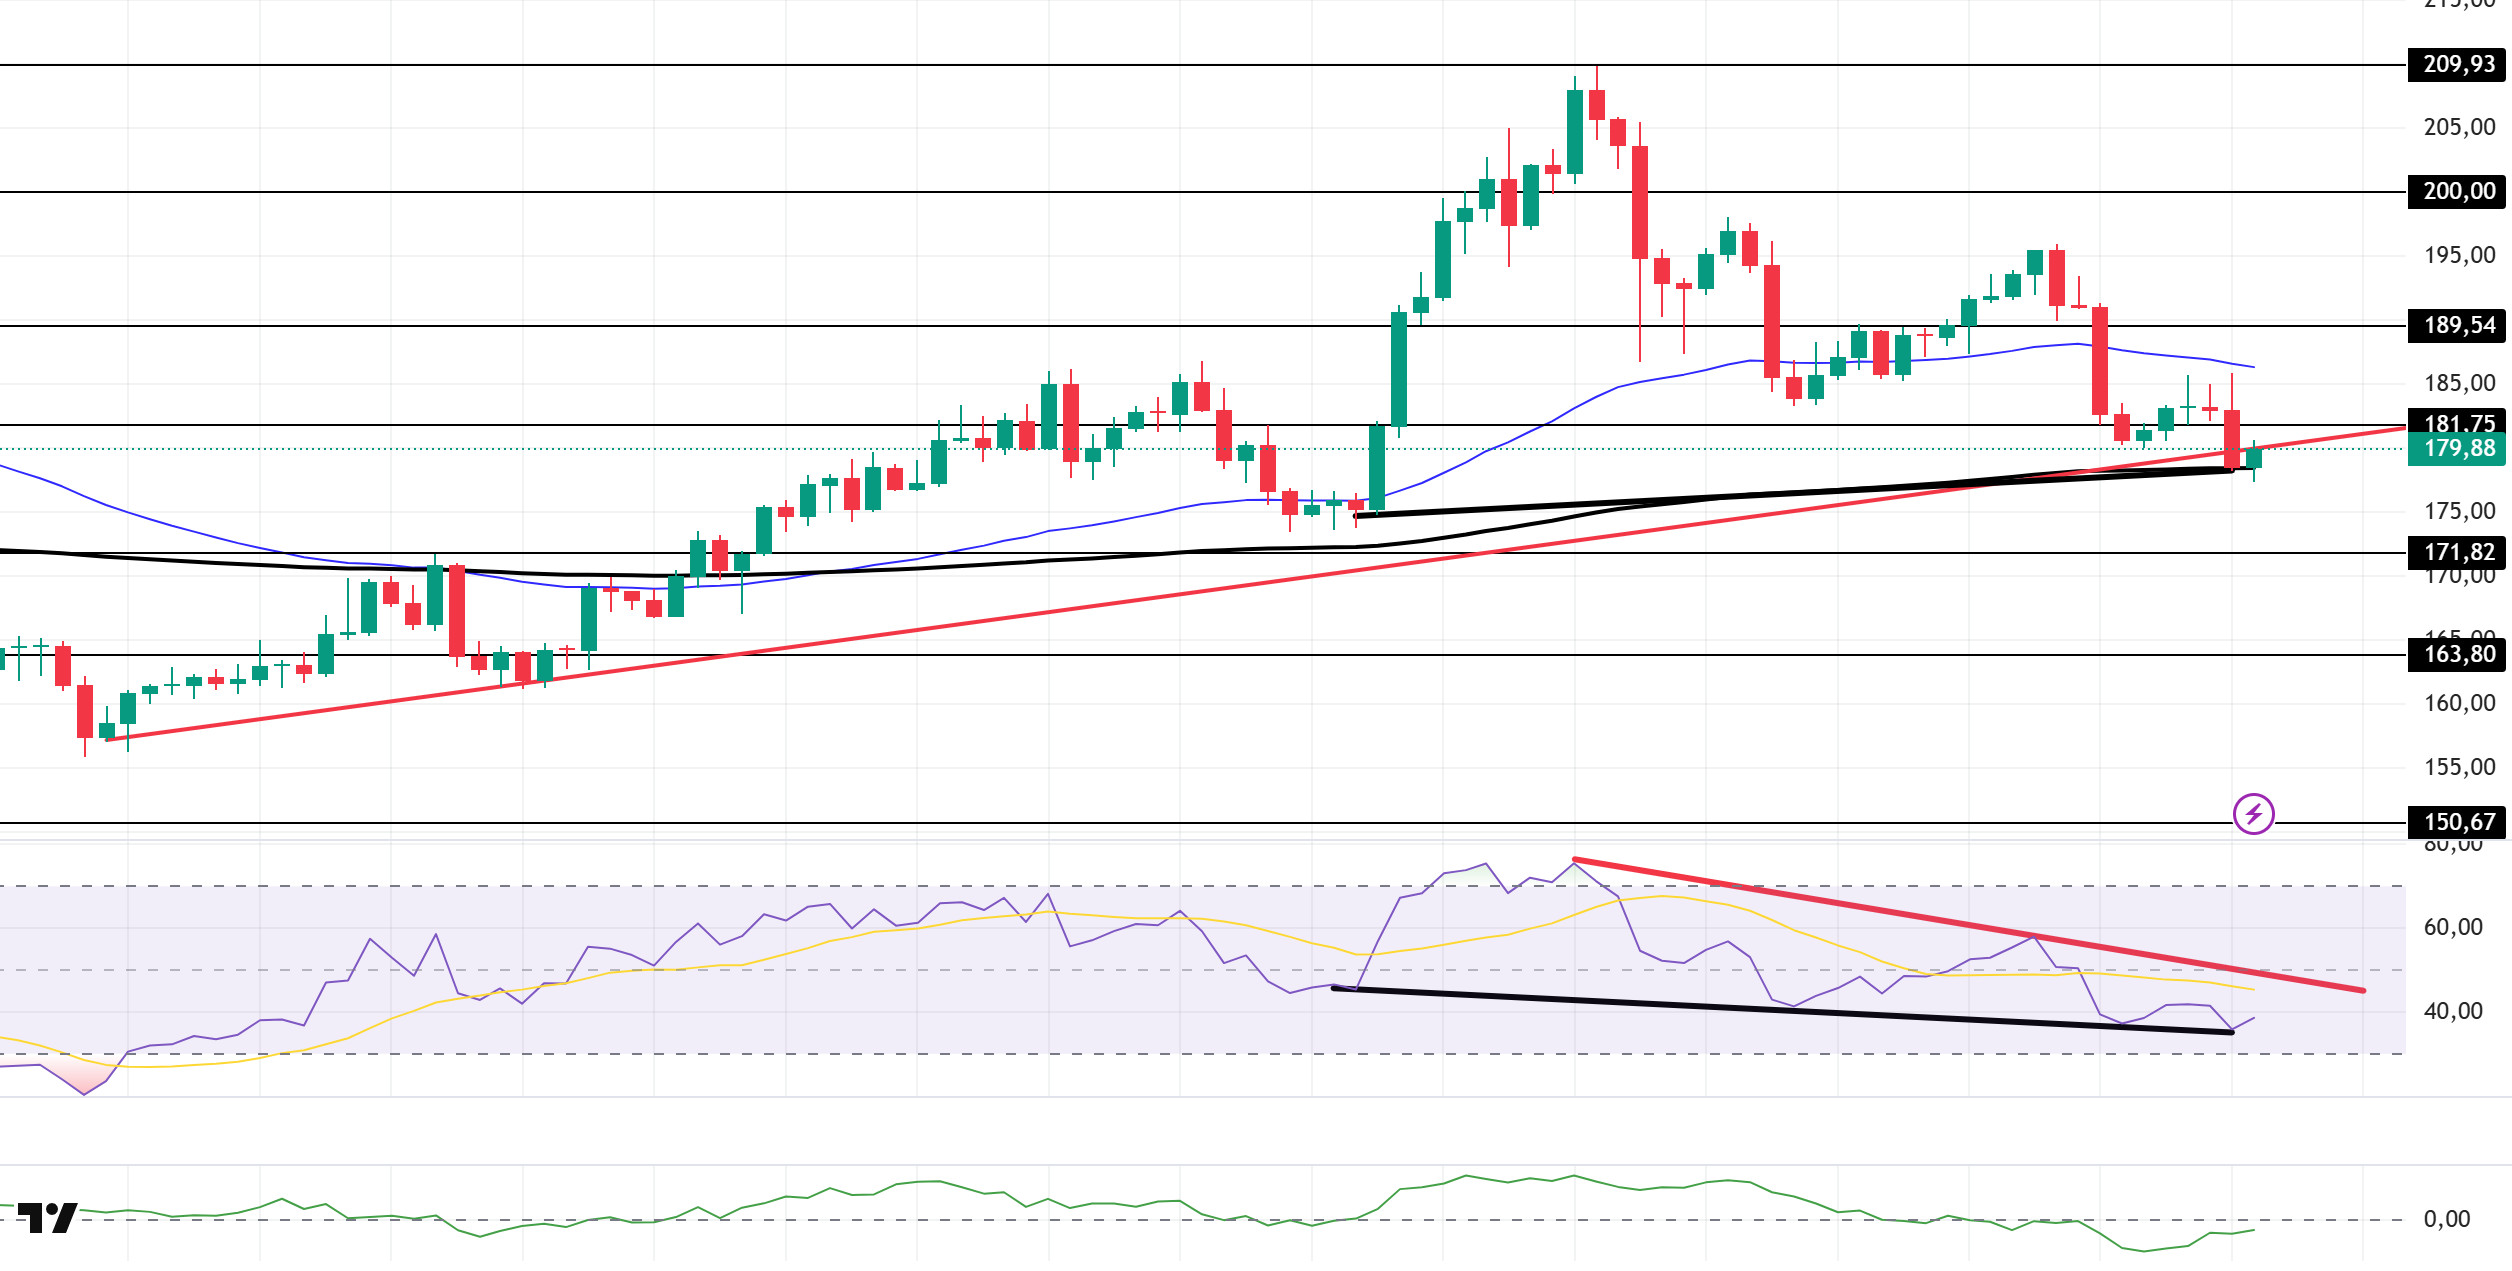
The SOL price continued its decline. The asset crossed below the upward trend line that began on August 2. This could increase selling pressure. The price, which broke below the $181.75 level, is currently testing the 200 EMA (Black Line) moving average as support. A pullback may continue if the price closes below this level. In potential upward movements, the 50 EMA (Blue Line) should be monitored.
On the 4-hour chart, the 50 EMA (Blue Line) remained above the 200 EMA (Black Line). This indicates that the upward trend may continue in the medium term. At the same time, the price being between the two moving averages shows that the market is in a decision phase in the short term. Chaikin Money Flow (CMF-20) remained in negative territory. However, the decrease in money inflows could push CMF deeper into negative territory. The Relative Strength Index (RSI-14) continues to remain below the downward trend that began on August 14. This indicates that selling pressure is continuing. On the other hand, there is a positive divergence, which could lead to an uptrend. If an uptrend occurs due to positive macroeconomic data or news related to the Solana ecosystem, the $189.54 level emerges as a strong resistance point ( ). If this level is broken upward, the uptrend is expected to continue. In the event of a pullback due to adverse developments or profit-taking, the 171.82 dollar level could be tested. A decline to these support levels could see an increase in buying momentum, presenting a potential opportunity for an upward move.
Support levels: 171.82 – 163.80 – 150.67
Resistance levels: 181.75 – 189.54 – 200.00
DOGE/USDT
SEC postpones decision on Grayscale spot DOGE ETF.
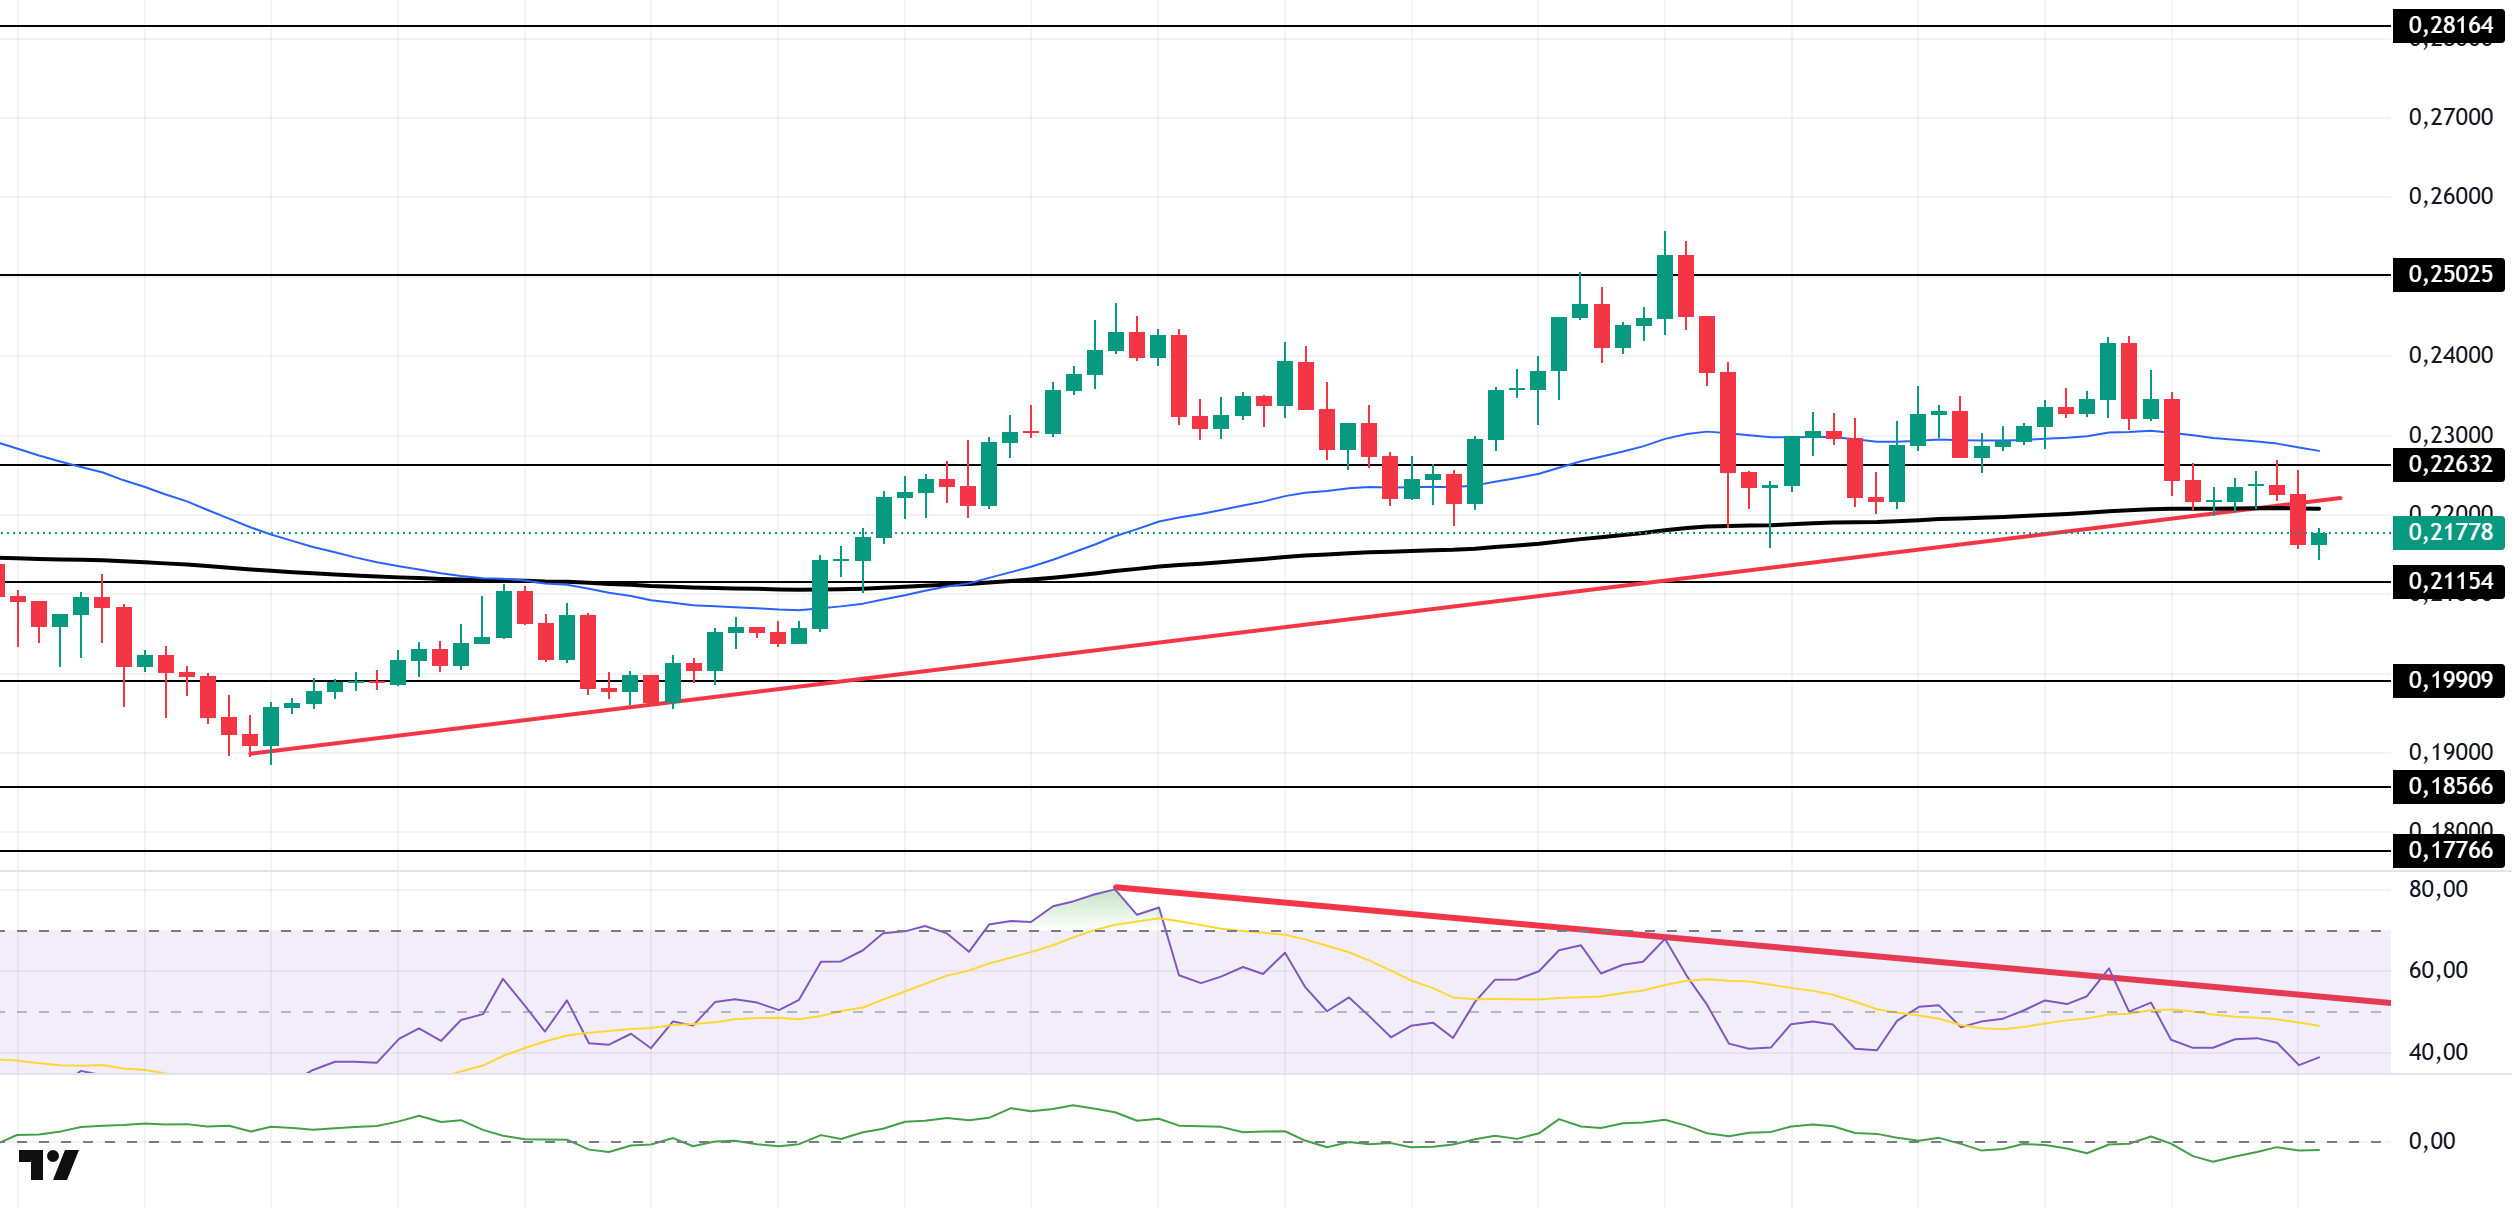
The DOGE price continued its downward trend. The asset broke below the rising trend that began on August 2 and the 200 EMA (Black Line) moving average. These could increase selling pressure. As of now, the price, which remains below these levels, may test the strong support level at $0.21154. In the event of an uptrend, the 50 EMA (Blue Line) moving average should be monitored.
On the 4-hour chart, the 50 EMA (blue line) continues to remain above the 200 EMA (black line). This indicates that the asset is in an upward trend in the medium term. The fact that the price is below both moving averages indicates that the asset is in a downward trend in the short term. Chaikin Money Flow (CMF-20) continues to remain in negative territory. Additionally, negative cash inflows could push the CMF further into the negative zone. The Relative Strength Index (RSI-14) remains in the negative zone. It also continues to stay below the downward trend that began on August 9, indicating that selling pressure persists. In the event of potential increases driven by political developments, macroeconomic data, or positive news flow within the DOGE ecosystem, the $0.22632 level emerges as a strong resistance zone. In the opposite scenario or in the event of negative news flow, the 0.21154 dollar level could be triggered. A decline to these levels could increase momentum and potentially trigger a new upward wave.
Support levels: 0.21154 – 0.19909 – 0.18566
Resistance levels: 0.22632 – 0.25025 – 0.28164
SHIB/USDT
The Shiba Inu ecosystem is focusing on infrastructure and supply management. With the planned Chainlink CCIP integration for Shibarium, SHIB, BONE, LEASH, and TREAT tokens will be able to operate on different blockchains, while burns will continue to occur on Ethereum. This architecture enhances cross-chain interoperability while keeping the deflationary effect at the core. Network usage metrics are strengthening. Shibarium has surpassed the 1.5 billion transaction mark and has approximately 267,000 active addresses. This indicates steady progress in L2 infrastructure adoption and creates a more attractive environment for the developer ecosystem. On the supply side, community-driven burn initiatives are gaining traction. Weekly SHIB burns reported reached 631 million, with a burn rate increase of 367%. Maintaining this pace could contribute to a gradual tightening of the circulating supply and support the long-term balance of the tokenomics structure. Operational processes are also maturing. The team is moving burn operations to a more regular and error-free framework with Chainlink automation. This approach increases transparency throughout the transaction chain and reduces discrepancies that could arise from manual errors. There has been notable activity on the ownership side. A transfer of 3 trillion SHIB from exchanges to personal wallets has been reported. A withdrawal of this scale suggests a strengthening of self-custody preferences and a behavior set aligned with validator-based decentralization goals.
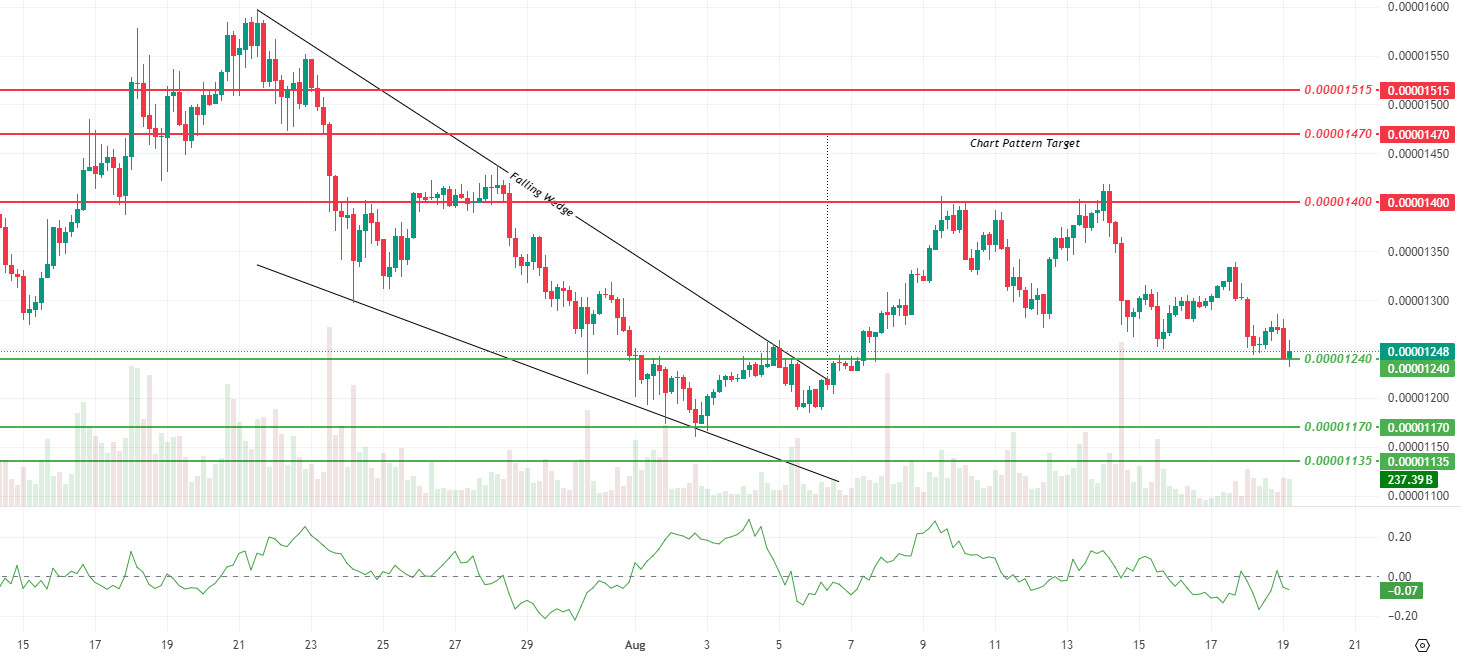
Technically, Shiba Inu tested the $0.00001240 support level during the day, and short-term recovery efforts emerged with buying at this level. This movement confirms that the $0.00001240 support level is holding for now. However, if the price remains below this level, the 0.00001170 and 0.00001135 dollar levels could come back into focus. Looking upward, the 0.00001400 dollar level remains a critical resistance level. If prices close above this level, the 0.00001470 and 0.00001515 dollar levels could emerge as targets.
The Chaikin Money Flow (CMF) indicator is at -0.07 and continues to move in negative territory. This situation reveals that capital inflows are weak despite the price’s efforts to hold at support levels. For upward movements to gain strength, resistance breakouts need to be supported by volume. In the medium-term picture, the Falling Wedge formation, which has been in effect since July 21, continues to be monitored. The theoretical target of this formation is at the 0.00001470 dollar level; however, for the price to approach this target, the market needs a stronger liquidity flow.
Support levels: 0.00001240 – 0.00001170 – 0.00001135
Resistance levels: 0.00001400 – 0.00001470 – 0.00001515
LINK/USDT
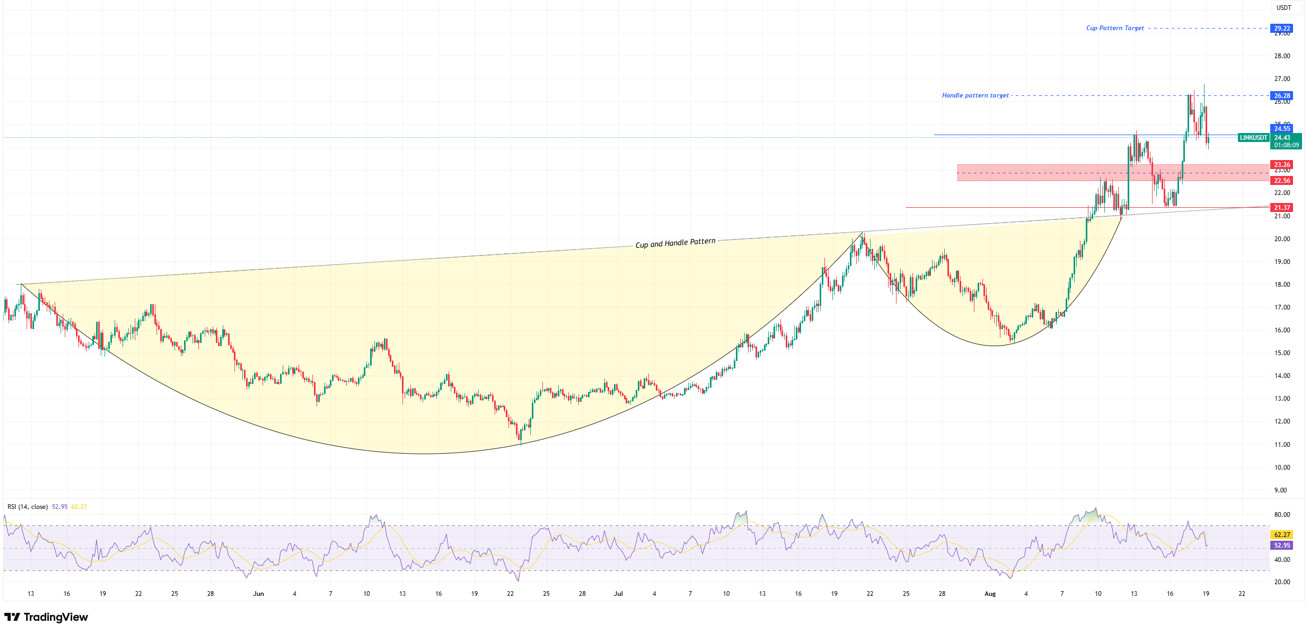
LINK broke below the support band of $24.55, which we mentioned in our previous analysis, following selling pressure from the $26.30 level. This level now acts as resistance for us. If it manages to stay above this level, it will indicate that the price is maintaining its recovery momentum, and in such a scenario, we can expect the price to test the strong resistance level at 26.30 again. Voluminous breakouts above the 26.30 level could increase the likelihood of a more aggressive positive movement toward the cup formation target of 29.70, accompanied by an acceleration in the trend.
On the other hand, if the price closes below 24.55, selling pressure could strengthen again. This movement initially highlights the 23.26 level, and if this support is lost, the correction level at the Fibonacci 0.618-0.786 zone, which is 22.56, will play a critical role. 4-hour closes below this level could create a panic atmosphere and lead to a deeper decline. The last positive support level for the trend to remain intact despite the declines is the $21.37 level, which is both a trend and horizontal support level. Although prices above this level may create short-term uncertainty, it is important to remember that the price is still in positive territory. Therefore, this area stands out as the main defense line for the medium-term upward trend to remain intact.
The Relative Strength Index (RSI) is at 52 levels, indicating that buyers still hold the advantage in the positive zone, but we can see that this momentum has weakened with the recent pullbacks. For the upward trend to gain strength, it is critical for the RSI to rise back above the 60 band. A decline in RSI could pull the price down to the 22 dollar band and then to our main defense line at the 21 dollar band.
Support levels: 23.26 – 22.56 – 21.37
Resistance levels: 24.55 – 26.28 – 29.22
ADA/USDT
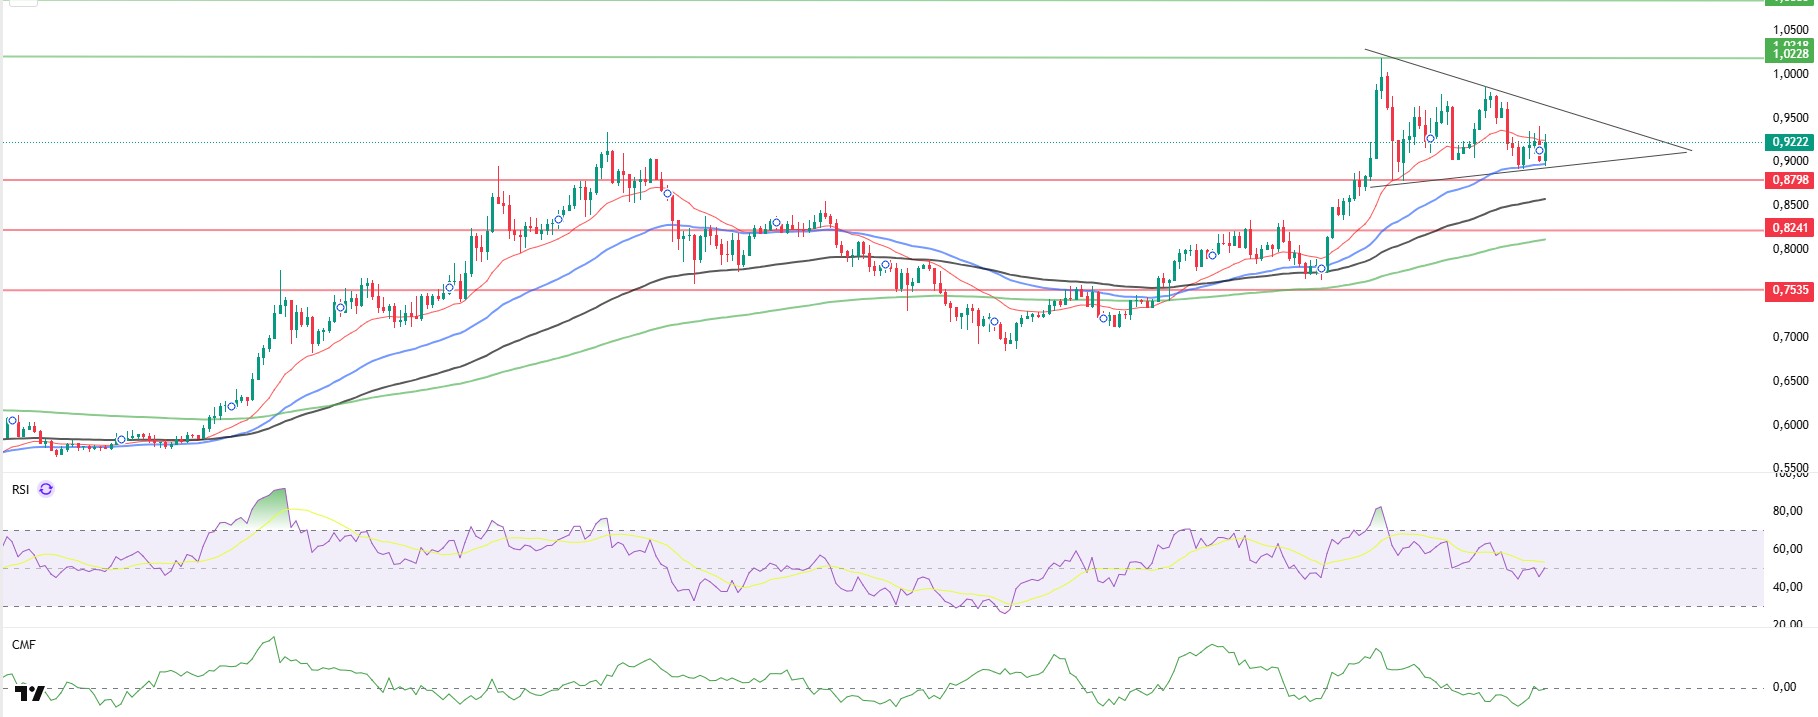
ADA continues its horizontal movement within the symmetrical triangle formation during the day. Last week, it tested the resistance level of 1.0178 and managed to stay above the 0.9017 level. The price is currently trading at 0.9233. If it breaks above the upper band of the horizontal channel on the 4-hour chart, it could test the 1.0237 level. The EMA 20 (red line) is currently below the price, indicating that the downward trend potential remains intact.
The price remains above the 50 and 100-day Exponential Moving Average (EMA-Blue Line) and (EMA-Black Line) on the 4-hour chart, indicating that buyers are gaining strength. However, the Relative Strength Index (RSI-14) has dropped to 48 levels, continuing its downward trend near the sell zone, while the Chaikin Money Flow (CMF-20) has fallen to -0.10 levels, indicating a potential downtrend signal. The decline in capital inflows could keep the CMF in the horizontal zone and exert a bearish influence. In the event of positive macroeconomic data or news related to the Cardano ecosystem, the 1.0255 dollar level could emerge as a strong resistance point. In the event of a decline, the 0.8379 level will be the key support level to monitor.
Support levels: 0.8444 – 0.8379 – 0.7378
Resistances: 1.0255 – 1.0237 – 0.9447
Legal Notice
The investment information, comments, and recommendations contained herein do not constitute investment advice. Investment advisory services are provided individually by authorized institutions taking into account the risk and return preferences of individuals. The comments and recommendations contained herein are of a general nature. These recommendations may not be suitable for your financial situation and risk and return preferences. Therefore, making an investment decision based solely on the information contained herein may not produce results in line with your expectations.


