
Morning Technical Analysis
BTC/USDT
As volatility increased in US financial markets, the credit shock experienced by regional banks drew attention. Following Zions Bank and Western Alliance Bank’s announcements of bad loans, the index fell 6.2%. Bankruptcies in the automotive sector deepened the perception of risk in the financial sector. On the Fed front, Board Member Christopher Waller stated that he found a cautious 25 basis point rate cut appropriate, while the committee leaned toward gradual easing rather than aggressive steps. On the trade agenda, China announced it was open to dialogue with the US and stated that licensing processes for rare earth exports would be optimized. Data flow continues to be delayed due to the government shutdown, while the Philadelphia Fed Index fell short of expectations at -12.8. On the geopolitical front, Trump and Putin’s agreement in Budapest to hold peace talks opened the door to a new diplomatic process in the Ukraine crisis. However, US Vice President Vance said the parties were not yet ready to reach an agreement.
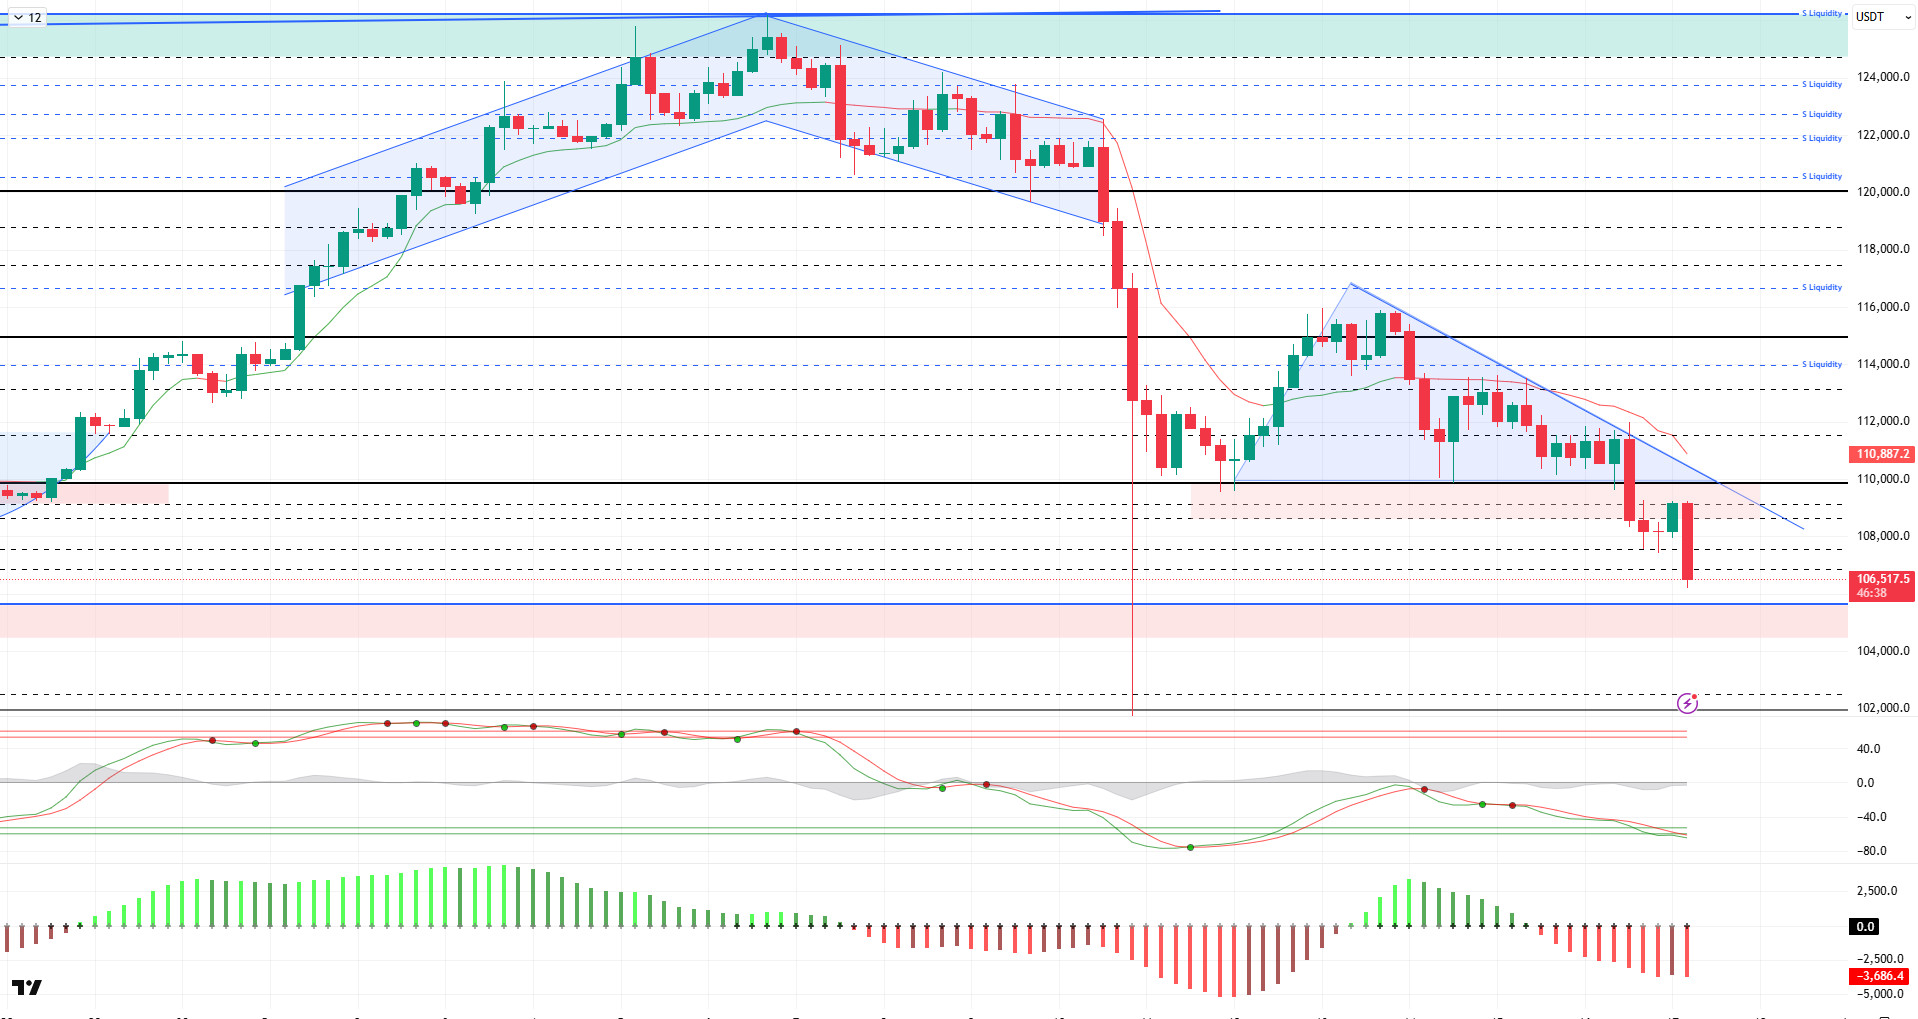
From a technical perspective, the price, which tested the 111,500 level in the previous analysis, failed to break through and reversed direction, invalidating the formations seen in the price. BTC, which broke through the 110,000 level, which we were tracking as a critical support point, on the eighth attempt with high volume, fell back to the 107,500 level. The price then recovered but faced renewed selling pressure at the 109,000 level and retreated to the 106,300 level. At the time of writing, the analysis continues to see high volatility and selling pressure.
Technical indicators show that the Wave Trend (WT) oscillator has retracted its short-term buy signal near the oversold zone and has reached the oversold zone. In the Squeeze Momentum (SM) indicator, the histogram’s attempt to gain strength within the negative zone failed. The Kaufman Moving Average (KAMA) is currently at the $110,900 level, positioned above the price.
According to liquidation data, the short-term buy level shows very rare accumulation on a daily, weekly, and monthly basis, while the six-month level shows intensity at 93,000. In contrast, the selling level is concentrated in the 113,700–113,900 range in the short term, while the concentration continues above the 120,000 level in the long term. Looking at the last 24 hours’ data, $233 million in long positions and $70 million in short positions were liquidated, with the total market ratio recorded at $925 million.
In summary, on the fundamental side, the renewed tariff tensions between the US and China, coupled with the ongoing US government shutdown, weighed on prices. On the other hand, Powell’s openness to interest rate cuts in the coming period in response to labor market deterioration stood out as an optimistic development. BTC, which started the October cycle well and reached a 10% ROI, gave back all its gains and is currently down 4.22%. Technically, BTC reached saturation point by testing its all-time high (ATH) at $126,198. After this level, liquidity data became the main factor triggering the price correction. After a sharp sell-off, BTC recovered somewhat but failed to maintain stability above the $115,000 level and faced renewed selling pressure, falling back to the $110,000 level. Losing the 110,000 level, which we were tracking as a critical reference point, the price fell back to the 106,000 level. In the coming period, holding above the 105,000 level will be of great importance. In the event of a correction to the decline, we will monitor the 107,400 and then the 108,500 levels during the day.
Supports: 106,600 – 105,000 – 103,000
Resistances: 107,400 – 108,500 – 110,000
ETH/USDT
After losing its support at $3,990 yesterday evening, the XRP price retreated to the $3,816 level, as predicted in the analysis. Although short-term rebound buying was seen at this level, the strong selling pressure indicates that the price is moving on weak ground. The weakening of the overall market structure reveals that buyers are losing strength and short-term recoveries may be limited.
The Chaikin Money Flow (CMF) indicator moving into negative territory clearly shows that liquidity outflows from the market are continuing. This weakening of capital flows reduces the sustainability of upward moves and causes the price to maintain its current downward trend. The CMF remaining in this region indicates that sufficient capital inflows have not yet materialized for the market to gain new upward momentum.
The Relative Strength Index (RSI) maintaining its previous level reveals that momentum loss is continuing and buyers have not yet recovered. The RSI remaining below the 50 level confirms that market strength is still on the side of sellers. This structure indicates that recovery efforts may remain weak in the short term.
The price dipping below the Kumo cloud in the Ichimoku indicator confirms that the market has technically entered a downtrend. Furthermore, the Tenkan level cutting below the Kijun level supports the notion that short-term weakness is becoming apparent and that sellers are in control. This structure indicates that the price needs a strong recovery signal to generate upward momentum again.
If the price breaches the $3,816 level downward during the day, alongside the weakness in technical indicators, the possibility of a pullback to the $3,672 support level may increase. Sustained trading below this level at could deepen the selling pressure. However, regaining the $3,990 level could pave the way for buyers to re-enter the market in the short term and for a positive trend to re-establish itself. In such a scenario, the price would be more likely to rebound towards the $4,100 and $4,196 resistance zones.
Top of Form
Below the Form
Supports: 3,816 – 3,672 – 3,400
Resistances: 3,990 – 4,196 – 4,308
XRP/USDT
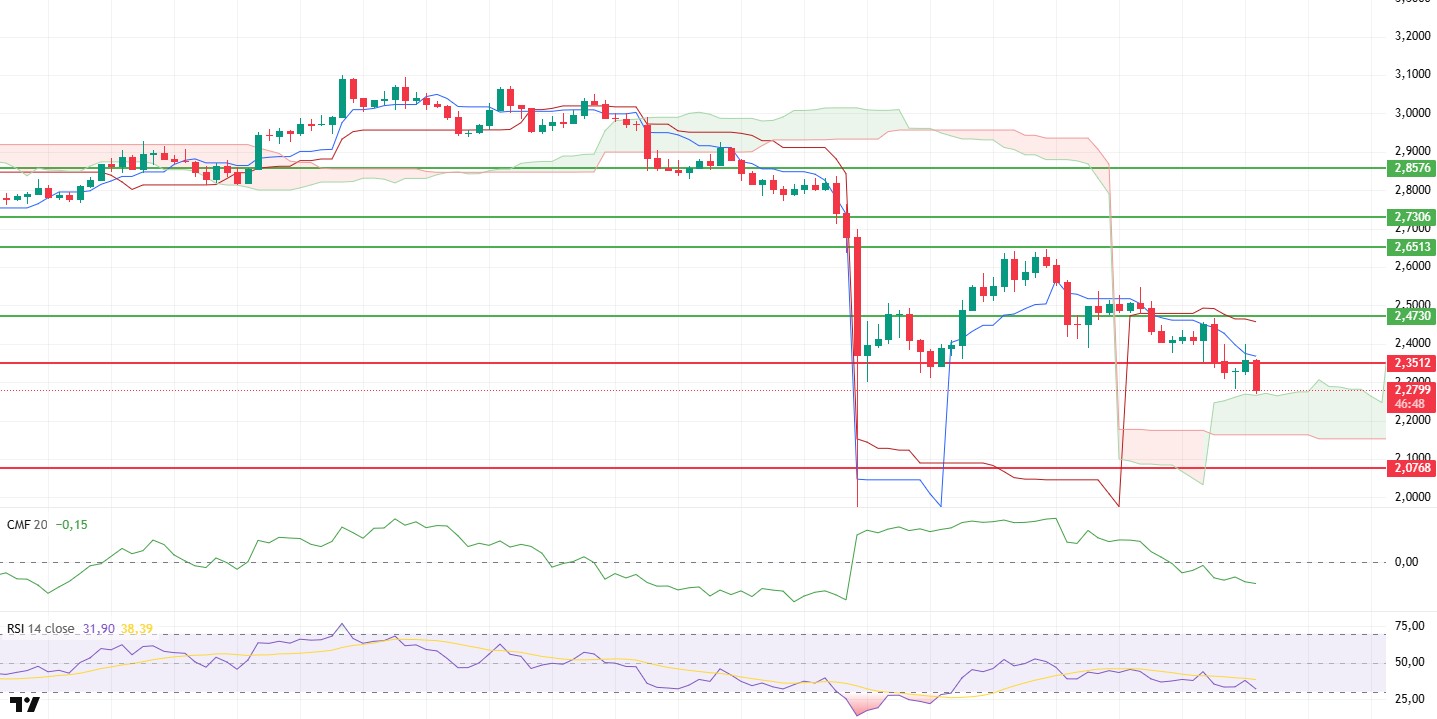
After losing the $2.35 support level, the XRP price continued its decline amid increased selling pressure and fell to the $2.28 level. Continued weak buying interest in the market indicates that short-term rebound attempts remain limited. The price’s attempt to hold in this region revea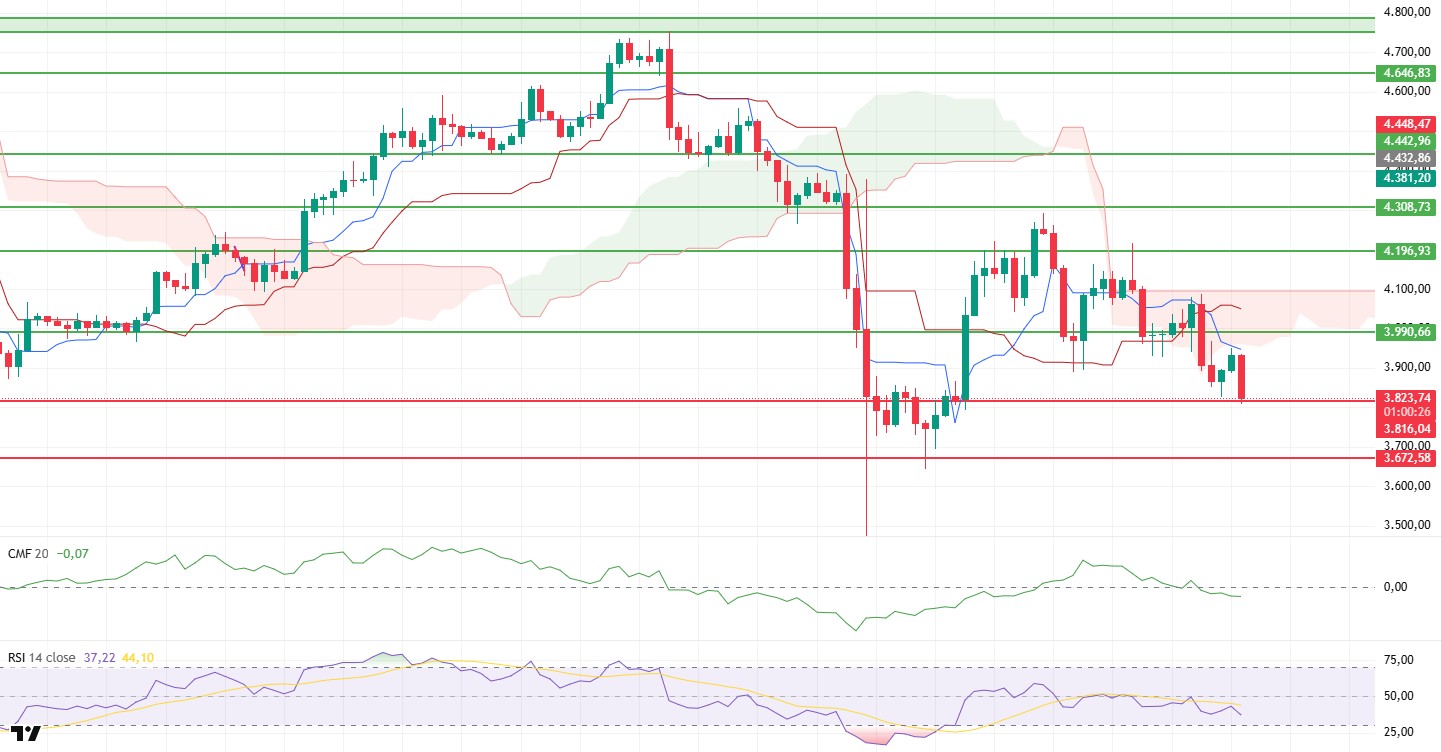 ls that the search for temporary equilibrium continues at a point where selling has become excessive.
The Chaikin Money Flow (CMF) indicator continues to decline in negative territory, indicating that heavy liquidity outflows from the market persist. This decrease in capital flow confirms that upward movements are struggling to gain traction and that selling pressure remains dominant. The current trajectory of the CMF indicates that the market needs a strong inflow of liquidity to generate new buying momentum.
The Relative Strength Index (RSI) indicator hovering near the oversold zone reveals that the weakness in momentum is deepening and buyers have not yet stepped in. The RSI remaining in this zone strengthens the possibility of the price moving sideways or downward in the short term.
Looking at the Ichimoku indicator, the price has retreated to the upper band of the kumo cloud. Considering the weaknesses in the indicators, if the price falls below this level, selling pressure is likely to accelerate, leading to a sharp pullback to the $2.07 region. On the other hand, regaining the $2.35 level could weaken the negative outlook in the short term and allow the market to enter a recovery process.
In the overall outlook, the $2.28 level stands out as a short-term intermediate support. Failure to hold this level could deepen the selling wave. However, if the price breaks above the $2.35 level and maintains its position above it, this could pave the way for market equilibrium to shift back in favor of buyers and initiate a recovery movement towards the $2.47 region.
Supports: 2.2100 – 2.0768 – 2.0000
Resistances: 2.3512 – 2.4730 – 2.6513
SOL/USDT
DeFi Development Corp. purchased 86,307 SOL in its latest treasury purchase. A16z Crypto invested $50 million in Solana’s Jito through a private token sale.
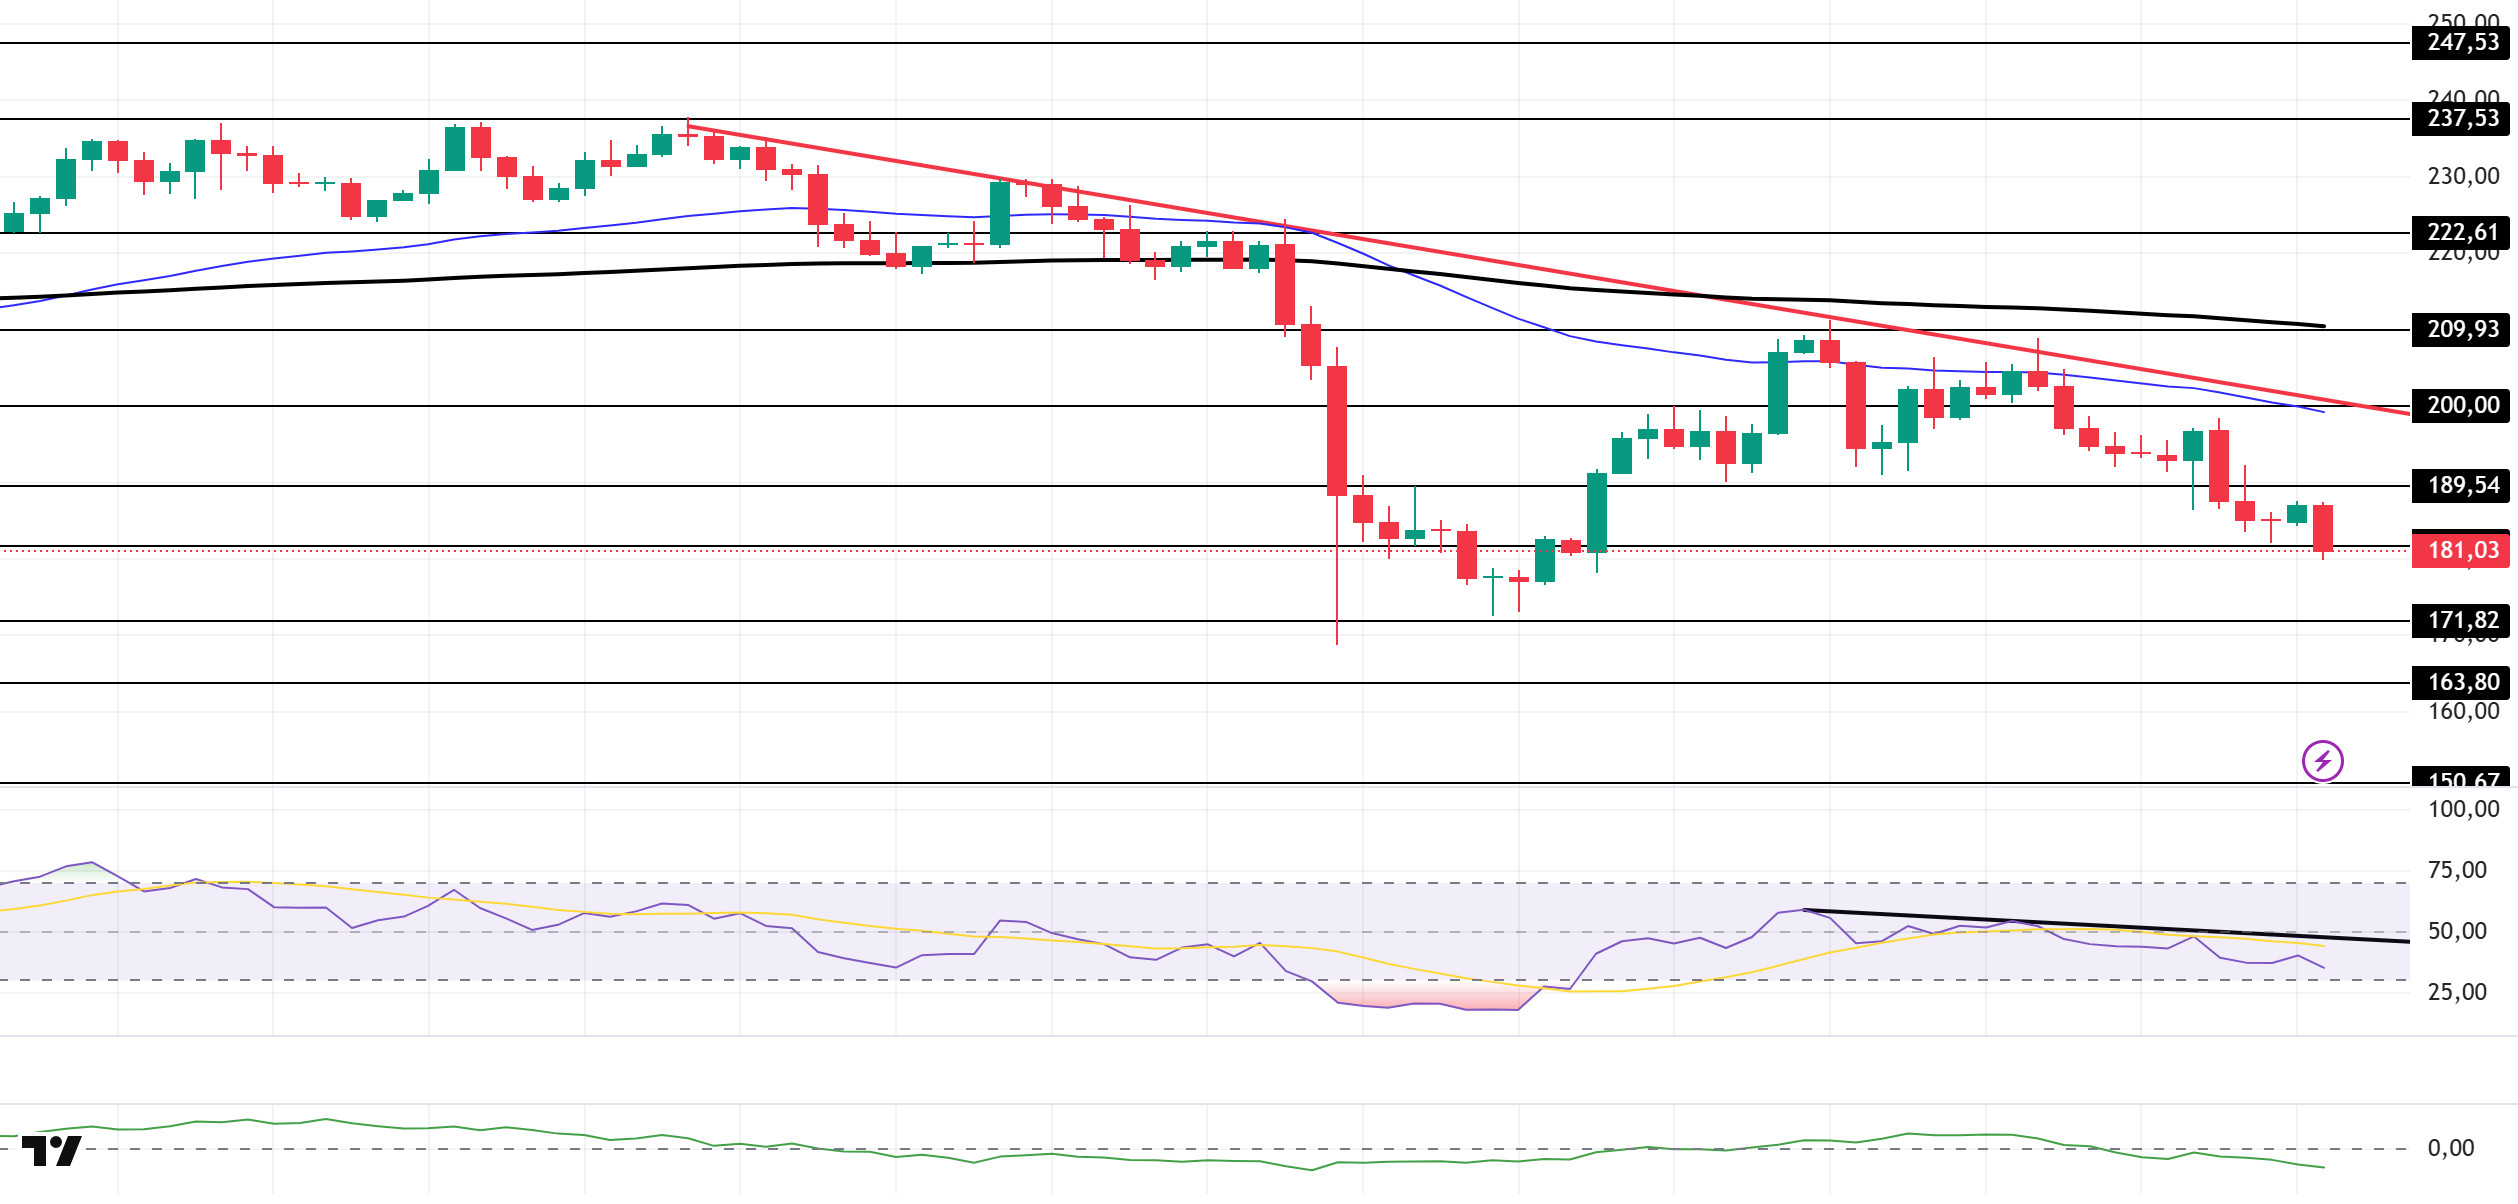
The SOL price continues to decline. The asset remains in the lower region of the downtrend that began on October 6. Testing the $189.54 level as support, the price broke through this level and showed a slight increase, supported by the strong support level of $181.75. If the upward trend continues, it could test the 50 EMA (Blue Line) and the downward trend as resistance. In the event of a pullback, the $171.82 level could be triggered once again.
The price remained below the 50 EMA (Exponential Moving Average – Blue Line) and 200 EMA (Black Line) on the 4-hour chart. This indicates a possible downtrend in the medium term. At the same time, the price being below both moving averages shows us that the asset is in a downtrend in the short term. The Chaikin Money Flow (CMF-20) remained in negative territory. However, an increase in cash inflows could push the CMF into positive territory. The Relative Strength Index (RSI-14) remained below the downward trend that began on October 13 and continued to hover around the midpoint of the negative zone. This signaled that selling pressure persisted. In the event of an uptrend driven by macroeconomic data or positive news related to the Solana ecosystem, the $200.00 level stands out as a strong resistance point. If this level is broken upwards, the uptrend is expected to continue. Conversely, if developments or profit-taking due t s lead to pullbacks, the $171.82 level could be tested. A decline to these support levels could increase buying momentum, presenting a potential opportunity for an upward move.
Supports: 181.75 – 171.82 – 163.80
Resistances: 189.54 – 200.00 – 209.93
DOGE/USDT
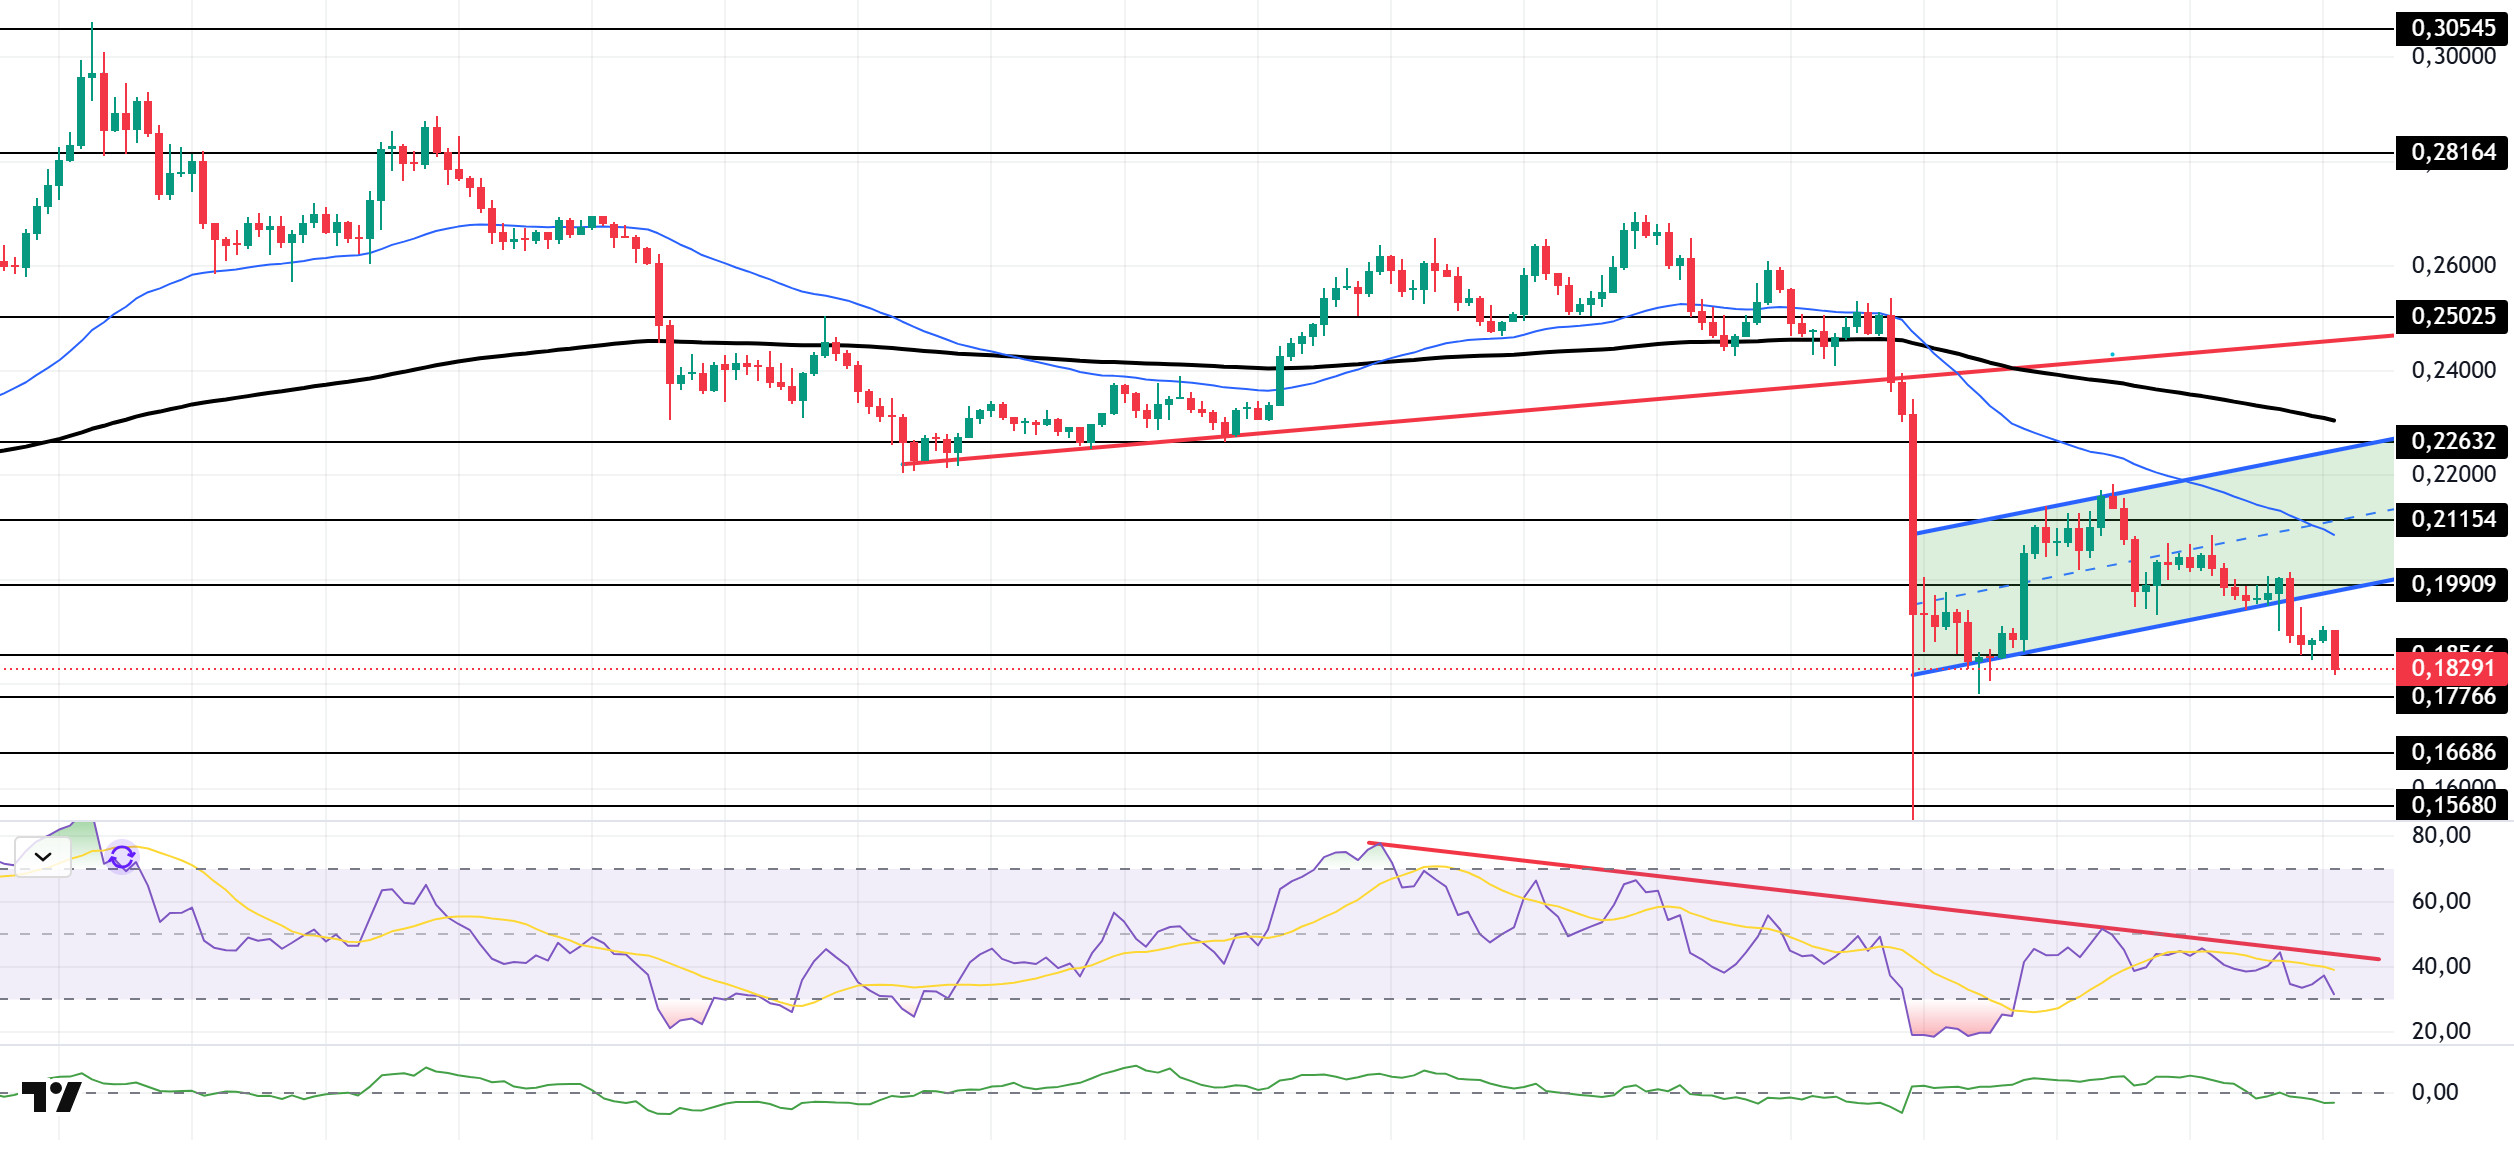
The DOGE price continued to decline. The asset remains in the lower region of the upward trend that began on September 25. Testing the strong support level at the base of the upward trend, the price broke below it with a strong bearish candle, deepening its decline. Currently, the asset, supported by the strong support level of $0.18566, began to move sideways with a slight uptick. If candlestick closes below the rising trend continue, the pullback may deepen. If the uptrend begins, the 50 EMA (Blue Line) moving average should be monitored.
On the 4-hour chart, the 50 EMA (Exponential Moving Average – Blue Line) remained below the 200 EMA (Black Line). This indicates that a medium-term downtrend may begin. The price being below both moving averages indicates a downward trend in the short term. The Chaikin Money Flow (CMF-20) has also fallen into negative territory. Additionally, an increase in money inflows could push the CMF into positive territory. The Relative Strength Index (RSI-14) continues to remain below the downward trend that began on October 2. The metric, which remains in the middle of the negative zone, indicates that selling pressure continues. In the event of a rise due to political developments, macroeconomic data, or positive news flow in the DOGE ecosystem, the $0.19909 level stands out as a strong resistance zone. Conversely, in the event of negative news flow, the $0.17766 level could be triggered. A decline to these levels could increase momentum and potentially initiate a new upward wave.
Supports 0.18566 – 0.17766 – 0.16686
Resistances 0.19909 – 0.21154 – 0.22632
LTC/USDT
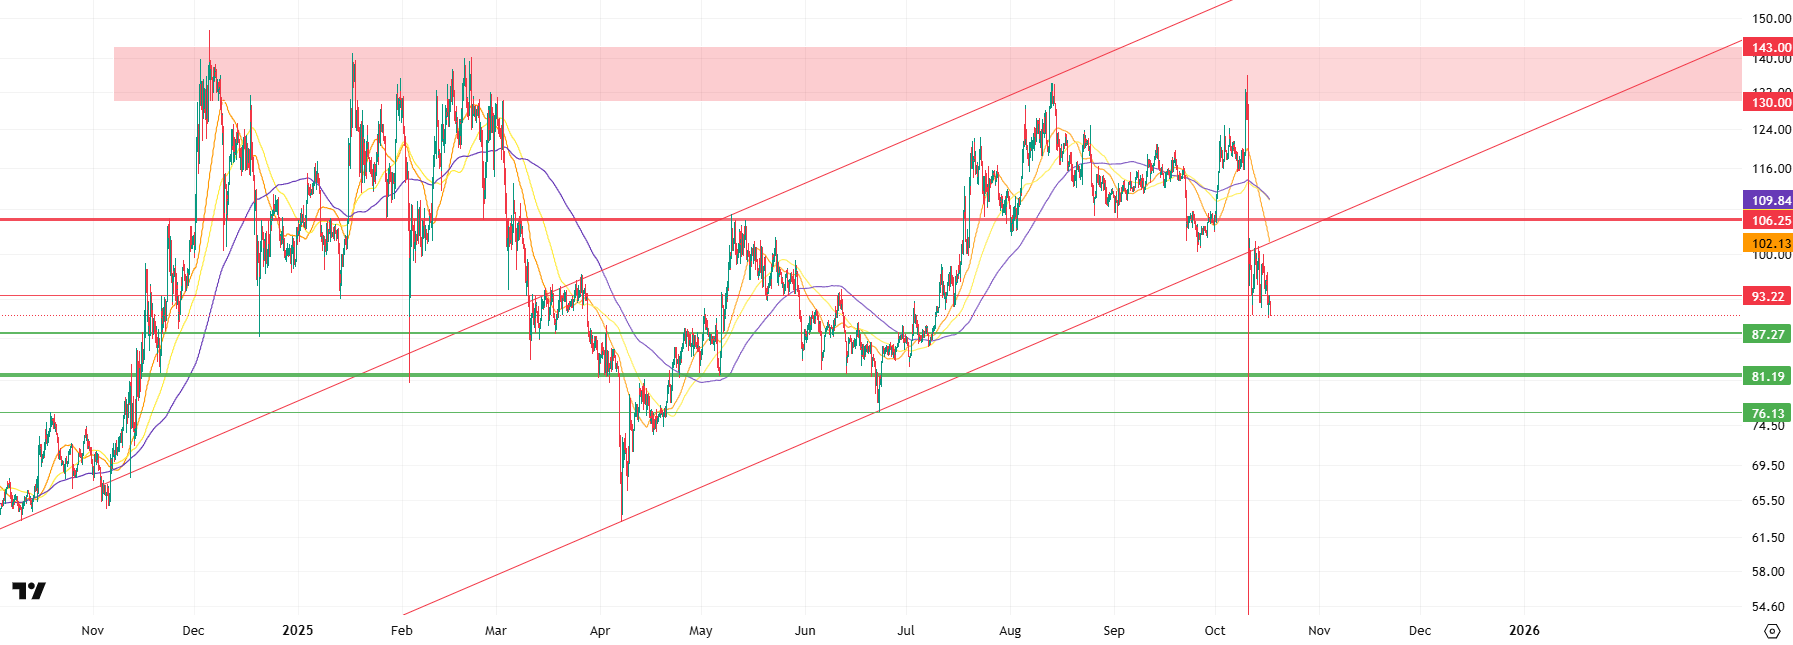
Price movements observed in the Litecoin (LTC) / USDT pair closed the previous day with a 3.88% loss in value. At the same time, LTC’s 1.62% decline compared to Bitcoin shows that Litecoin’s own sales and the pullback on Bitcoin have caused prices to fall together. On the futures side, the long/short position ratio opened in the last 24 hours being at 0.9161 indicates that derivatives market participants expect the decline to continue. This ratio indicates that more than half of the positions in futures over the last 24 hours were sell-oriented and that the market trend on Litecoin continues to favour bears. In addition, funding rates are positioned in the negative-neutral zone.
Technically, examining Litecoin’s 4-hour USDT pair chart, pricing continuing below all moving averages and the rising trend continues to support expectations of a decline, driven by the predominantly increasing short positions in the derivatives market. However, upward movements remain a possibility, as always. If this possibility materializes, the first point where the upward movement could be suppressed is the 93.22 level, which is currently the former support and now the new horizontal resistance. Following this, the rising trend‘s lower band at 102.13 comes into view. This level also increases the potential for a crossover with the 50-period moving average. Finally, the 106.25 level continues to be an important level that will create horizontal selling pressure.
In line with expectations, the 87.27 level stands out as a critical zone where the price could find support in the first stage and where risk-averse traders could close their short positions. If the price remains below this level, the 81.19 level attracts attention as a strong and critical support point. However, losing the 81.19 level could signal the end of the medium-term bullish trend. In this case, investors, perceiving a strengthening bearish trend in the market, may be inclined to take more short positions, with short-term traders targeting the horizontal support at 76.13.
Supports: 87.27 – 81.19 – 76.13
Resistances: 93.22 – 102.13 – 106.25
Legal Notice
The investment information, comments, and recommendations contained herein do not constitute investment advice. Investment advisory services are provided individually by authorized institutions taking into account the risk and return preferences of individuals. The comments and recommendations contained herein are of a general nature. These recommendations may not be suitable for your financial situation and risk and return preferences. Therefore, making an investment decision based solely on the information contained herein may not produce results in line with your expectations.

