
Technical Analysis
BTC/USDT
In the US, the core CPI for September rose by 0.2% monthly and 3% annually, falling below expectations. This result signals that inflation is gradually cooling, strengthening the possibility of a Fed interest rate cut. President Trump argued that tariffs are supporting economic growth, stating, “Thanks to tariffs, the stock market is experiencing its strongest period in history.” According to The Verge, the new $300 million ballroom to replace the East Wing of the White House will be funded by donations from technology and crypto companies such as Amazon, Apple, Meta, Google, Ripple, Tether, Coinbase, and the Winklevoss brothers. Bloomberg reports that JPMorgan will begin accepting Bitcoin and Ethereum as collateral for corporate loans by the end of the year.
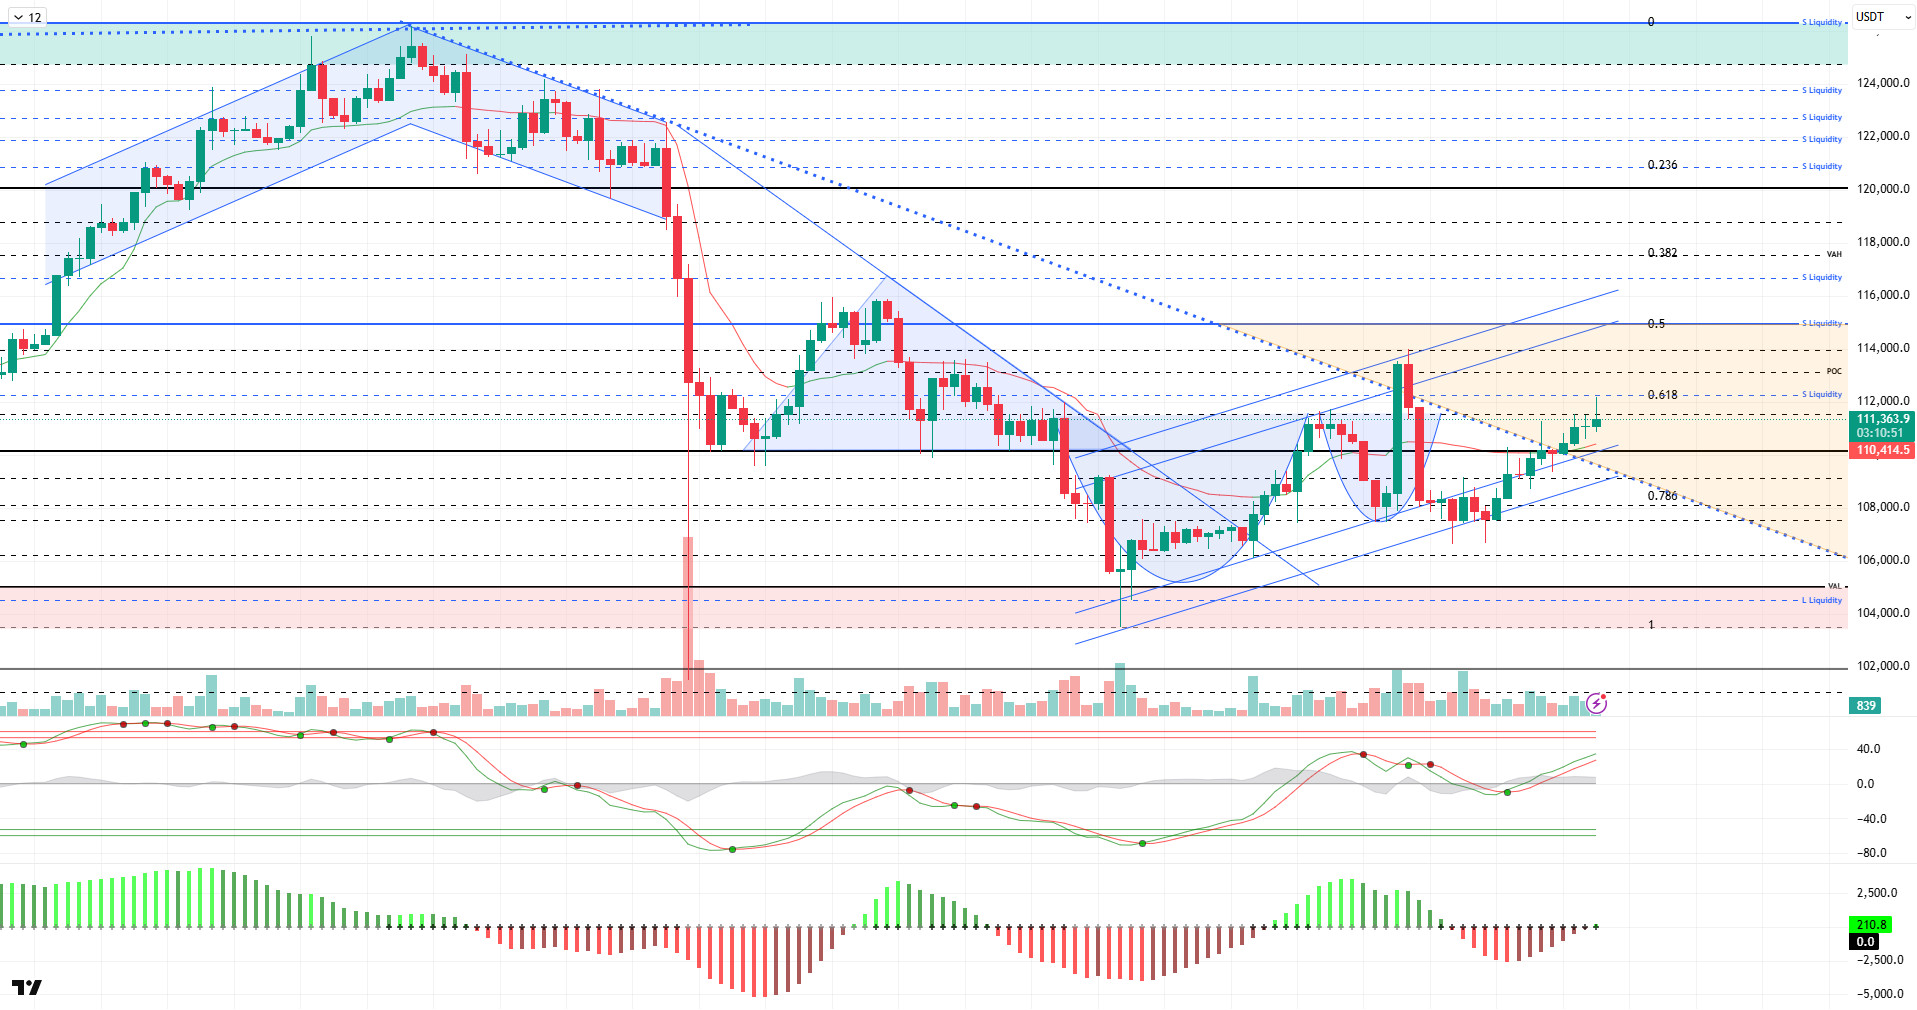
From a technical perspective, BTC, which gained upward momentum in the previous analysis, carried its rise to the 112,000 level despite showing low volatility for the rest of the day. The price, which broke through the downward trend channel, continues to maintain its positive outlook in the orange zone. While the movement towards the POC level is expected to begin with the US session, the critical resistance point at the 115,000 level will be monitored.
Technical indicators show the Wave Trend (WT) oscillator producing a buy signal in the channel’s middle band, signaling a trend reversal parallel to the rise. The Squeeze Momentum (SM) indicator’s histogram is attempting to regain momentum within the negative zone. The Kaufman Moving Average (KAMA) is currently at $110,200, positioned below the price.
According to liquidation data, the short-term buy level has gained intensity in the 108,000 – 109,000 band. In a broader time frame, 106,000 and then 104,300 emerge as areas of intense accumulation. In contrast, the short-term sell level was liquidated at $111,300, while other sell levels are accumulated at $111,700, $112,300, and the increasingly concentrated $115,000 level.
In summary, while developments in the reconciliation process between the US and China were viewed positively by the markets, Trump’s decision to halt trade talks with Canada limited optimism. The lack of concrete progress on reopening the US government remains another source of uncertainty, while efforts to find a solution between Russia and Ukraine, backed by the EU, continue, as do EU sanctions against Russia. On the technical side, BTC has once again surpassed the 110,000 reference level, and liquidity data shows a balanced trading range. In the coming period, the price holding within the minor ascending channel stands out as a critical threshold, and closes above the 110,000 level could make the 115,000 level a target. In the event of potential selling pressure, the 110,000 level remains critical for holding in positive territory.
Supports: 110,000 – 108,500 – 107,400
Resistances: 111,400 – 112,300 – 114,000
ETH/USDT
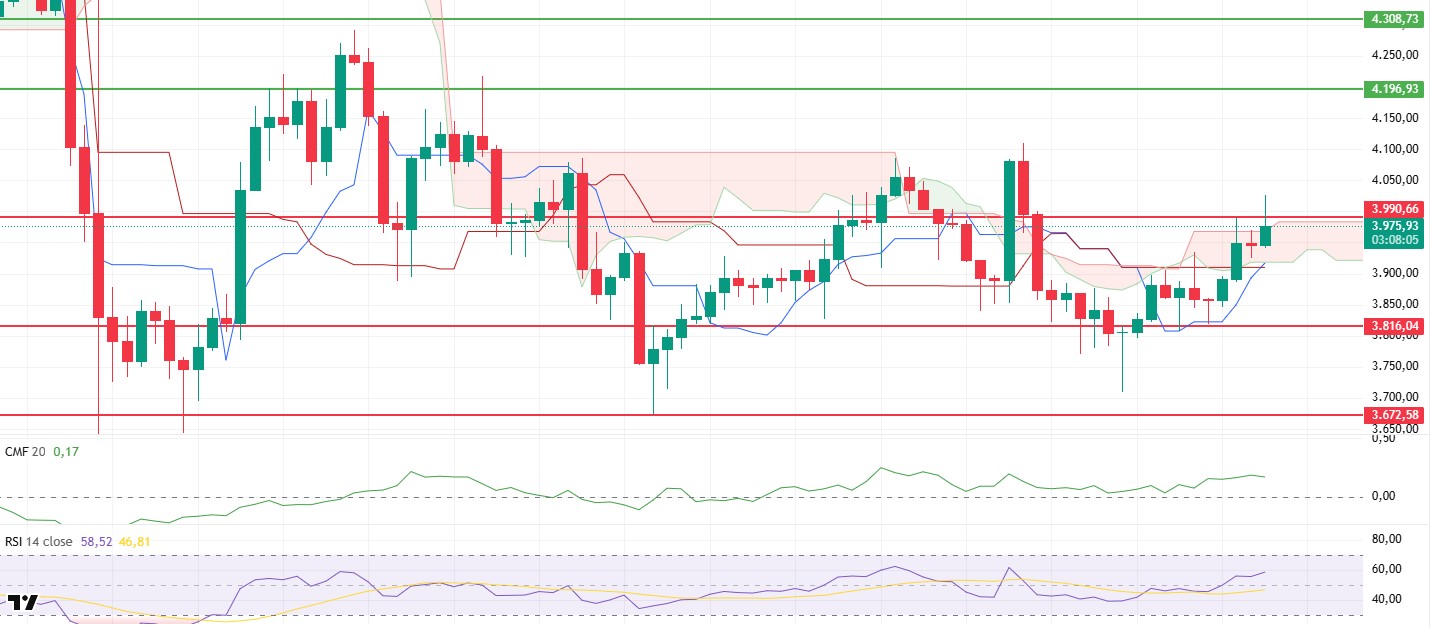
The ETH price experienced a limited pullback during the day, then surged sharply on the back of positive CPI data from the US, reaching $4,026. However, selling pressure in this region caused the price to pull back again, falling to $3,970. This volatile movement during the day highlights that the market is still operating under high volatility and that investors are reacting sensitively to short-term data.
The Chaikin Money Flow (CMF) indicator is showing a slight decline, signaling the start of liquidity outflows. While this weakening indicates that buyers’ dominance in the market has diminished somewhat in the short term, the overall picture still points to efforts to maintain high levels. The CMF regaining positive momentum is critical for the price to find equilibrium in the current support zones.
The Relative Strength Index (RSI) indicator remains in positive territory, confirming that momentum is still strong. The RSI’s persistence above the 50 level indicates that buyers are still active in the market and that the price retains its potential for a short-term recovery.
According to the Ichimoku indicator, the price entered the kumo cloud along with the intraday pullback. This technical outlook signals that the trend is searching for direction and that the market has entered a short-term equilibrium phase. The price re-emerging above the cloud will be an important signal for the continuation of the upward trend.
In the short term, the $3,990 level is once again a critical threshold. If the price manages to stay above this level, the upward movement could gain strength and a new attack towards the $4,196 region could be seen. Otherwise, the possibility of testing the lower band of the cloud at the $3,917 level will increase. The overall outlook indicates that the ETH price is maintaining its positive momentum, but movements in the $3,990 region will be decisive in clarifying the market direction.
Supports: 3,816 – 3,672 – 3,500
Resistances: 3,990 – 4,196 – 4,308
XRP/USDT
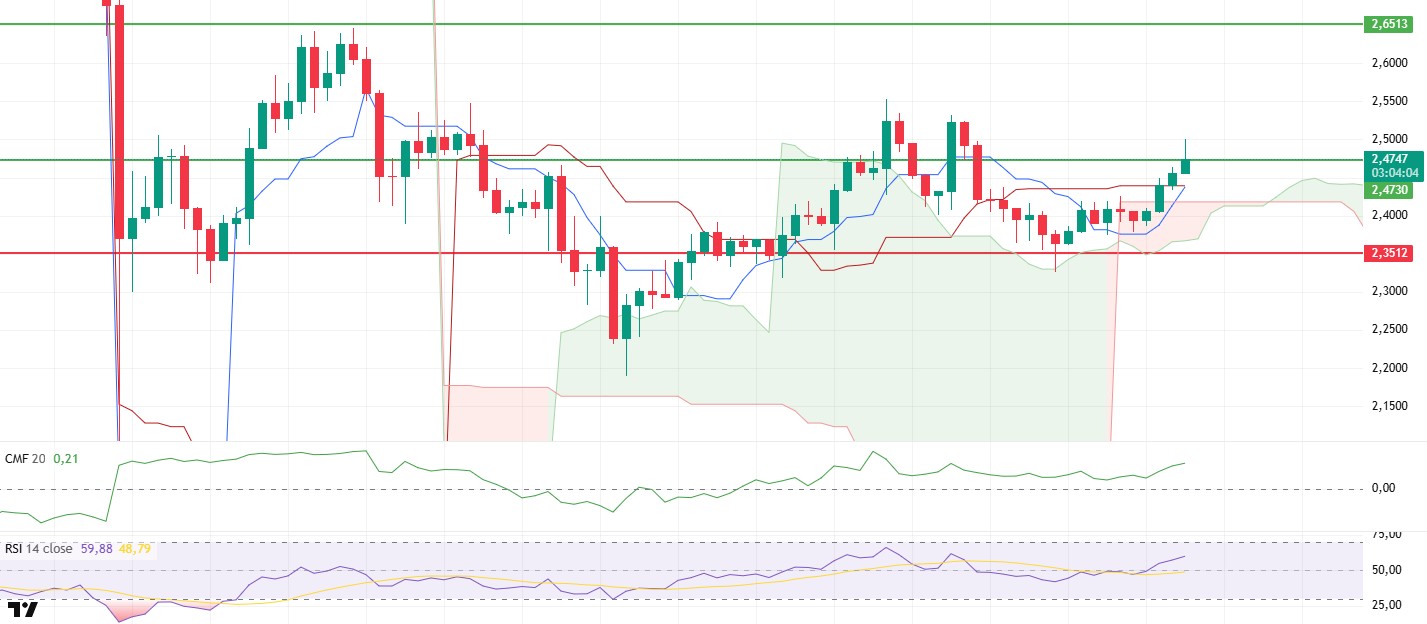
The XRP price initiated an upward movement during the day following the release of U.S. CPI data that fell below expectations, briefly surpassing the $2.47 resistance level. However, as it failed to sustain this level, the price retreated back to the $2.47 region. The price’s attempt to hold at this point indicates that the market is showing signs of indecision and that buyers are entering a new phase of gathering strength to break through the resistance level.
The Chaikin Money Flow (CMF) indicator maintains its positive trend, indicating that capital inflows are continuing. The CMF’s steady performance in this area shows that the market structure is still buyer-oriented and that the price is likely to find support in the current region.
The Relative Strength Index (RSI) indicator also remains in positive territory, sustaining its strong momentum. The RSI’s persistence above the 50 level indicates that buyers are in control and that the upward potential continues in the short term.
According to the Ichimoku indicator, the price is still trading above the kumo cloud. Although the Tenkan line is about to cross the Kijun level upwards, indicating that the trend is gaining strength, there is no clear confirmation yet. The price remaining above the cloud stands out as an important indicator for maintaining the overall upward structure.
The $2.47 level remains critically important during the day. If there is a clear break above this resistance, the uptrend is expected to gain momentum and the price could extend towards the $2.65 region. In the opposite scenario, the $2.35 level will be monitored as a strong support. A drop below this support could weaken the short-term positive structure. The overall outlook indicates that the XRP price is maintaining its positive momentum, but the price reaction at the resistance zone will be decisive in clarifying the direction.
Supports: 2.3512 – 2.2100 – 2.0768
Resistances: 2.4730 – 2.6513 – 2.7306
SOL/USDT
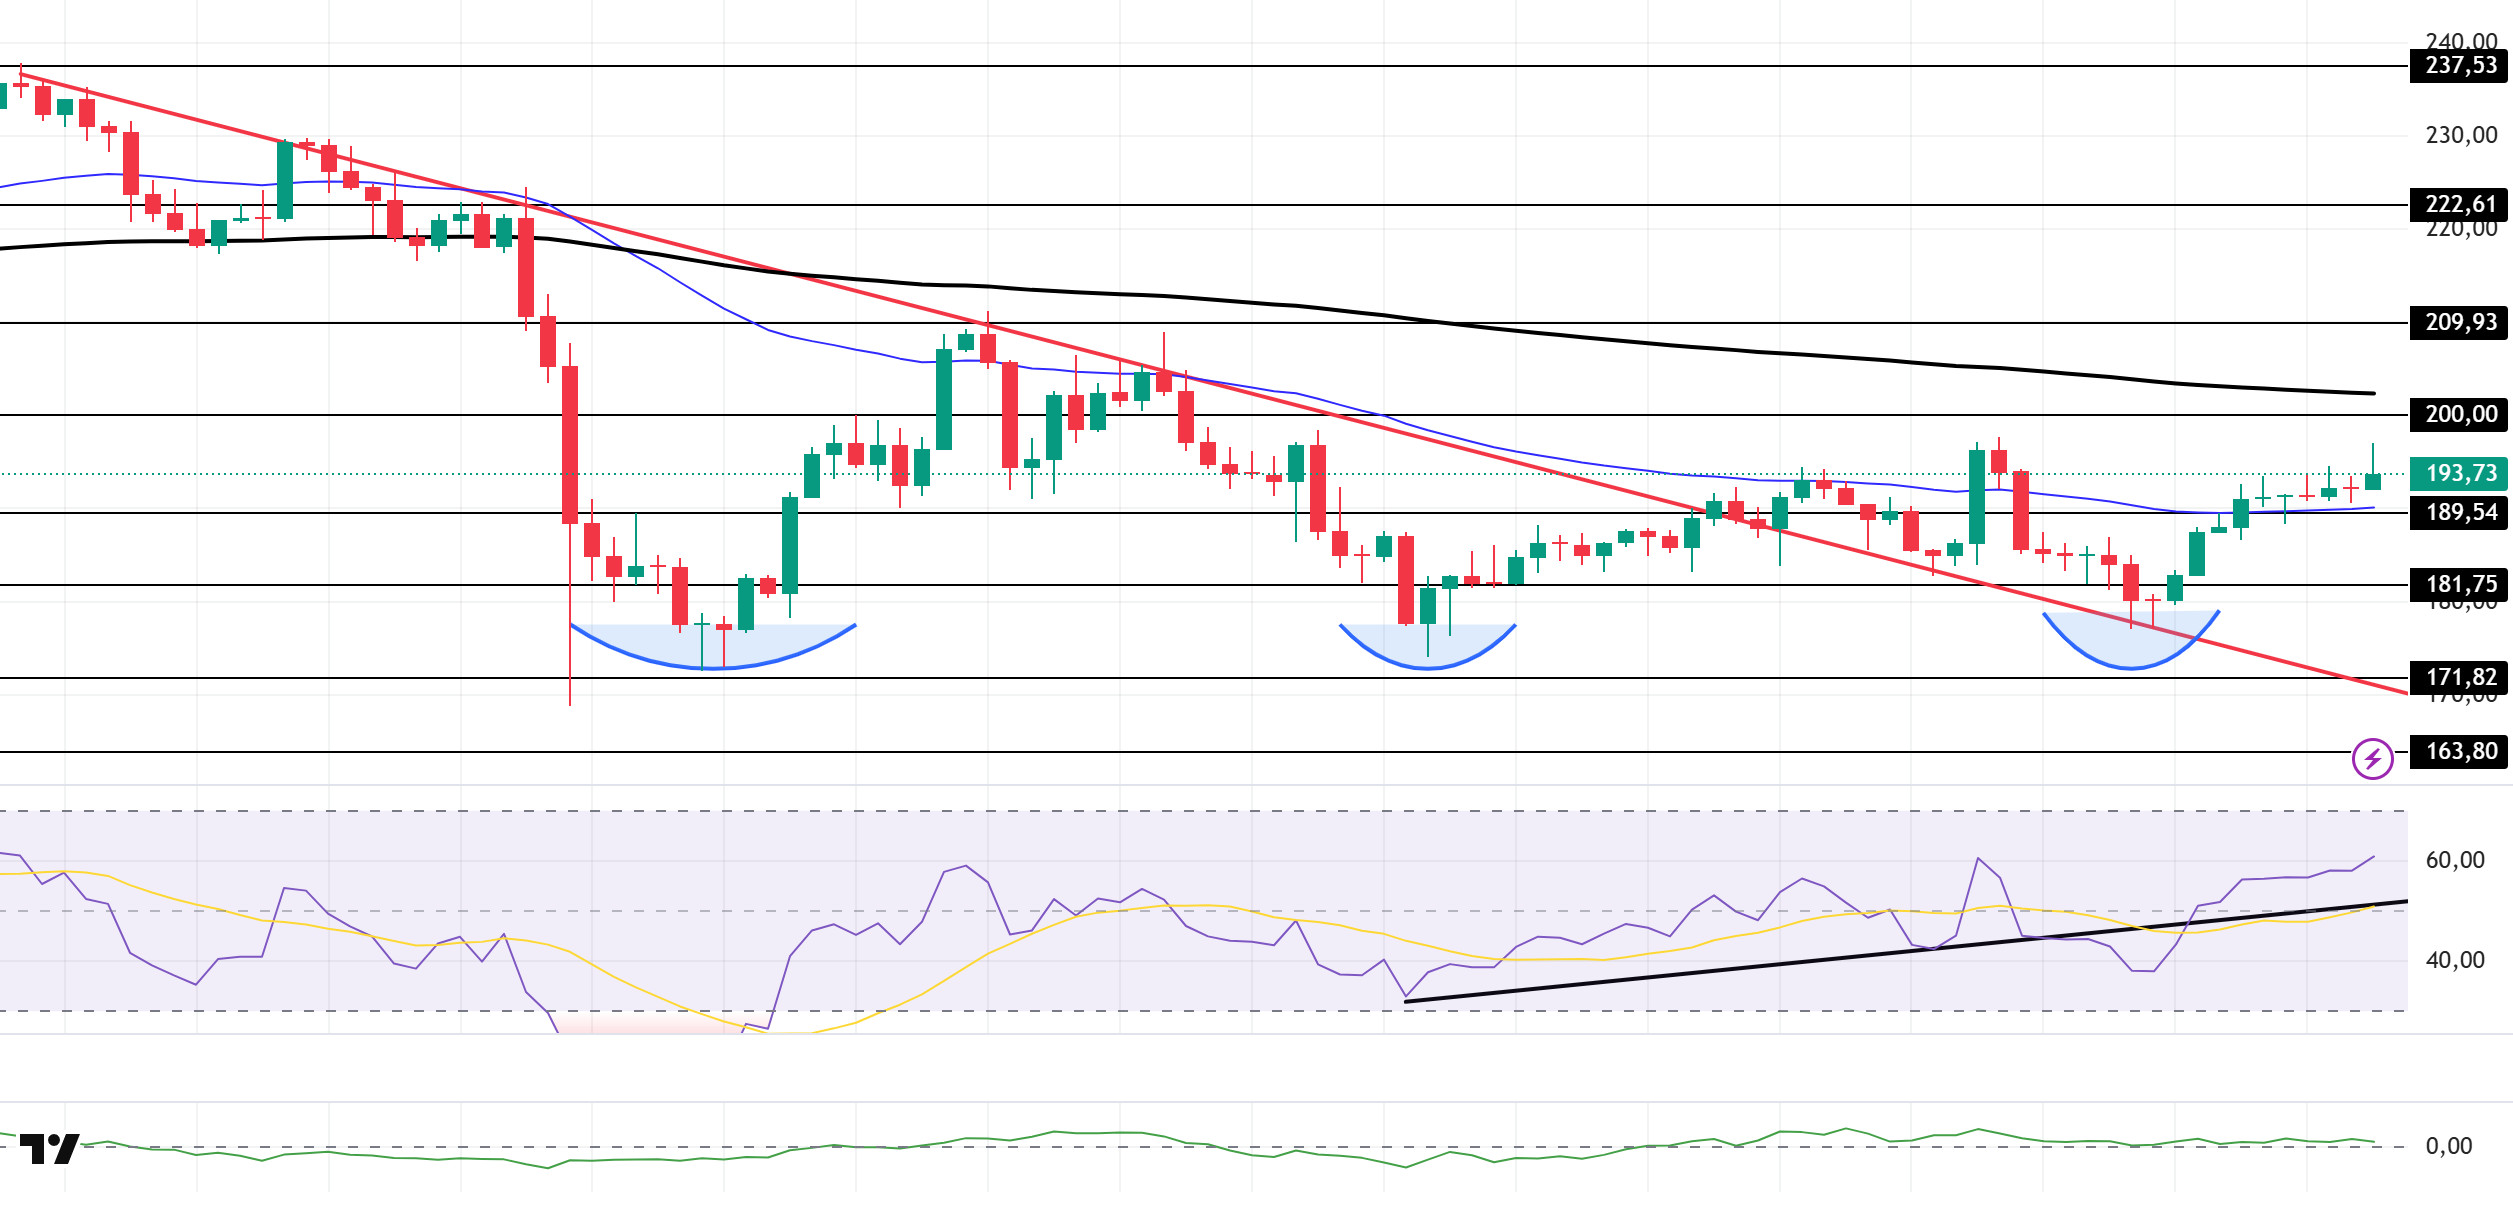
The SOL price traded sideways during the day. The asset tested the support level of the downtrend that began on October 6 and gained momentum from there, rising. Continuing its upward movement, the price tested the 50 EMA (Blue Line) moving average as support and maintained its momentum. At the same time, the triple bottom formation that has formed could strengthen the upward movement. Currently moving sideways, the asset could continue to the 200 EMA (Black Line) moving average if the uptrend continues. If a pullback begins, it could retest the downward trend.
On the 4-hour chart, it remained below the 50 EMA (Exponential Moving Average – Blue Line) and 200 EMA (Black Line). This indicates a possible downtrend in the medium term. At the same time, the price trading between the two moving averages shows us that the asset is in a decision phase in the short term. The Chaikin Money Flow (CMF-20) remained in positive territory. However, a decrease in money inflows could push the CMF into negative territory. The Relative Strength Index (RSI-14) remained in positive territory. It also remained above the downward trend that began on October 17. In the event of an uptrend driven by macroeconomic data or positive news related to the Solana ecosystem, the $200.00 level stands out as a strong resistance point. If this level is broken upwards, the uptrend is expected to continue. In the event of pullbacks due to developments in the opposite direction or profit-taking, the $181.75 level could be tested. A decline to these support levels could increase buying momentum, presenting a potential opportunity for an upward move.
Supports: 189.54 – 181.75 – 171.82
Resistances: 200.00 – 209.93 – 222.61
DOGE/USDT
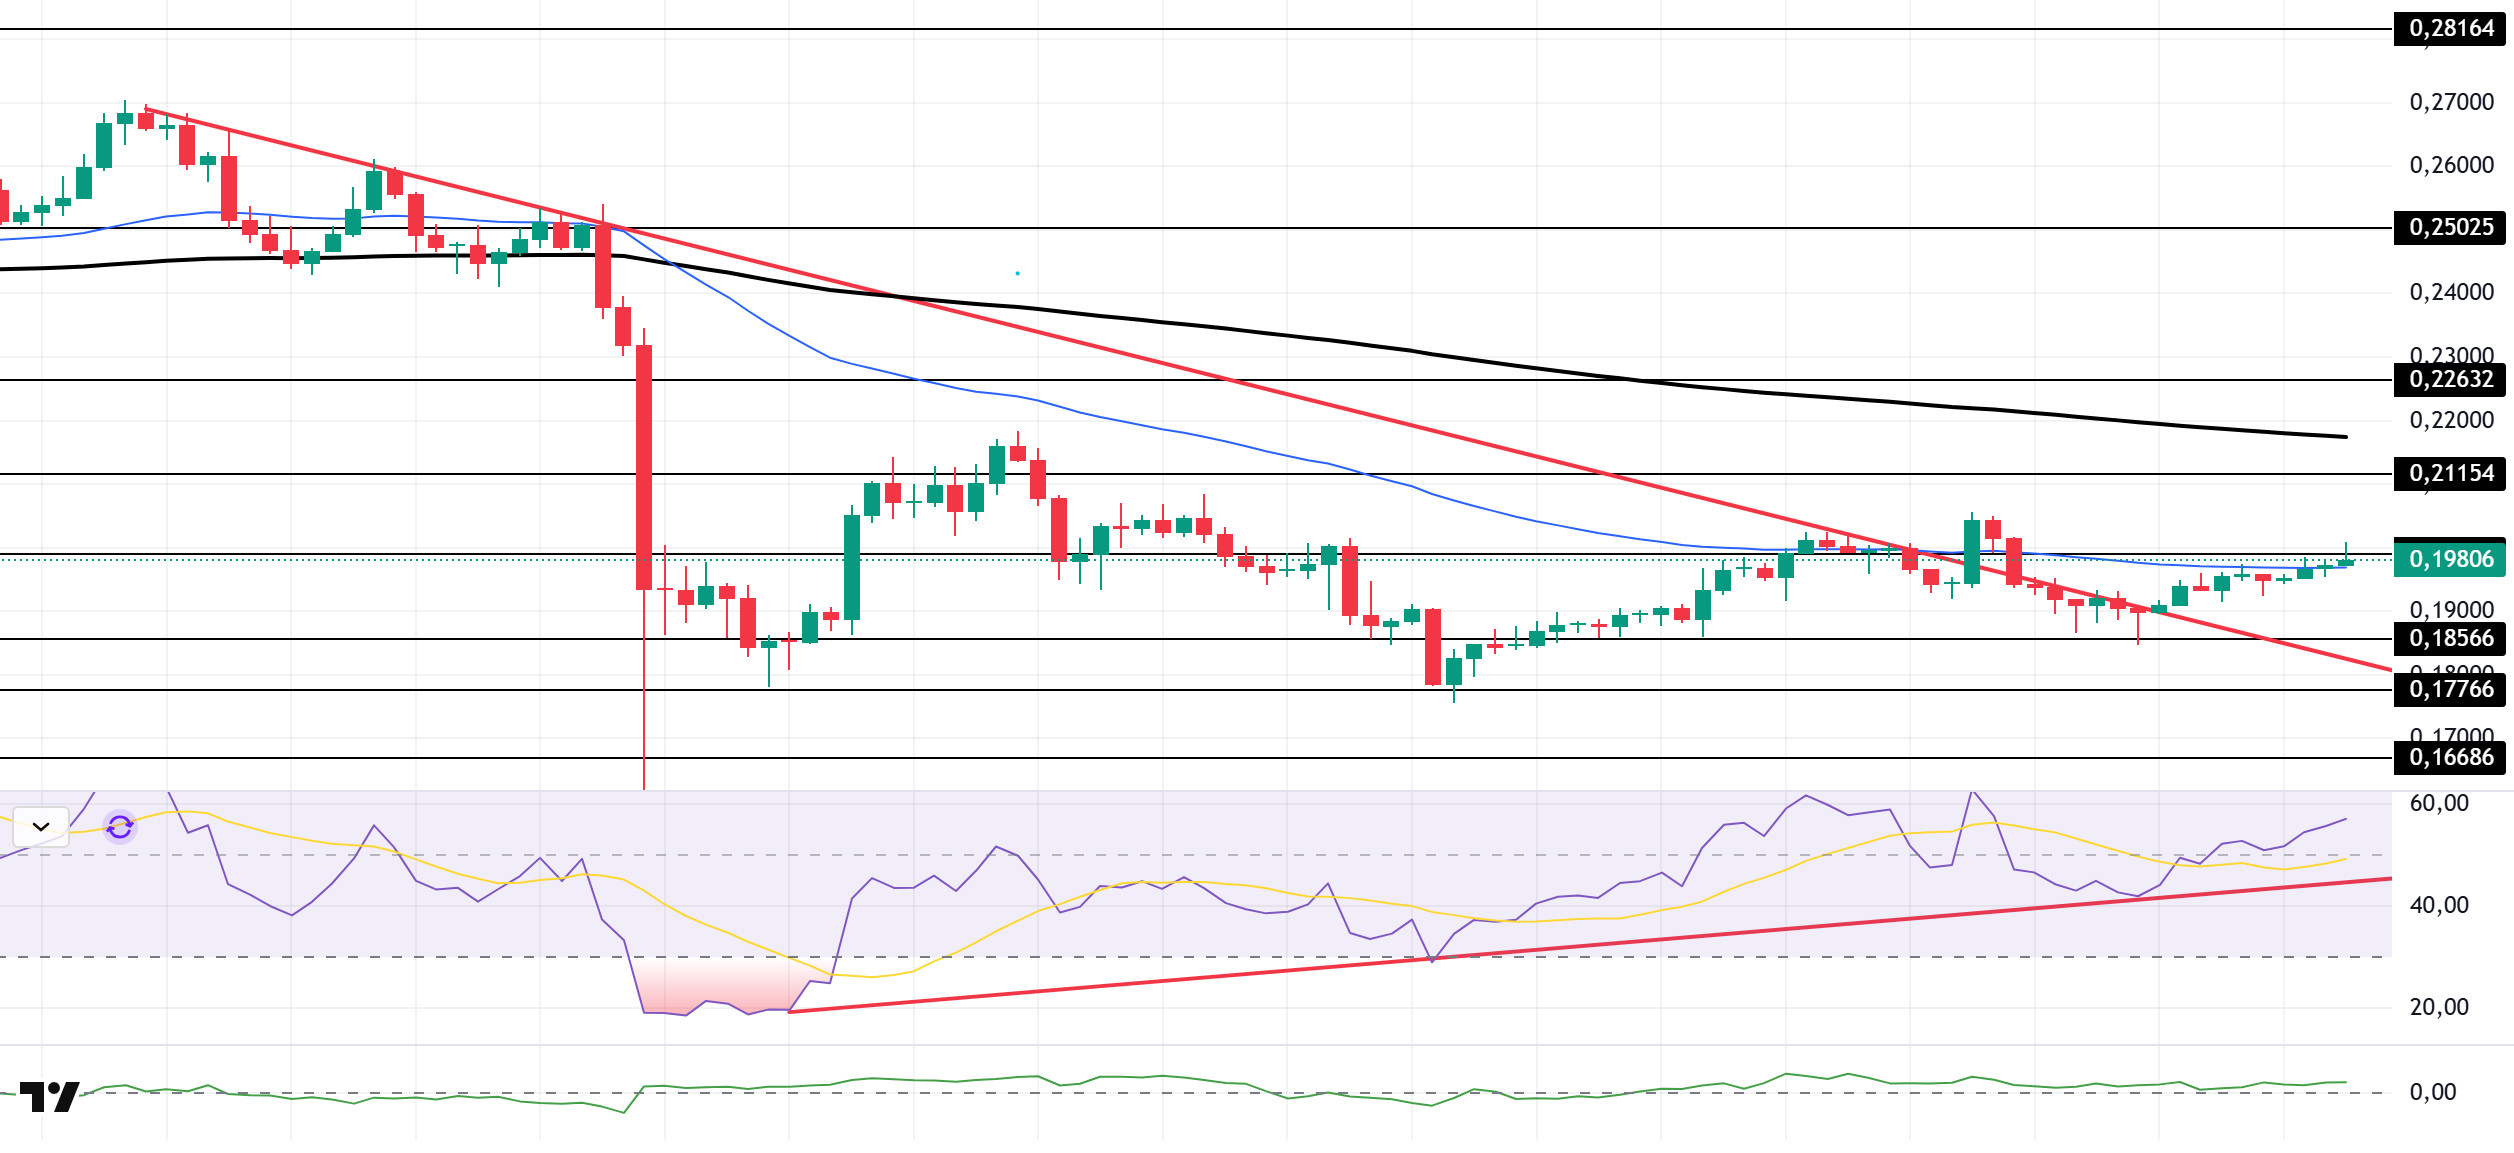
The DOGE price traded sideways during the day. The asset continues to hold on to the upper region of the downtrend that began on October 6. This signaled increased upward pressure. Currently testing the 50 EMA (Blue Line) moving average as resistance, the price could test the 200 EMA (Black Line) moving average if it closes above the 50 EMA. Should a pullback begin, the strong support level at $0.17766 should be monitored.
On the 4-hour chart, the 50 EMA (Exponential Moving Average – Blue Line) remained below the 200 EMA (Black Line). This indicates that a downtrend may begin in the medium term. The price being below both moving averages shows that the price is trending downward in the short term. The Chaikin Money Flow (CMF-20) continues to hold its position at a positive level. Additionally, a decrease in money inflows could push the CMF into negative territory. The Relative Strength Index (RSI-14) continues to remain above the upward trend that began on October 12. It is also in the middle of the positive zone. This indicates that the upward trend may increase. In the event of an increase due to political developments, macroeconomic data, or positive news flow in the DOGE ecosystem, the $0.21154 level stands out as a strong resistance zone. Conversely, in the event of negative news flow, the $0.16686 level could be triggered. A decline to these levels could increase momentum and potentially initiate a new upward wave.
Supports: $0.18566 – $0.17766 – $0.16686
Resistances: 0.19909 – 0.21154 – 0.22632
AVAX/USDT
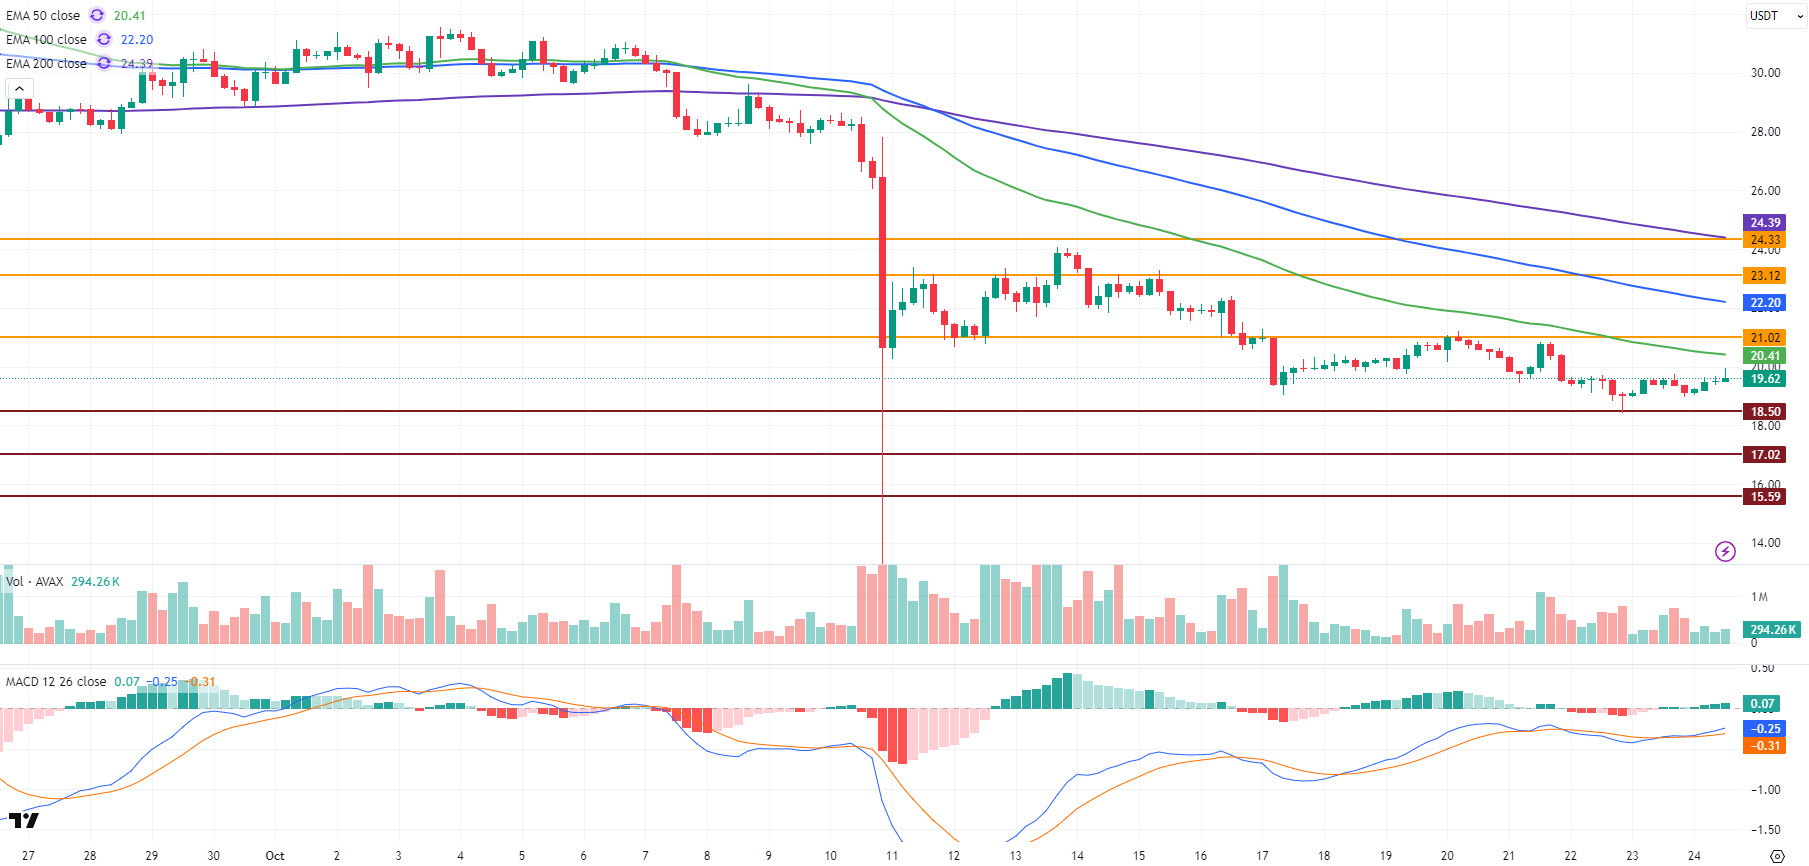
AVAX started the day at $19.14 and gained momentum shortly after the US CPI data release. The data strengthened the possibility of two additional Fed rate cuts later this year. The release of the data triggered a short-term surge across the cryptocurrency market. Following this movement, AVAX rose to $19.96 before retreating to $19.60 amid selling pressure. AVAX, which saw an approximate 2.5% increase in value on a daily basis, continues its sideways movement as it has in recent days.
On the 4-hour chart, the Moving Average Convergence/Divergence (MACD) line continues to trade above the signal line and is trending upward. This outlook indicates that momentum remains in positive territory. However, low-volume market conditions are limiting the upside momentum. AVAX is still priced below critical Exponential Moving Average (EMA) levels. These levels stand out as technically important resistance zones. In particular, breaking above the EMA50 and maintaining that level could support stronger upward momentum in the short term.
From a technical perspective, the EMA50 and $21.02 resistance levels are prominent in AVAX’s rise. If it closes above these levels, AVAX could test the $23.12 and $24.33 levels in its rise. In the medium term, the EMA200 level stands out as the most critical resistance zone in terms of trend reversal. Conversely, in downward movements, the $18.50 level is the first strong support zone. Closing below this level could lead to increased selling pressure, bringing the $17.02 and $15.59 levels into focus for AVAX’s decline. While the MACD maintains a positive signal in the overall outlook, the trend remains weak due to pricing below EMA levels. Despite the short-term positive impact of US data, closes above $21 and an increase in trading volume remain necessary for sustained gains. Otherwise, AVAX is likely to continue its sideways movement in the $18.50–$19.75 range in the short term.
(EMA50: Green Line, EMA100: Blue Line, EMA200: Purple Line)
Supports: 18.50 – 17.02 – 15.59
Resistances: 21.02 – 23.12 – 24.33
Legal Notice
The investment information, comments, and recommendations contained herein do not constitute investment advice. Investment advisory services are provided individually by authorized institutions taking into account the risk and return preferences of individuals. The comments and recommendations contained herein are of a general nature. These recommendations may not be suitable for your financial situation and risk and return preferences. Therefore, making an investment decision based solely on the information contained herein may not produce results in line with your expectations.

