BTC/USDT
Looking at the key developments, institutional investors continue to buy Bitcoin at a rapid pace. The Blockchain Group, based in Europe, purchased an additional 29 BTC, bringing its total holdings to 1,933 BTC. Japan-based Metaplanet, meanwhile, increased its total reserves to 16,352 BTC with its latest purchase of 797 BTC. The Royal Government of Bhutan transferred 650 BTC to central exchanges over the past two weeks. Meanwhile, Strategy President Michael Saylor’s “Tracker” post may signal an upcoming announcement of new Bitcoin purchases. On the global trade front, European Commission President von der Leyen announced that retaliatory tariffs on the US would be suspended until early August. Trump, in his latest letter to the EU, signaled flexibility on tariffs. Today marks the first day of crypto week, with legislative developments in the US being closely monitored.
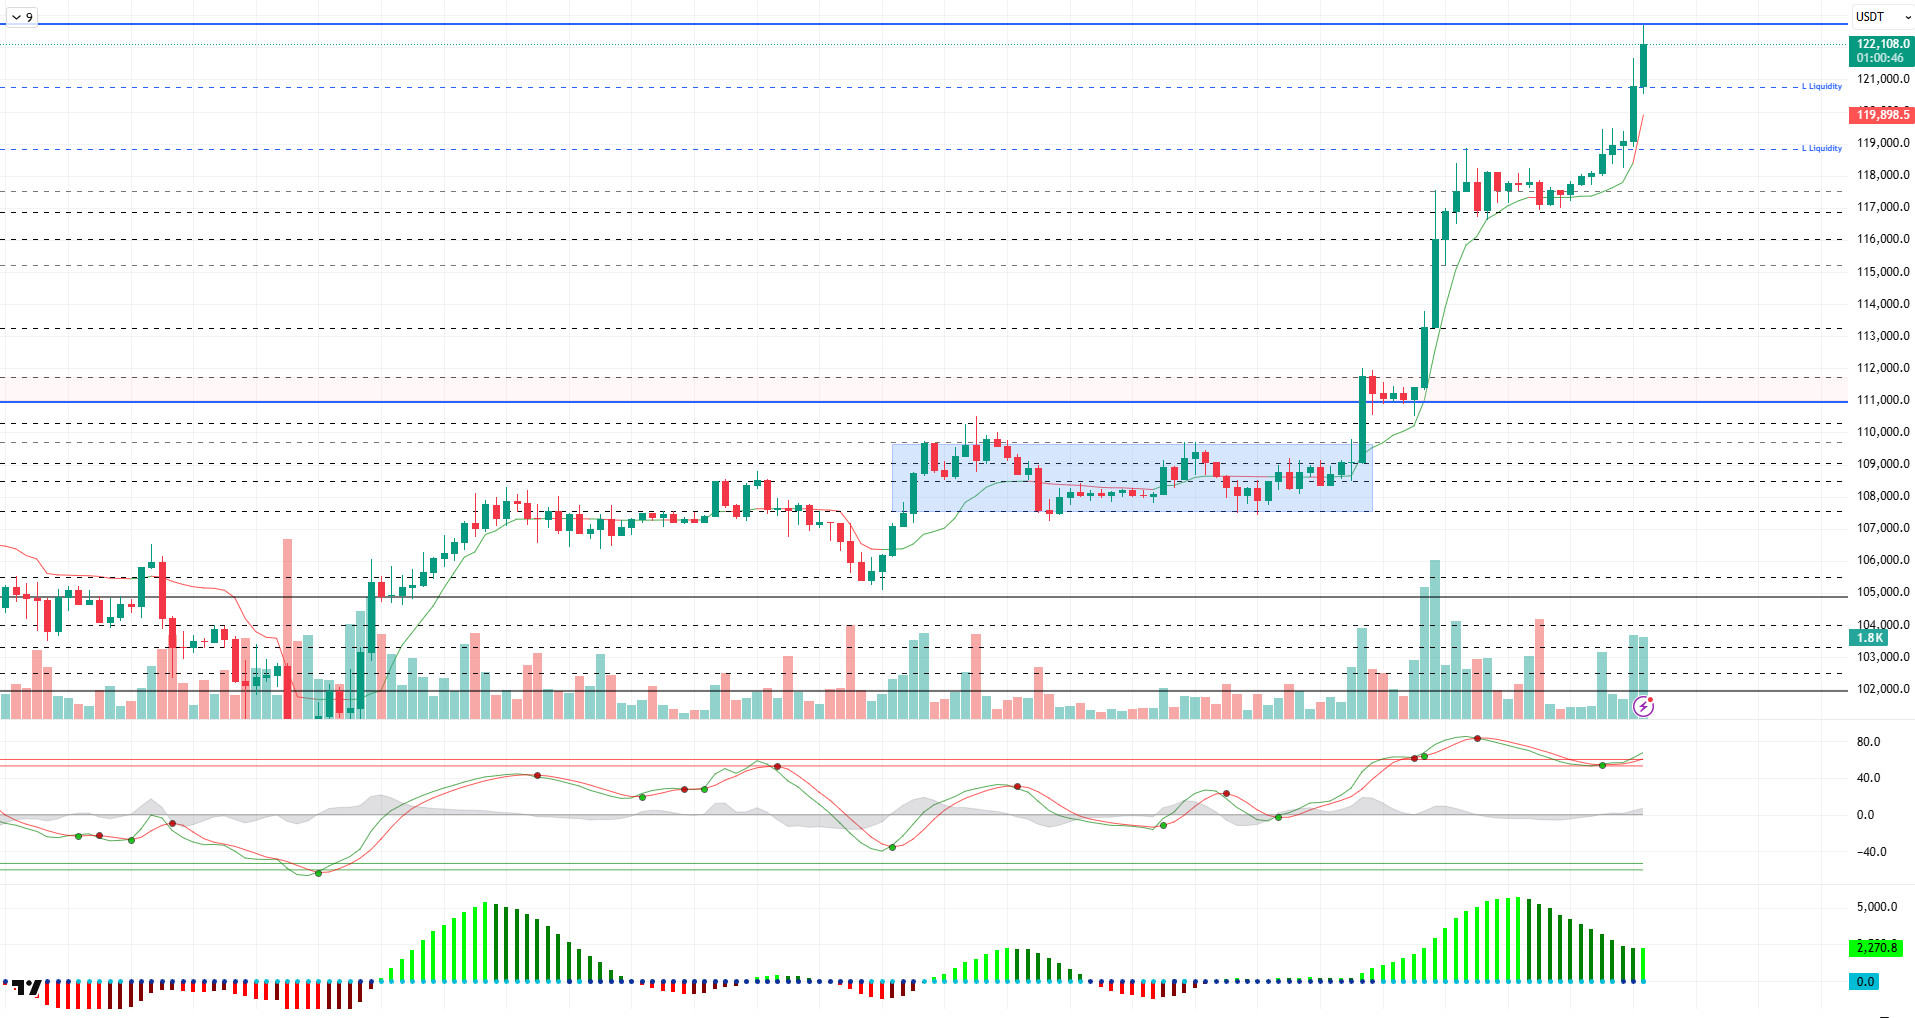
Looking at the technical picture, we can see that the upward trend in the BTC price is continuing. In the previous analysis, a new high was recorded at the 118,400 level. After consolidating at this level for a while, BTC regained momentum and reached an all-time high of 122,500. At the time of this analysis, BTC is trading at the 122,100 level and continues to maintain its strong position.
Looking at technical indicators, the Wave Trend (WT) oscillator continues to move in the overbought zone following the recent uptrend, while the Squeeze Momentum (SM) indicator regained momentum after a brief weakening in the positive zone. The Kaufman moving average rose to 119,900, remaining just below the price and supporting the uptrend.
When liquidity data is examined, a buy position accumulation is observed at the 116,400 level in the short term, while the 120,000 and 118,500 levels stand out as liquidity areas in shorter time frames.
In summary, it is noteworthy that fundamental developments continue to contribute positively to pricing and that BTC is entering the crypto week starting today with a new ATH. The technical outlook shows positive signs of returning to the overbought zone after a short-term pullback, while liquidity data continues to outline the limits of the decline. In the event of continued upward movement, the price will be monitored at the psychological resistance level of 125,000. In the event of potential selling pressure, the first support level will be monitored at 120,000, followed by the liquidity zone at 118,500.
Supports 120,000 – 118,500 – 116,400
Resistance levels 122,500 – 125,000 – 130,000
ETH/USDT
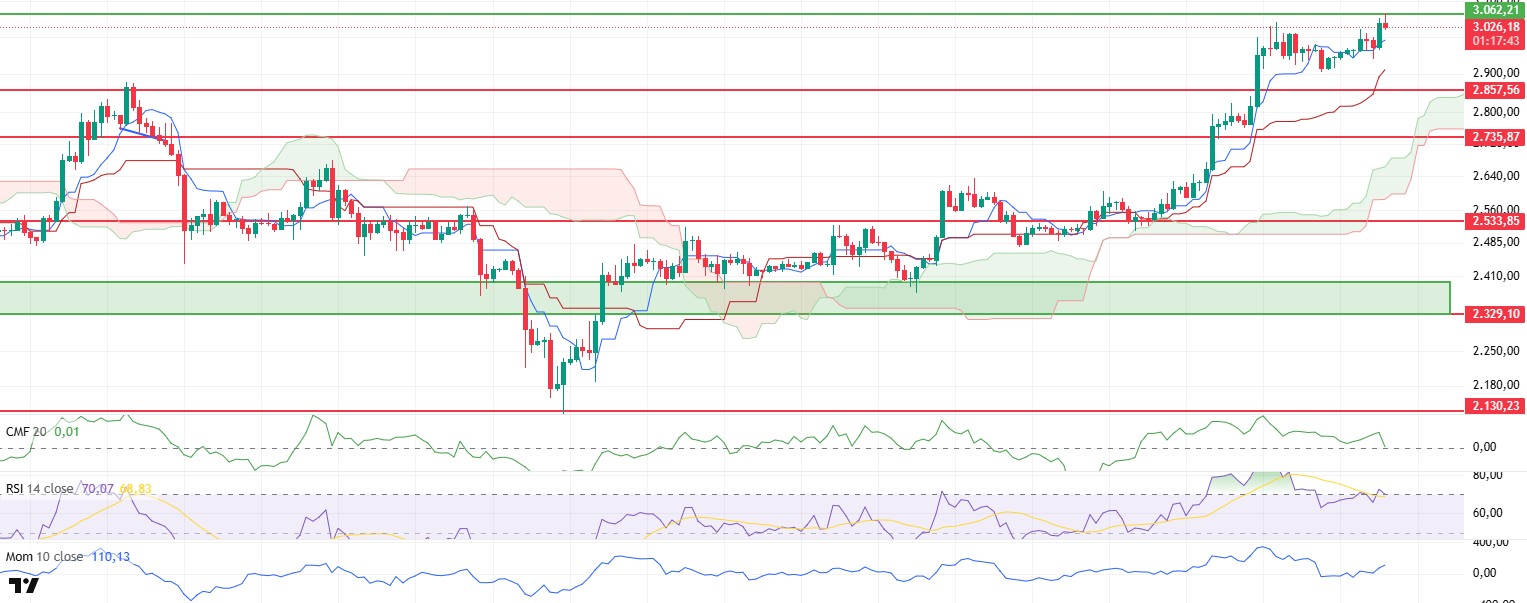
The ETH price fell back to around $2,900 as the weekend began. With buying activity from this area, the price reversed its direction upward, showing a gradual rise and managing to reach the resistance level at $3,062 by morning. However, the technical strength of this area as a resistance level caused the price to face selling pressure here, leading it to retreat back to the $3,030 level.
When technical indicators are examined, the upward trend of the Ichimoku cloud is noteworthy. In particular, the fact that the price continues to trade above both the Tenkan and Kijun levels indicates that the short-term outlook remains positive and that the market structure continues to be upward. This structure indicates that the overall trend has not yet weakened and that buyers are still in control.
The momentum indicator continues to recover despite the recent limited pullback. This indicates that the market still has strong capacity to respond to upward movements and that the short-term positive trend is continuing. The Relative Strength Index (RSI) indicator, despite being in the overbought zone, is maintaining its upward positive technical structure. This suggests that upward price movements could be sustainable from a technical perspective and that buying interest has not yet faded.
The Chaikin Money Flow (CMF) indicator experienced a significant pullback following the rejection at the $3.062 level but remains in positive territory. The positive divergence observed on the CMF indicates that capital inflows into the market are continuing despite temporary price declines. This serves as a signal supporting the notion that the overall upward trend in the market structure is being maintained and that the current declines are not likely to be sustained.
When evaluating the general technical table, the preservation of positive structures in the indicators makes it possible for the $3.062 level to be retested during the day. If this level is exceeded with high volume, the upward movement may gain momentum and continue with more aggressive movements. On the other hand, the 2,857 dollar level remains the most important support zone in the short and medium term. A sustained price movement below this level could weaken the current positive structure and lead to trend breaks.
Top of Form
Below the Form
Supports 2,857 – 2,735 – 2,533
Resistances 3.062 – 3.246 – 3.455
XRP/USDT
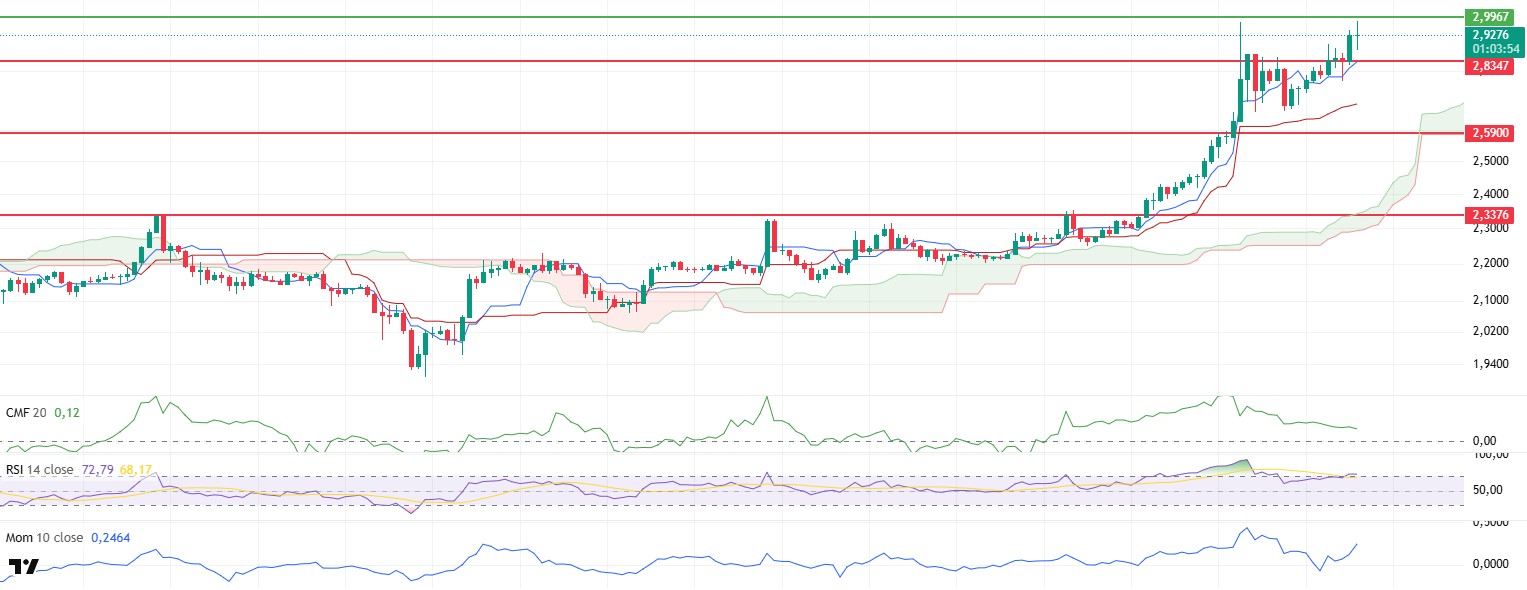
XRP fell to $2.66 on Friday amid selling pressure. However, buying from this level pushed the price back up, and it gradually recovered over the weekend, regaining the $2.83 level. On the first day of the week, it is attempting to test the strong resistance level at $2.99.
Technical indicators generally point to the continuation of the positive trend. Momentum indicators maintain their upward trend, supporting the market’s desire to recover. In particular, the Relative Strength Index (RSI) indicator’s re-entry into the overbought zone and its failure to show negative divergence in this zone indicate that the current uptrend is technically well-founded. This structure in the RSI reflects sustained buyer interest and continued positive pressure on prices.
The Ichimoku indicator also maintains its structure supporting the upward trend. The price being above both the Tenkan and Kijun levels presents a positive picture in terms of the short-term technical outlook. However, the Kumo cloud continuing to expand upward indicates that the market structure is strengthening and the trend is gaining depth.
However, the Chaikin Money Flow (CMF) indicator shows a decline. Despite the upward movement in prices, the weakening of the CMF indicates that profit-taking has begun in the market and that there has been a certain degree of liquidity outflow. This outlook reveals that, despite the preservation of positive structures in the technical structure, the risk of a correction in the short term cannot be ignored.
In light of all these indicators, it is highly likely that the XRP price will retest the $2.99 level during the day. A break of this region with strong volume could cause the price to encounter more aggressive upward movements. However, the $2.83 level represents a critical threshold in terms of downside risks. A break below this support level, especially in conjunction with the weakening CMF, could lead to the price entering a more severe correction phase. Therefore, the $2.83 level stands out as a region that requires close monitoring, both for short-term directional guidance and to preserve the positive technical structure.
Supports 2.8347 – 2.5900 – 2.3376
Resistances 2.9967 – 3.1497 – 3.4014
SOL/USDT
Memecoin launch platform Pump.fun raised $500 million in an initial coin offering (ICO) that sold out in approximately 12 minutes on Saturday. Kenya launched its own national digital token, KenyaNDT, on the Solana blockchain.
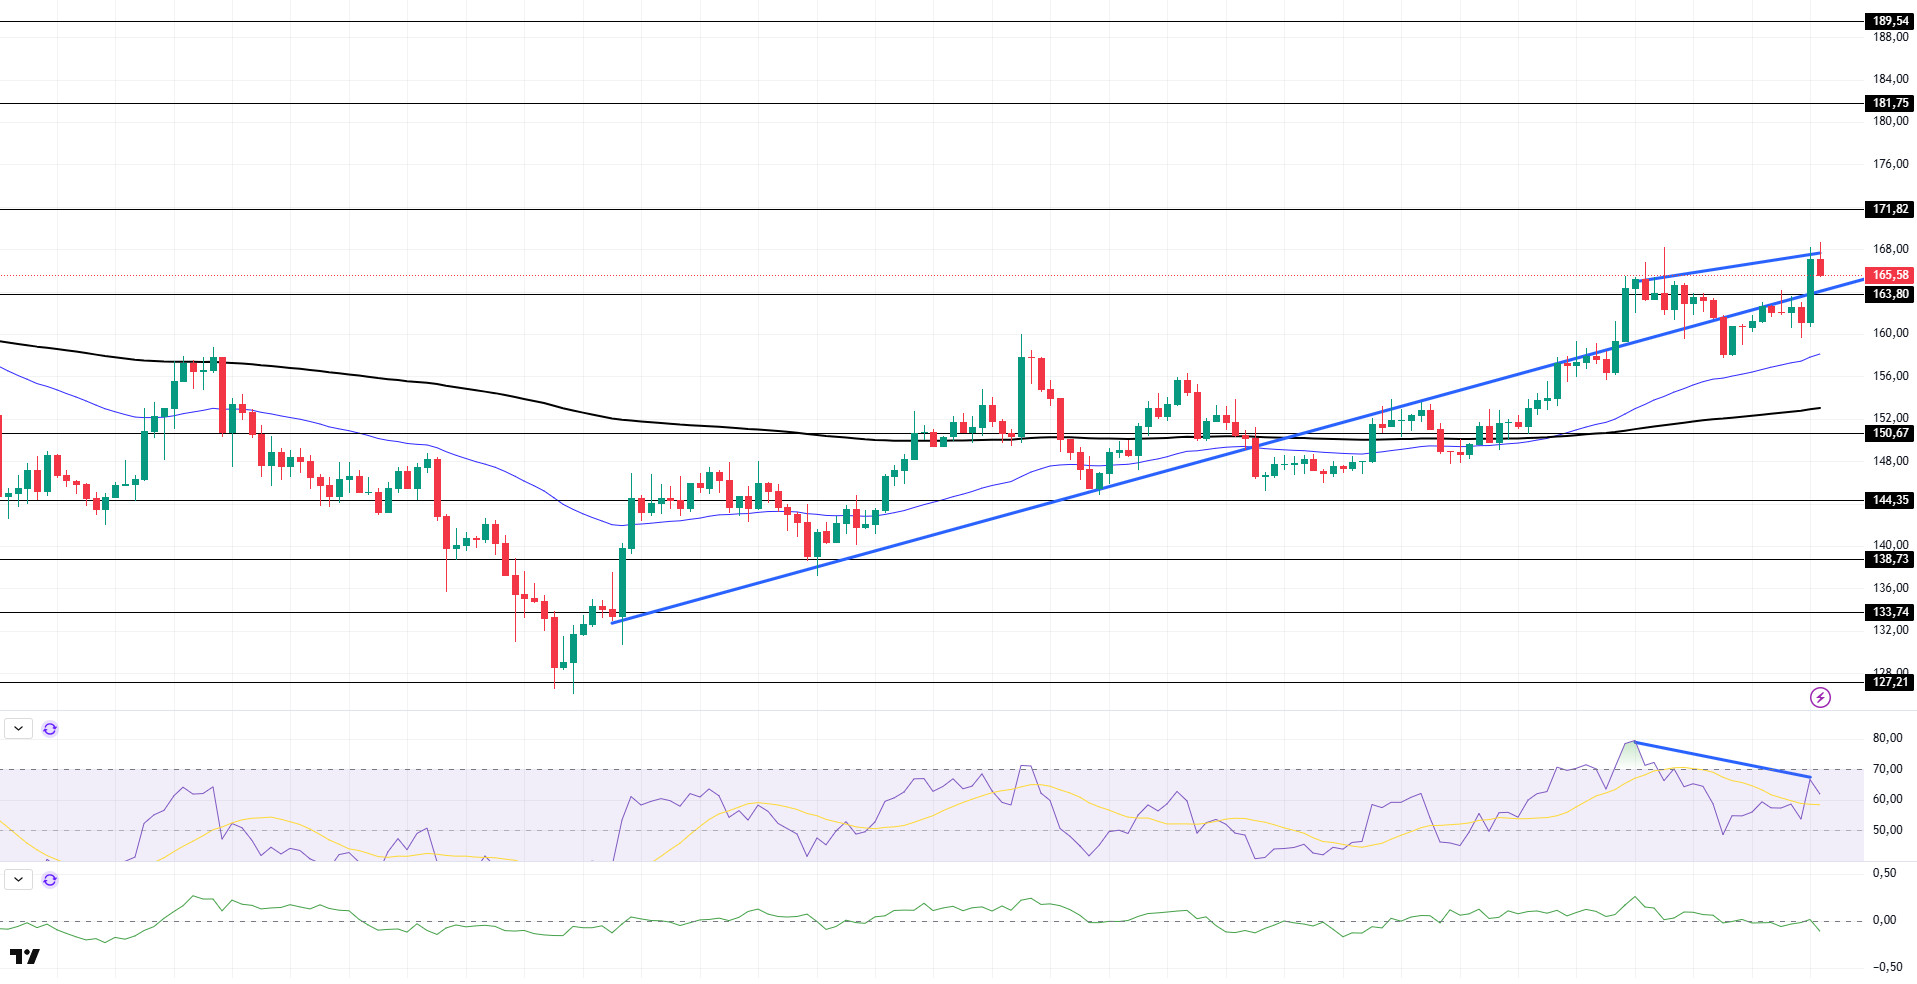
The price of SOL remained flat. The asset broke the upward trend that began on June 23, breaking through the strong resistance level of $163.80 and began trading above this level. If the upward momentum continues, the $171.82 level can be monitored as a resistance level. Otherwise, the upward trend can be considered as a support level in case of pullbacks.
On the 4-hour chart, the 50 EMA (Blue Line) remains above the 200 EMA (Black Line). This indicates that the medium-term uptrend may continue. Additionally, the price being above both moving averages suggests that the market is currently in a short-term uptrend. Chaikin Money Flow (CMF-20) has started to move into negative territory; however, the decline in money inflows could push CMF deeper into negative territory. Relative Strength Index (RSI-14) remains in positive territory, pulling back from the overbought zone. Additionally, a bearish double top formation has formed. This could signal a decline. If there is an upward movement due to positive macroeconomic data or news related to the Solana ecosystem, the $171.82 level emerges as a strong resistance point. If this level is broken upward, the upward trend is expected to continue. In the event of developments in the opposite direction or profit-taking, pullbacks may occur, testing the 163.80 dollar level. A decline to these support levels could see an increase in buying momentum, presenting a potential opportunity for an upward move.
Supports 163.80 – 150.67 – 144.35
Resistance levels 171.82 – 181.75 – 189.54
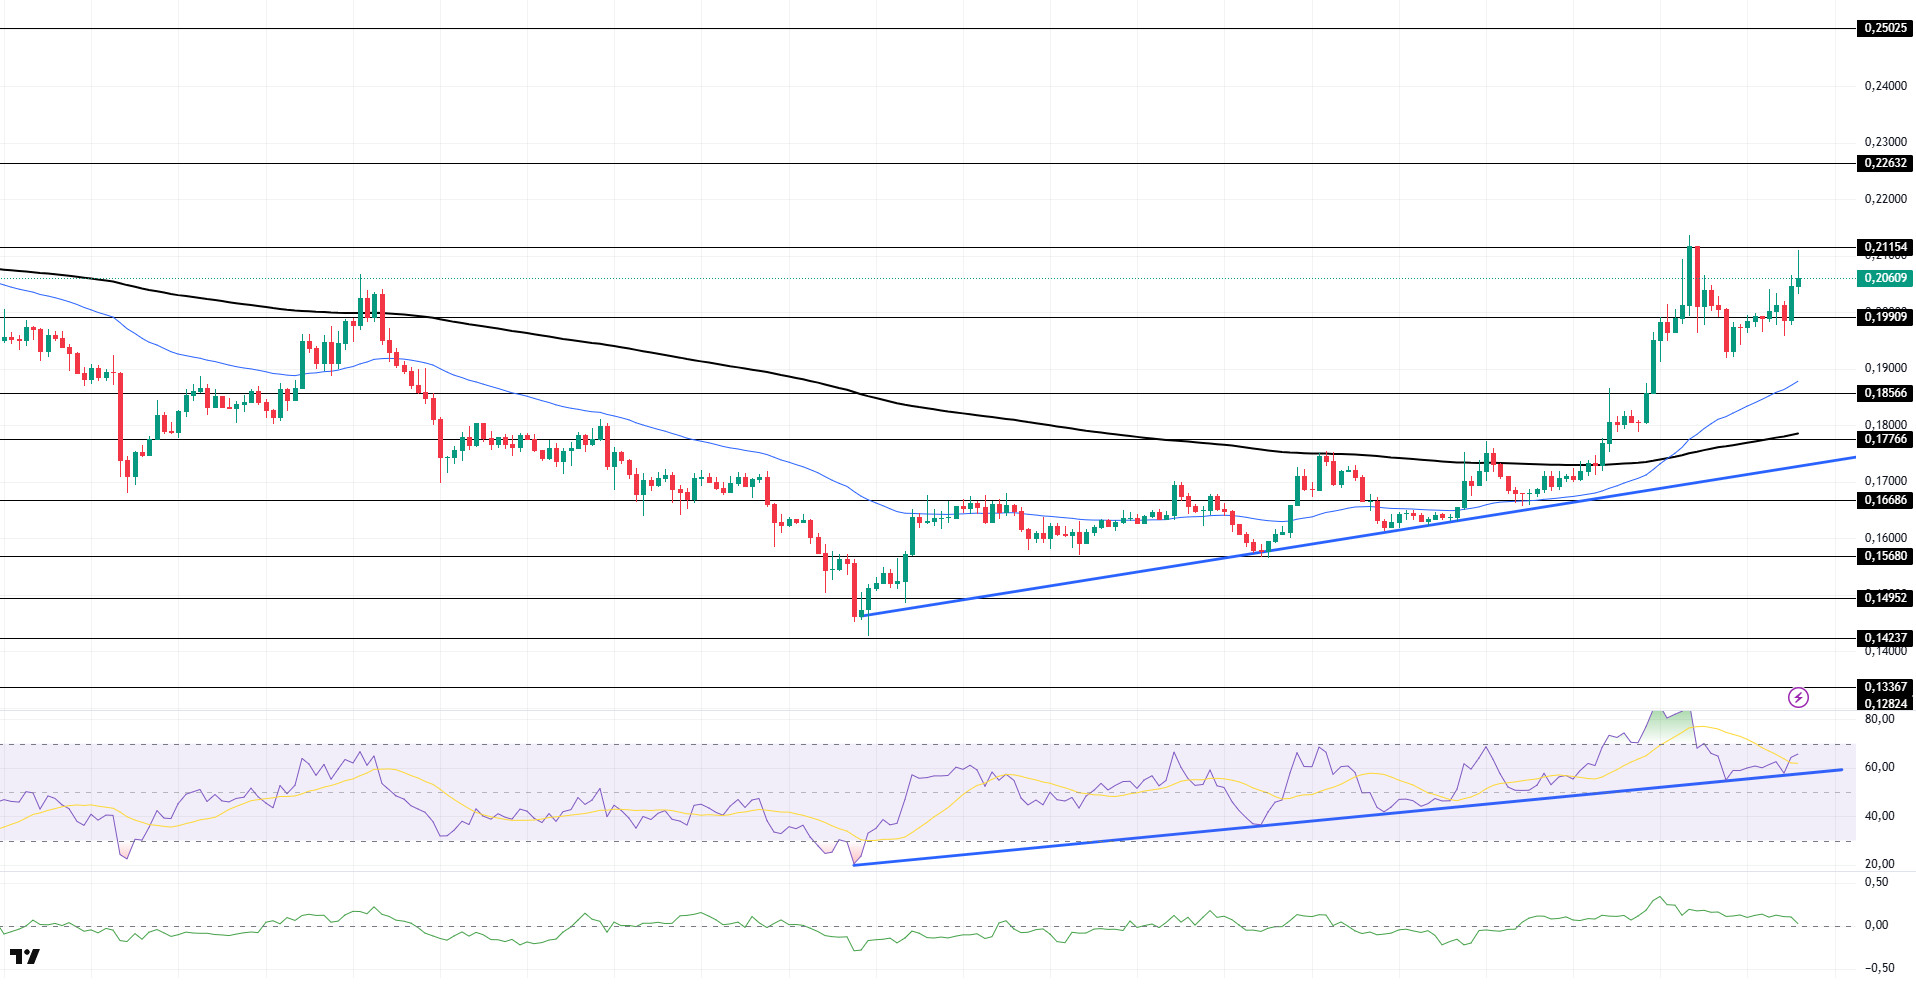
DOGE/USDT
DOGE experienced an uptrend.
With the uptrend that began on June 22, the asset managed to stay above the 200 EMA (black line) and 50 EMA moving averages, but failed to break through the strong resistance level of $0.21154 and retreated from there. If the upward momentum continues, the 0.21154 dollar level could be monitored as a resistance level again. In the event of a pullback, the 0.18566 dollar level could be triggered.
On the 4-hour chart, the 50 EMA (Blue Line) remains above the 200 EMA (Black Line). This indicates that the asset is in an upward trend in the medium term. The price being above both moving averages signals that the asset is in an upward trend in the short term. The Chaikin Money Flow (CMF-20) remains in positive territory. Additionally, negative cash inflows could push the CMF into the negative zone. The Relative Strength Index (RSI-14) is in the overbought zone and continues to hold above the upward trend that began on June 22, supported by that trend. Being in the overbought zone may trigger profit-taking. In the event of upward movements driven by political developments, macroeconomic data, or positive news flow within the DOGE ecosystem, the $0.21154 level emerges as a strong resistance zone. In the opposite scenario or in the event of negative news flow, the 0.18566 dollar level could be triggered. A decline to these levels could increase momentum and potentially initiate a new upward wave.
Supports 0.19909 – 0.18566 – 0.17766
Resistance levels 0.21154 – 0.22632 – 0.25025
Legal Notice
The investment information, comments and recommendations contained herein do not constitute investment advice. Investment advisory services are provided individually by authorized institutions taking into account the risk and return preferences of individuals. The comments and recommendations contained herein are of a general nature. These recommendations may not be suitable for your financial situation and risk and return preferences. Therefore, making an investment decision based solely on the information contained herein may not produce results in line with your expectations.