
Technical Analysis
BTC/USDT
Representatives of the US and China concluded the first day of talks in the Swedish capital; talks will continue on Tuesday. President Trump announced that tariffs of 15-20% will be imposed on nearly 200 countries with no trade agreements. The US Treasury Department raised its borrowing forecast to 1 trillion dollars to replenish its cash reserves after the debt ceiling was raised. Trump increased the pressure for the Russia-Ukraine ceasefire process, reducing the ultimatum period to 10-12 days and stating that secondary sanctions and high tariffs will be on the agenda otherwise.
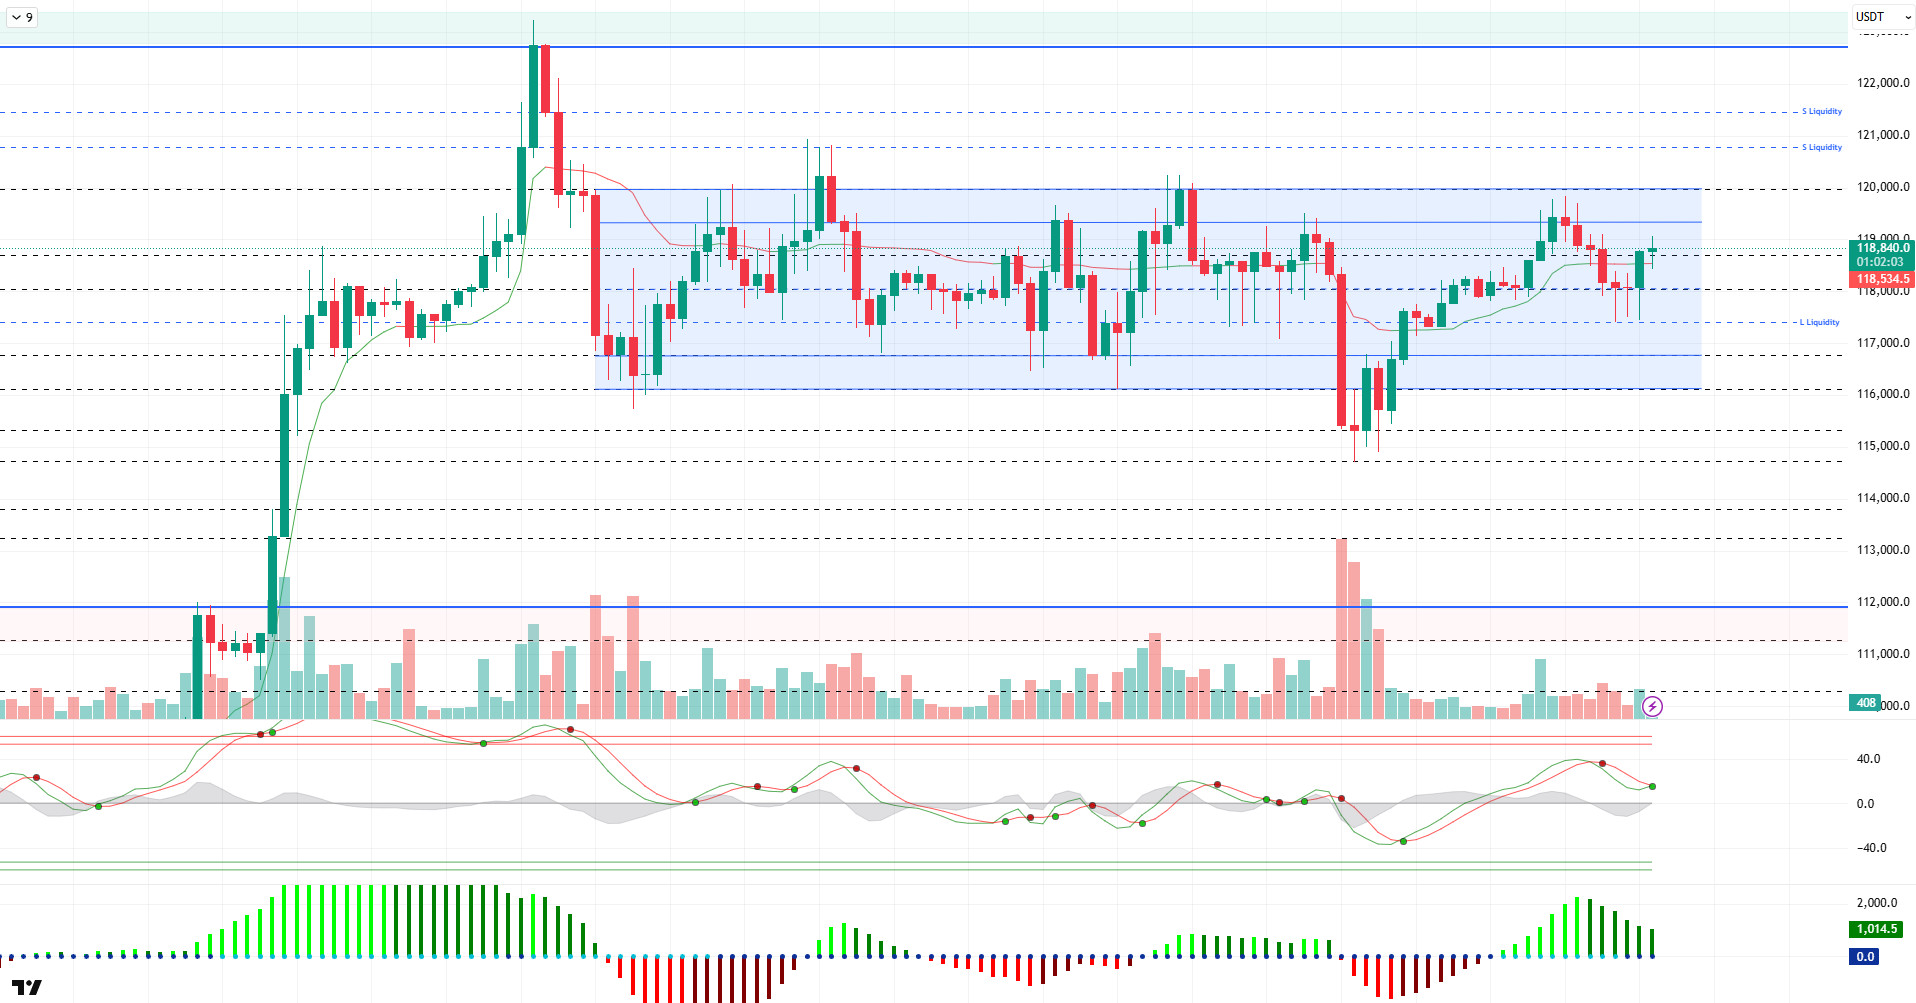
Looking at the technical outlook, BTC, which pushed above 119,000 in the previous analysis, could not stay here and spiked to the 117,500 support level with selling pressure. BTC, which then recovered again, continues to push the 119,000 level once again at the time of writing the analysis.
On the technical indicators front, the Wave Trend (WT) oscillator turned back to the overbought zone after the trend reversal in the mid-band of the channel with the decline. The Squeeze Momentum (SM) indicator is trying to regain momentum in the positive zone. The Kaufman moving average is just below the price at 118,500.
Looking at the liquidity data, it is seen that the buying levels in the 115,000 – 116,000 band were liquidated with the decline, while the selling transactions in the 118,000 – 119,000 band were liquidated with the rise. While the 120,600 level stands out as the closest liquidity area, it is observed that the buying level is re-accumulating at 117,000.
To summarize, BTC, which once again gained momentum amid fundamental developments, came back to its consolidated bandwidth. The technical outlook is approaching overbought territory, while liquidity data continues to define price limits. While a further rise in the price seems likely from a technical and liquidity perspective, the breach of the 120,000 resistance point will be followed in the first stage. If it breaks, it may face selling pressure from the 120,600 liquidity zone. In case of a possible new selling pressure, 117,500 stands out as a support point in case of a break of 118,600.
Supports 118,600 – 118,000 – 117,500
Resistances 120,000 – 120,600 – 121,500
ETH/USDT
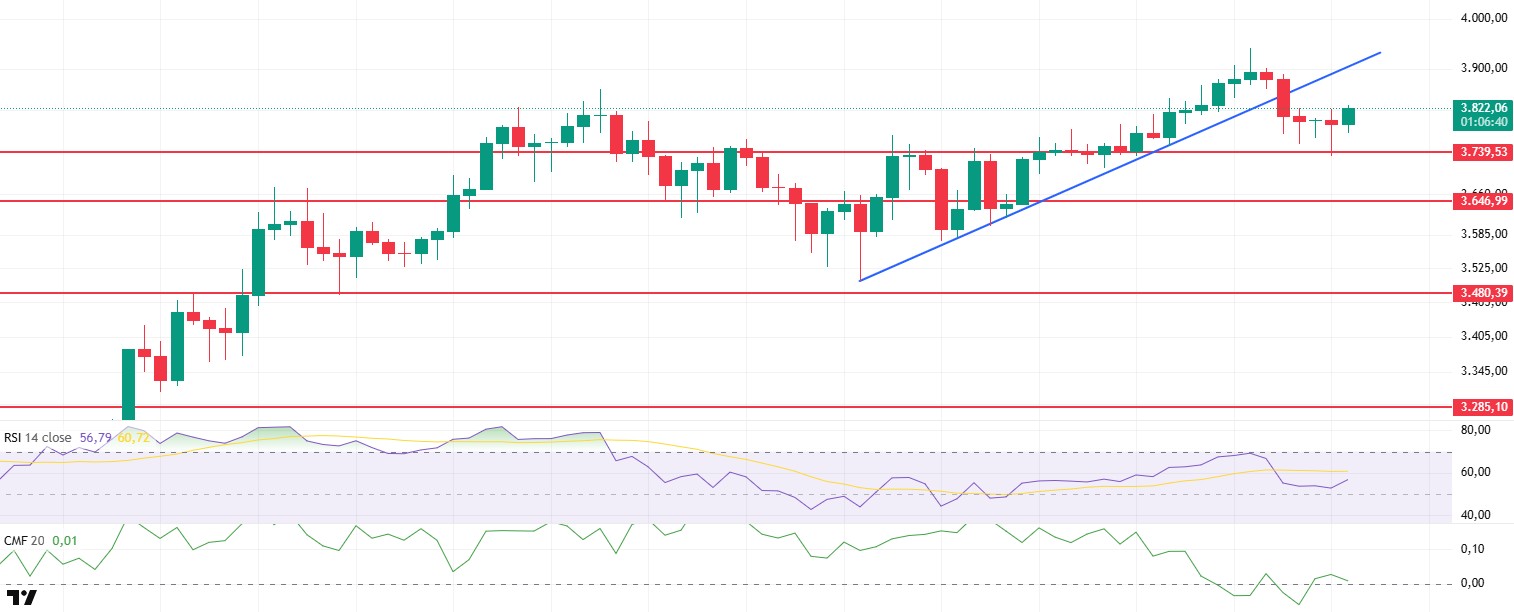
WLFI, the Trump family’s crypto project, purchased nearly $1 million worth of ETH at an average price of $3.895. While this development attracted attention in the market, the ETH price exhibited a more decisive movement in terms of technical outlook. Yesterday evening, selling pressure increased as the rising trend line, indicated by the blue line on the chart, was broken and the price retreated to the support level of $3,739 as expected. However, thanks to the purchases from this region, it was able to recover in the morning hours and rise above the $3,800 level. Although this reaction movement creates a short-term relief, the fact that the price has not yet regained the trend line it broke shows that caution should be exercised technically.
Analysing the market data, both technical indicators and on-chain metrics reveal that the current weakness continues. Open interest data fell as low as $26.19 billion, indicating that long positions in futures were closed. This suggests that investors are becoming risk averse and reducing their positions as the price enters a downtrend. At the same time, the decline in the funding rate supports that investors who took long positions are reluctant to continue these transactions and the short-term downward pressure is still active.
The Relative Strength Index (RSI) indicator presents a mixed picture in terms of momentum. Although the indicator dipped below the moving average-based line it moves above, it has turned up again with support at 52. This suggests that a buying reaction has started and the price is trying to gain strength in the short term. However, as the RSI is still far from the overbought zone, it is hard to say that the bullishness is clear. On the other hand, the horizontal course of the Chaikin Money Flow (CMF) indicator near the zero line suggests that there is no strong capital inflow into the market, meaning that there is no strong liquidity support behind the recent rise. This structure of CMF indicates that the rallies may be fragile.
When evaluated in the light of all this data, it is seen that the ETH price has realized a short-term reaction rise with the support it received from the $3,739 level, but in order for this movement to be permanent, it must settle above the trend line it broke again. Otherwise, there is a high risk that the price will head towards the $3,739 support again. If this level is broken downwards, sales are likely to accelerate and trigger a deeper correction. On the other hand, the price’s ability to close above the $3,900 level could invalidate the negative outlook in technical terms and pave the way for a new uptrend. Therefore, price movements above the trend line should be closely monitored in short-term transactions.
Top of Form
Below the Form
Supports 3,739 – 3,646 – 3,480
Resistances 4,084 – 4,381 – 4,857
XRP/USDT
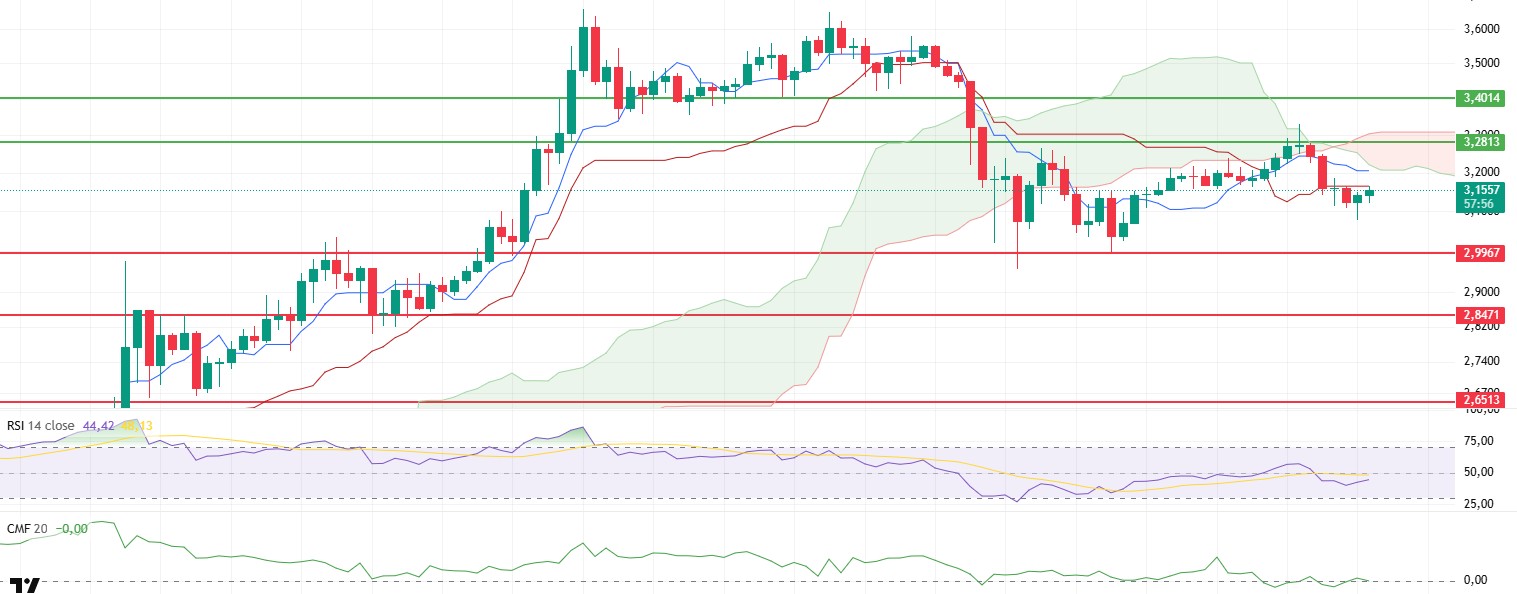
XRP price formed a wick-off candle just above the $3.28 level yesterday, seeing a clear rejection from resistance in this area. With the subsequent selling pressure, the price retreated sharply to the $3.08 level, as expected. With buyers stepping in in this region, XRP managed to recover in the morning hours and test the $3.15 level again. However, the fact that the price is still below the levels it broke shows that the technical weakness continues.
Technical indicators support this weakness. The Chaikin Money Flow (CMF) indicator has been moving within a horizontal band for a long time, indicating that there has been no net capital inflow into the market and therefore a strong buying demand in terms of liquidity has not yet formed. This poses an important risk factor for the persistence of the uptrend because even if the price makes upward attempts, the sustainability of these movements may be limited.
Analysing the Ichimoku indicator, the price continues to remain below both the tenkan and kijun levels. However, the price is also moving below the kumo cloud level. This structure makes it clear that the short-term trend is still bearish and the market remains under technical pressure. In order to break out of the bearish pressure, the price has to break through the tenkan resistance at 3.2065. However, this level alone may not be enough. Because in order to confirm a more permanent rise, the price must also rise above the upper band of the kumo cloud at the level of 3.30 dollars.
As a result, if the XRP price cannot exceed the 3.2065 tenkan level during the day, it is likely to test the support of $ 3.08 with a downward movement again. If this support is lost, further deepening of sales can be expected. On the other hand, if the price breaks both the tenkan level and the upper band of the kumo cloud, it may pave the way for the end of the technically negative outlook and the start of a new uptrend. Therefore, the impact of these two levels on price behavior in the coming hours will be critical.
Supports 2.9967 – 2.8471 – 2.6513
Resistances 3.2813 – 3.4014 – 3.8615
SOL/USDT
SEC delays Grayscale spot Solana ETF. Solana treasury company Upexi (UPXI) announced the signing of a $500 million equity line of credit agreement with Alliance Global Partners. Invesco Galaxy applied for a Solana ETF with CBOE.
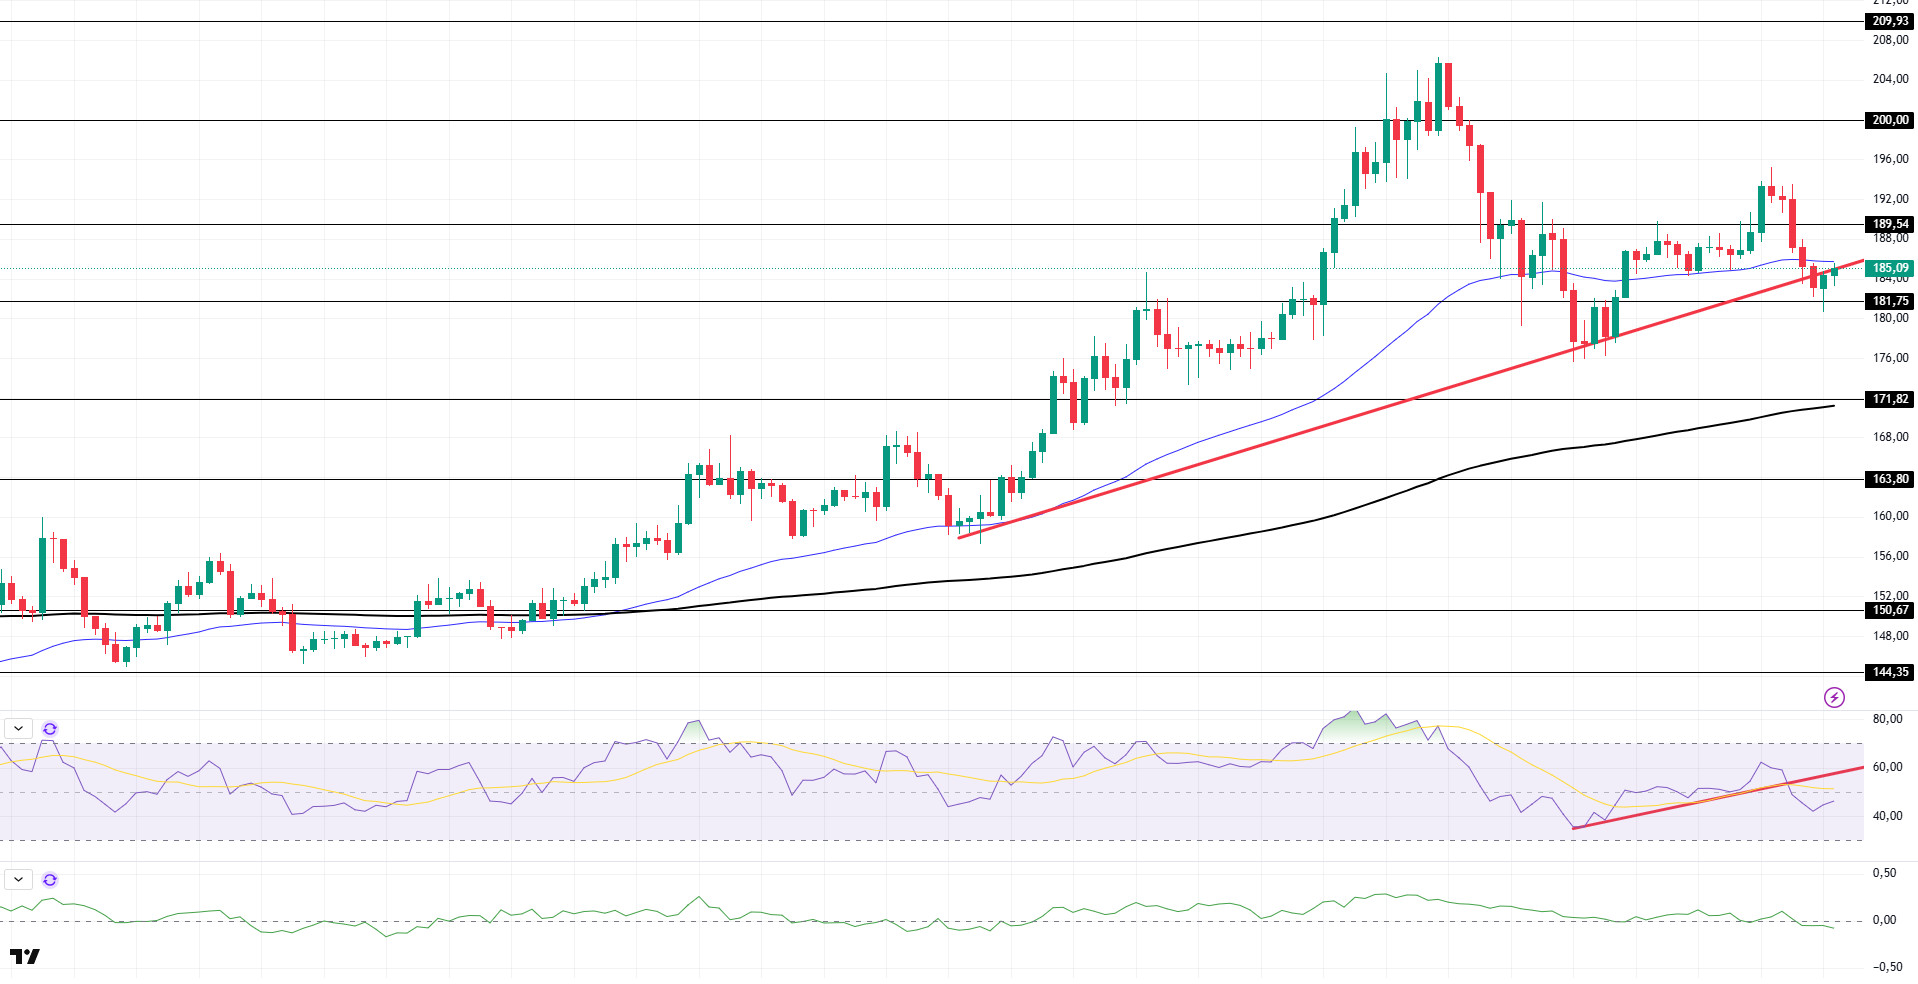
SOL price experienced a decline. The asset retreated by breaking the $189.54 level and the 50 EMA (Blue Line) moving average to the downside. The price, which is also below the uptrend that started on July 15, is currently testing this as resistance. If the pullback continues, the 200 EMA (Black Line) moving average can be followed. If the rises begin, the $ 189.54 level can be followed.
On the 4-hour chart, the 50 EMA (Blue Line) continues to be above the 200 EMA (Black Line). This indicates that the upward trend may continue in the medium term. At the same time, the fact that the price is between both moving averages suggests that the market is currently in the decision phase. On the other hand, a large difference between the two moving averages may trigger a bearish or sideways trend. Chaikin Money Flow (CMF-20) started to be in negative territory. However, the decline in money inflows may take CMF deeper into the negative zone. Relative Strength Index (RSI-14) crossed below the uptrend that started on July 25. This may continue the decline. The $200.00 level stands out as a strong point of resistance in the event of a rally on the back of macroeconomic data or positive news on the Solana ecosystem. If this level is broken upwards, the rise can be expected to continue. If there are pullbacks due to contrary developments or profit realizations , the $171.82 level can be tested. In case of a decline to these support levels, the increase in buying momentum may offer a potential bullish opportunity.
Supports 181.75 – 171.82 – 163.80
Resistances 189.54 – 200.00 – 209.93
DOGE/USDT
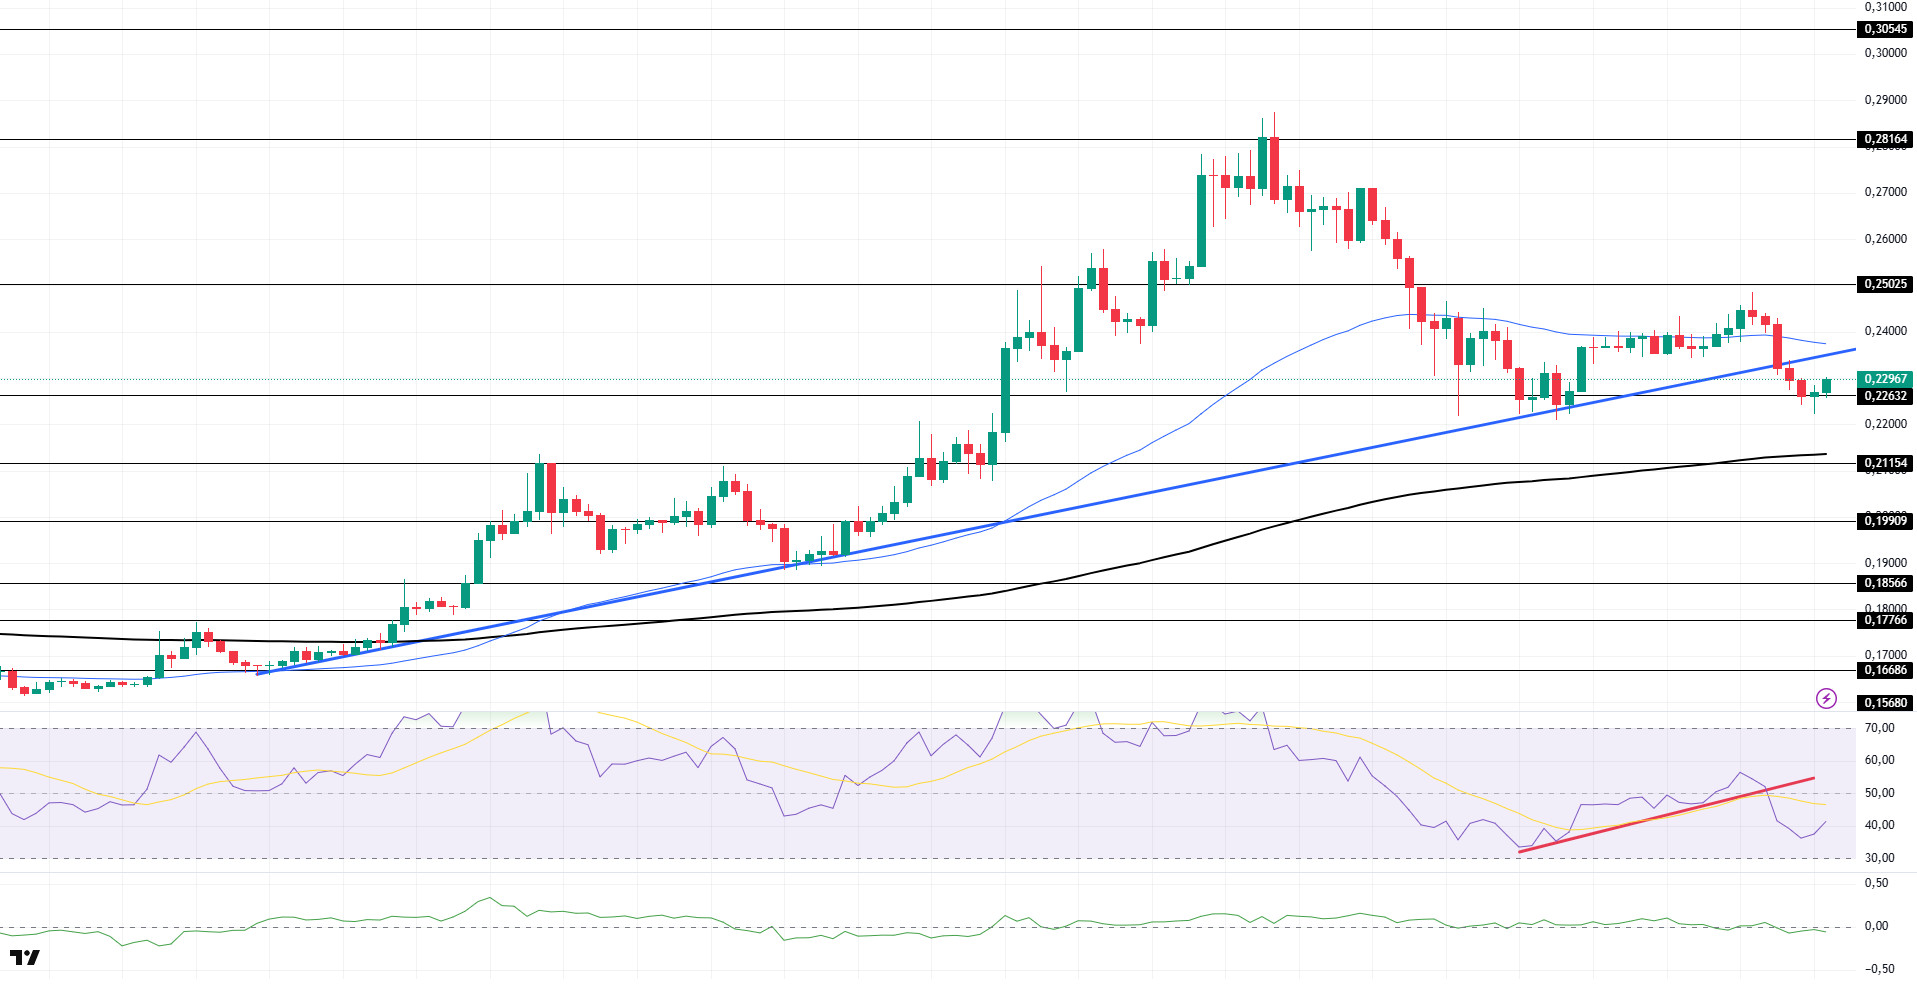
DOGE price has declined. The asset crossed below the 50 EMA (Blue Line) moving average with the uptrend that started on July 7. The price is currently testing the $0.22632 level as support. If the retracement continues, the 200 EMA (Black Line) moving average can be followed as a support level. If the rise starts, the level of 0.25025 dollars should be followed.
On the 4-hour chart, the 50 EMA (Blue Line) continues to be above the 200 EMA (Black Line). This suggests that the asset is bullish in the medium term. The fact that the price is between both moving averages suggests that the asset is in the decision phase in the short term. Chaikin Money Flow (CMF-20) switched to negative. In addition, negative inflows may move CMF to the mid-levels of the negative zone. Relative Strength Index (RSI-14) moved into negative territory. In addition, it is now below the uptrend that started on July 25. This may continue the decline. The $0.25025 level stands out as a strong resistance zone in case of a possible rise in line with political developments, macroeconomic data or positive news flow in the DOGE ecosystem. In the opposite case or possible negative news flow, the $0.21154 level may be triggered. In case of a decline to these levels, the momentum may increase and a new bullish wave may start.
Supports 0.22632 – 0.21154 – 0.19909
Resistances 0.25025 – 0.28164 – 0.30545
Legal Notice
The investment information, comments and recommendations contained herein do not constitute investment advice. Investment advisory services are provided individually by authorized institutions taking into account the risk and return preferences of individuals. The comments and recommendations contained herein are of a general nature. These recommendations may not be suitable for your financial situation and risk and return preferences. Therefore, making an investment decision based solely on the information contained herein may not produce results in line with your expectations.

