
Technical Analysis – October 6, 2025 – Evening
BTC/USDT
According to CoinShares data, there was a net inflow of $6 billion into crypto ETPs on a weekly basis, while total assets under management rose to $254 billion. Strategy paused Bitcoin purchases this week, while Alameda Research’s wallets still hold $1.2 billion worth of digital assets. In Japan, Sanae Takaichi’s election as prime minister raised expectations for crypto-friendly policies, while the EU is reportedly preparing to grant ESMA broad oversight authority over crypto markets. Globally, publicly traded companies purchased $678 million worth of Bitcoin over the past week, while UK-based The Smarter Web Company is preparing for a new $16.5 million funding round.
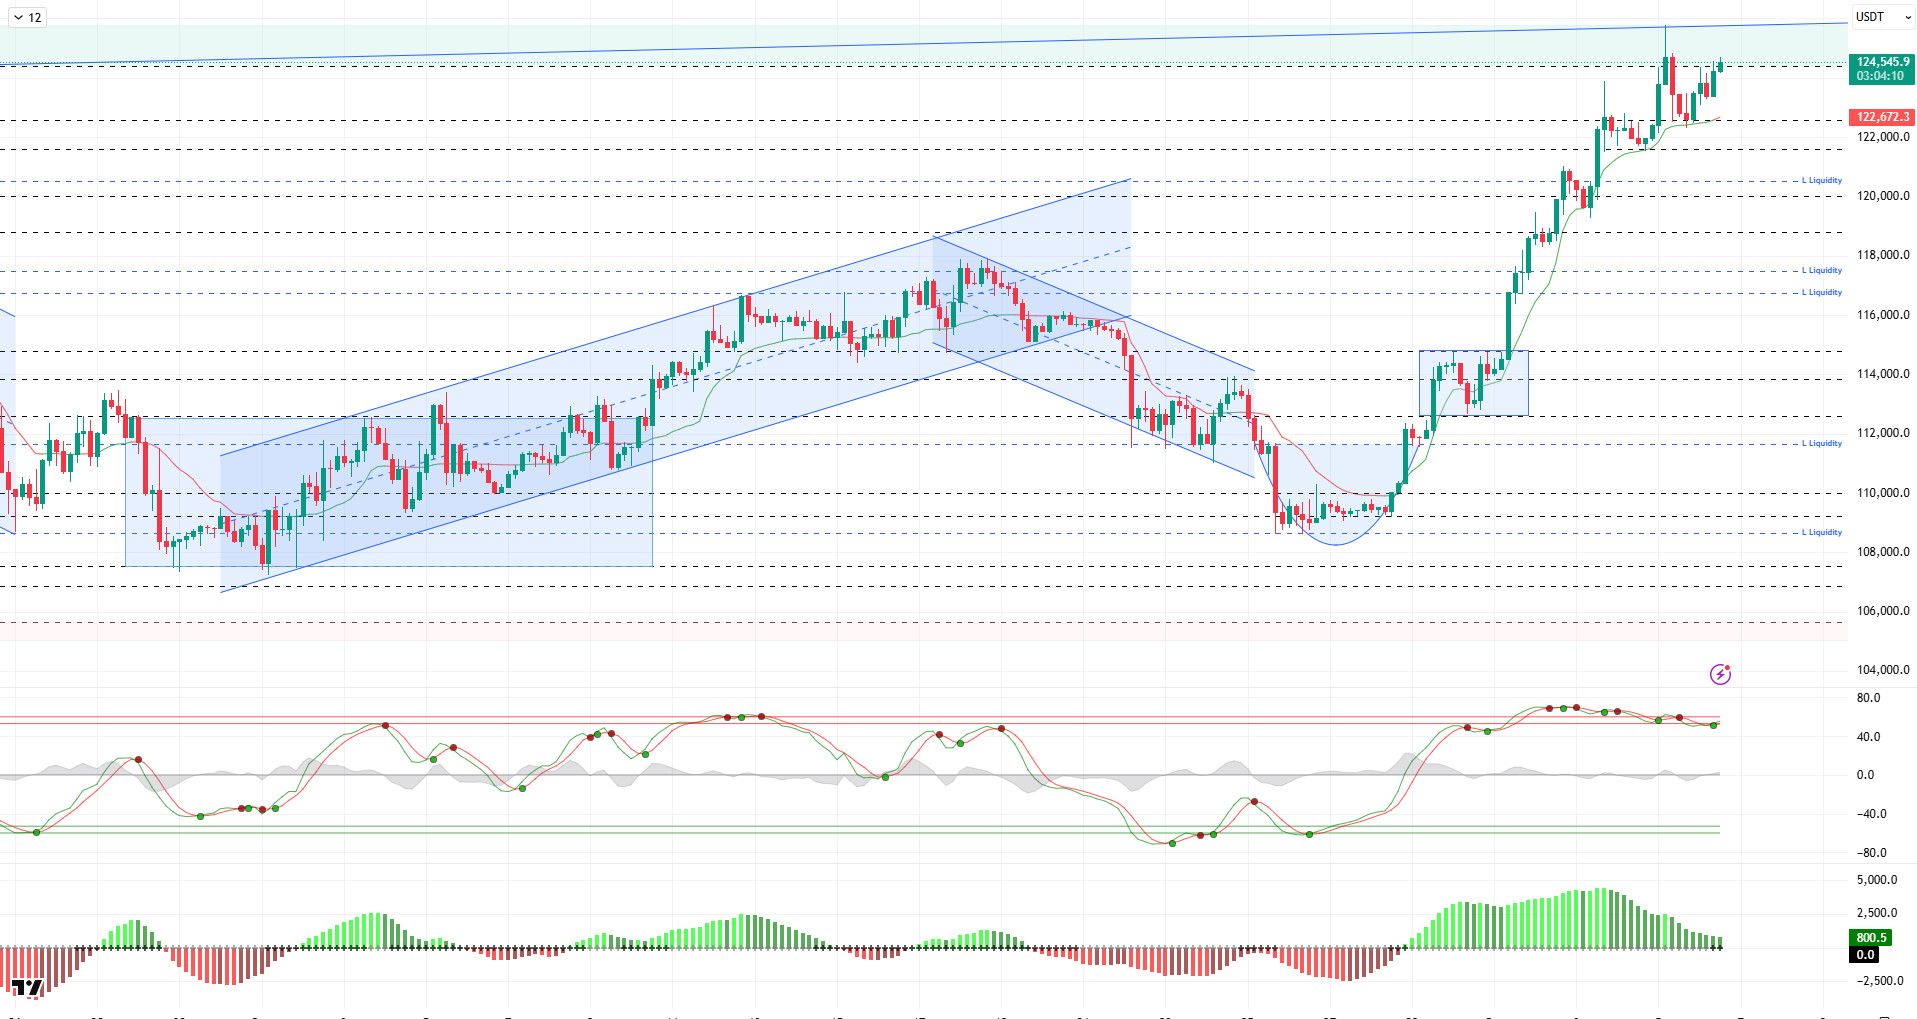
Looking at the technical picture, BTC continued the upward rally it started in the last week of September, attempting a new peak and reaching an all-time high (ATH) of $125,750. BTC, which carried the peak attempts on July 14 and August 13 upwards, continues to consolidate near the peak. Gaining momentum in parallel with the cup formation in price movements, BTC completed the Gartley formation and broke through the $120,500 level, completing a “W” type movement. At the time of writing, it continues to trade at the $124,500 level.
Technical indicators show indecisive movements, with the Wave Trend oscillator (WT) producing consecutive buy-sell signals in the overbought zone. The Squeeze Momentum (SM) indicator continues its momentum within the positive area of the histogram while showing negative divergence. The Kaufman moving average is currently trading below the price at the 122,500 level.
When examining liquidation data, the recent upward movement has led to accumulation at the 120,000 level ( ), while the intensity previously recorded at the 117,800 and 116,600 levels continues. In a broader time frame, the 112,200 level stands out as an accumulation zone. In contrast, the selling level continues to maintain its volatility.
In summary, while the US government shutdown has had no significant impact on the markets, Fed members’ differing views on interest rate cuts and the return of tariffs to the agenda are among the prominent developments. The negative outlook for short-term interest rate cuts regained strength with interest rate cut expectations rising to 98%. On the BTC side, in terms of cyclical movements, it recorded an 8.24% increase in October, when double-digit averages were reached, making a strong entry and testing a new ATH level. The technical outlook reached saturation point with the price testing the 125,750 ATH level, while liquidity data set a precedent by rising and resisting the cycle. From this point on, in the event of a possible correction, the minor support level will be 122,700, while 120,500 will be monitored as a critical reference area. If the rise continues, we will follow the ATH level and then the psychological resistance areas.
Supports: 122,700 – 121,400 – 120,500
Resistances: 124,300 – 125,700 – 129,000
ETH/USDT
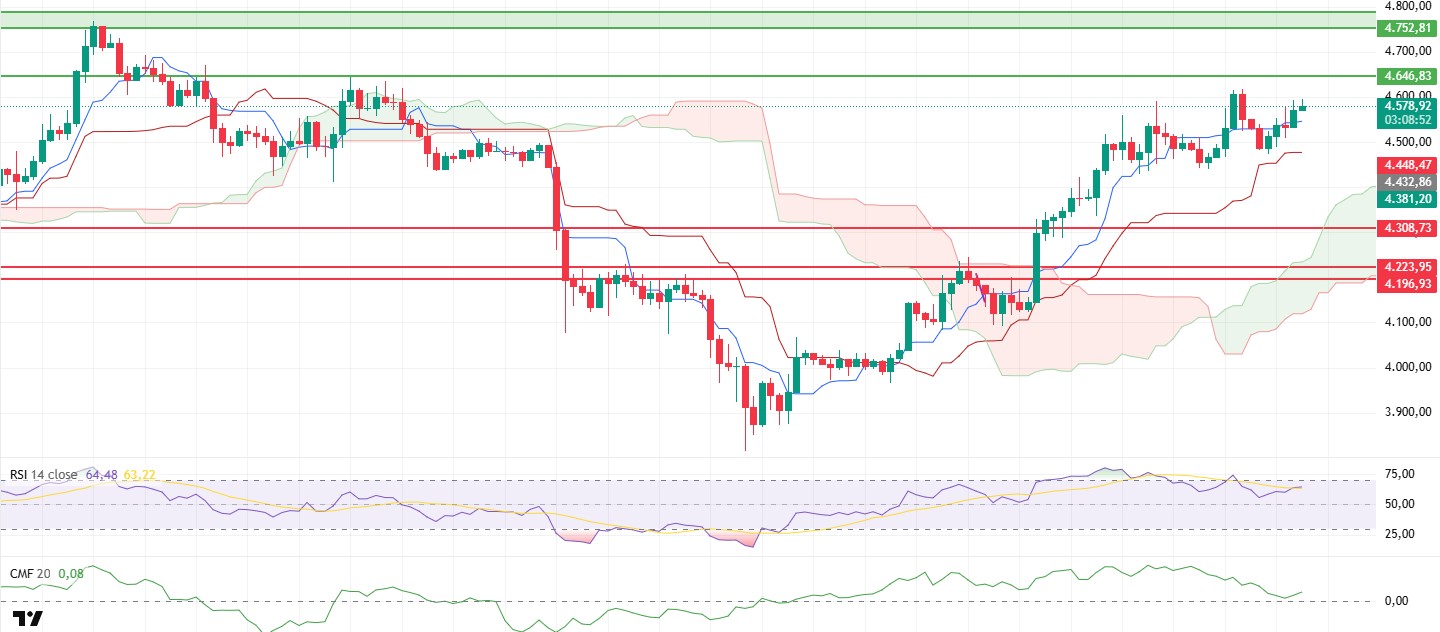
The ETH price rose to $4,600 during the day, continuing its upward trend. Although there was a slight pullback from this point, the overall picture shows that momentum remains strong and buyers maintain their dominance in the market. Price movements confirm that the upward trend continues in the short term and that buyers are taking advantage of pullbacks.
Liquidity indicators also support this picture. The Chaikin Money Flow (CMF) indicator continues its upward trend, supported by the zero line. This outlook shows that liquidity inflows have resumed, albeit limited, and that the upside potential is gaining strength. Although spot flows have not yet reached the desired levels, the signal that new capital inflows into the market have begun stands out as positive data.
The overall structure of the Ichimoku indicator remains unchanged. The price still trading above the kumo cloud confirms that the trend remains positive and the market continues to be buyer-driven. This structure shows that short-term pullbacks are not disrupting the main upward trend.
The Relative Strength Index (RSI) indicator also maintains its current upward trend, signaling that momentum continues to strengthen. This outlook indicates that short-term upward momentum could be sustained if the price remains above the $4,600 level.
Overall, ETH price is expected to continue moving towards the $4,646 resistance level. However, the fact that the weakness in the CMF indicator has not completely disappeared increases the critical importance of the $4,441 level. The price remaining above this support level indicates that the overall uptrend will be maintained.
Top of Form
Below the Form
Supports: 4,441 – 4,308 – 4,196
Resistances: 4,646 – 4,752 – 4,857
XRP/USDT
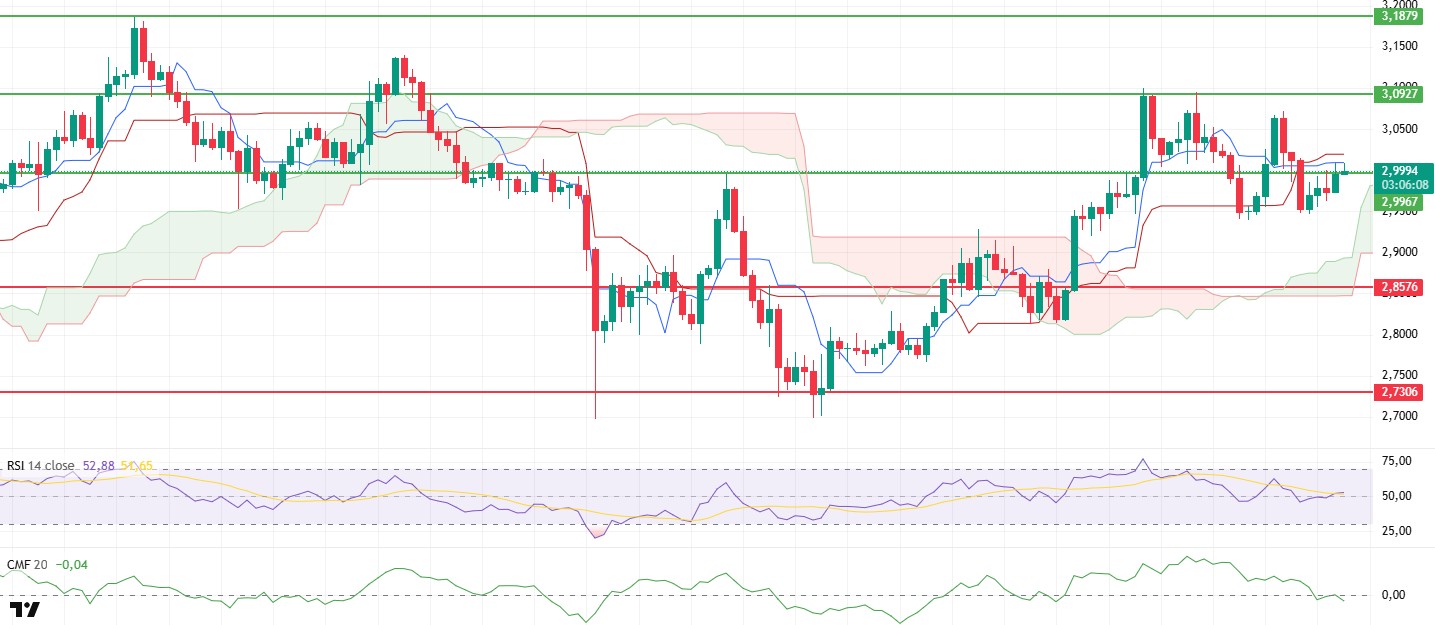
Although the XRP price rose above the $2.99 level during the day, signaling a short-term recovery, it remains weak in terms of volume and liquidity inflows. This outlook shows that despite the price’s upward moves, buyers’ power in the market remains limited and the rise is struggling to find support.
The Chaikin Money Flow (CMF) indicator continues its downward movement in negative territory. This outlook indicates that liquidity outflows from the market are continuing and that the risk of decline is still on the table. The CMF’s weak outlook emphasizes that buyers are unable to provide sufficient support to the market and that caution is needed regarding the sustainability of the uptrend.
The overall structure of the Ichimoku indicator remains the same. The Tenkan level staying below the Kijun level signals that caution is needed in the short-term outlook. However, if the price rises above the Tenkan level again, the impact of this negative signal may be limited.
The Relative Strength Index (RSI) indicator maintains its current position, showing that momentum continues horizontally. This reveals that the market is still searching for direction and that the buyer-seller balance has not yet been clarified.
Overall, as long as the XRP price maintains its support at $2.99, a retest of the $3.09 resistance is expected. However, if the $2.99 level is lost, the likelihood of increased selling pressure and a deeper correction in the short term will strengthen.
Supports: 2.9967 – 2.8576 – 2.7306
Resistances: 3.0927 – 3.1879 – 3.3058
SOL/USDT
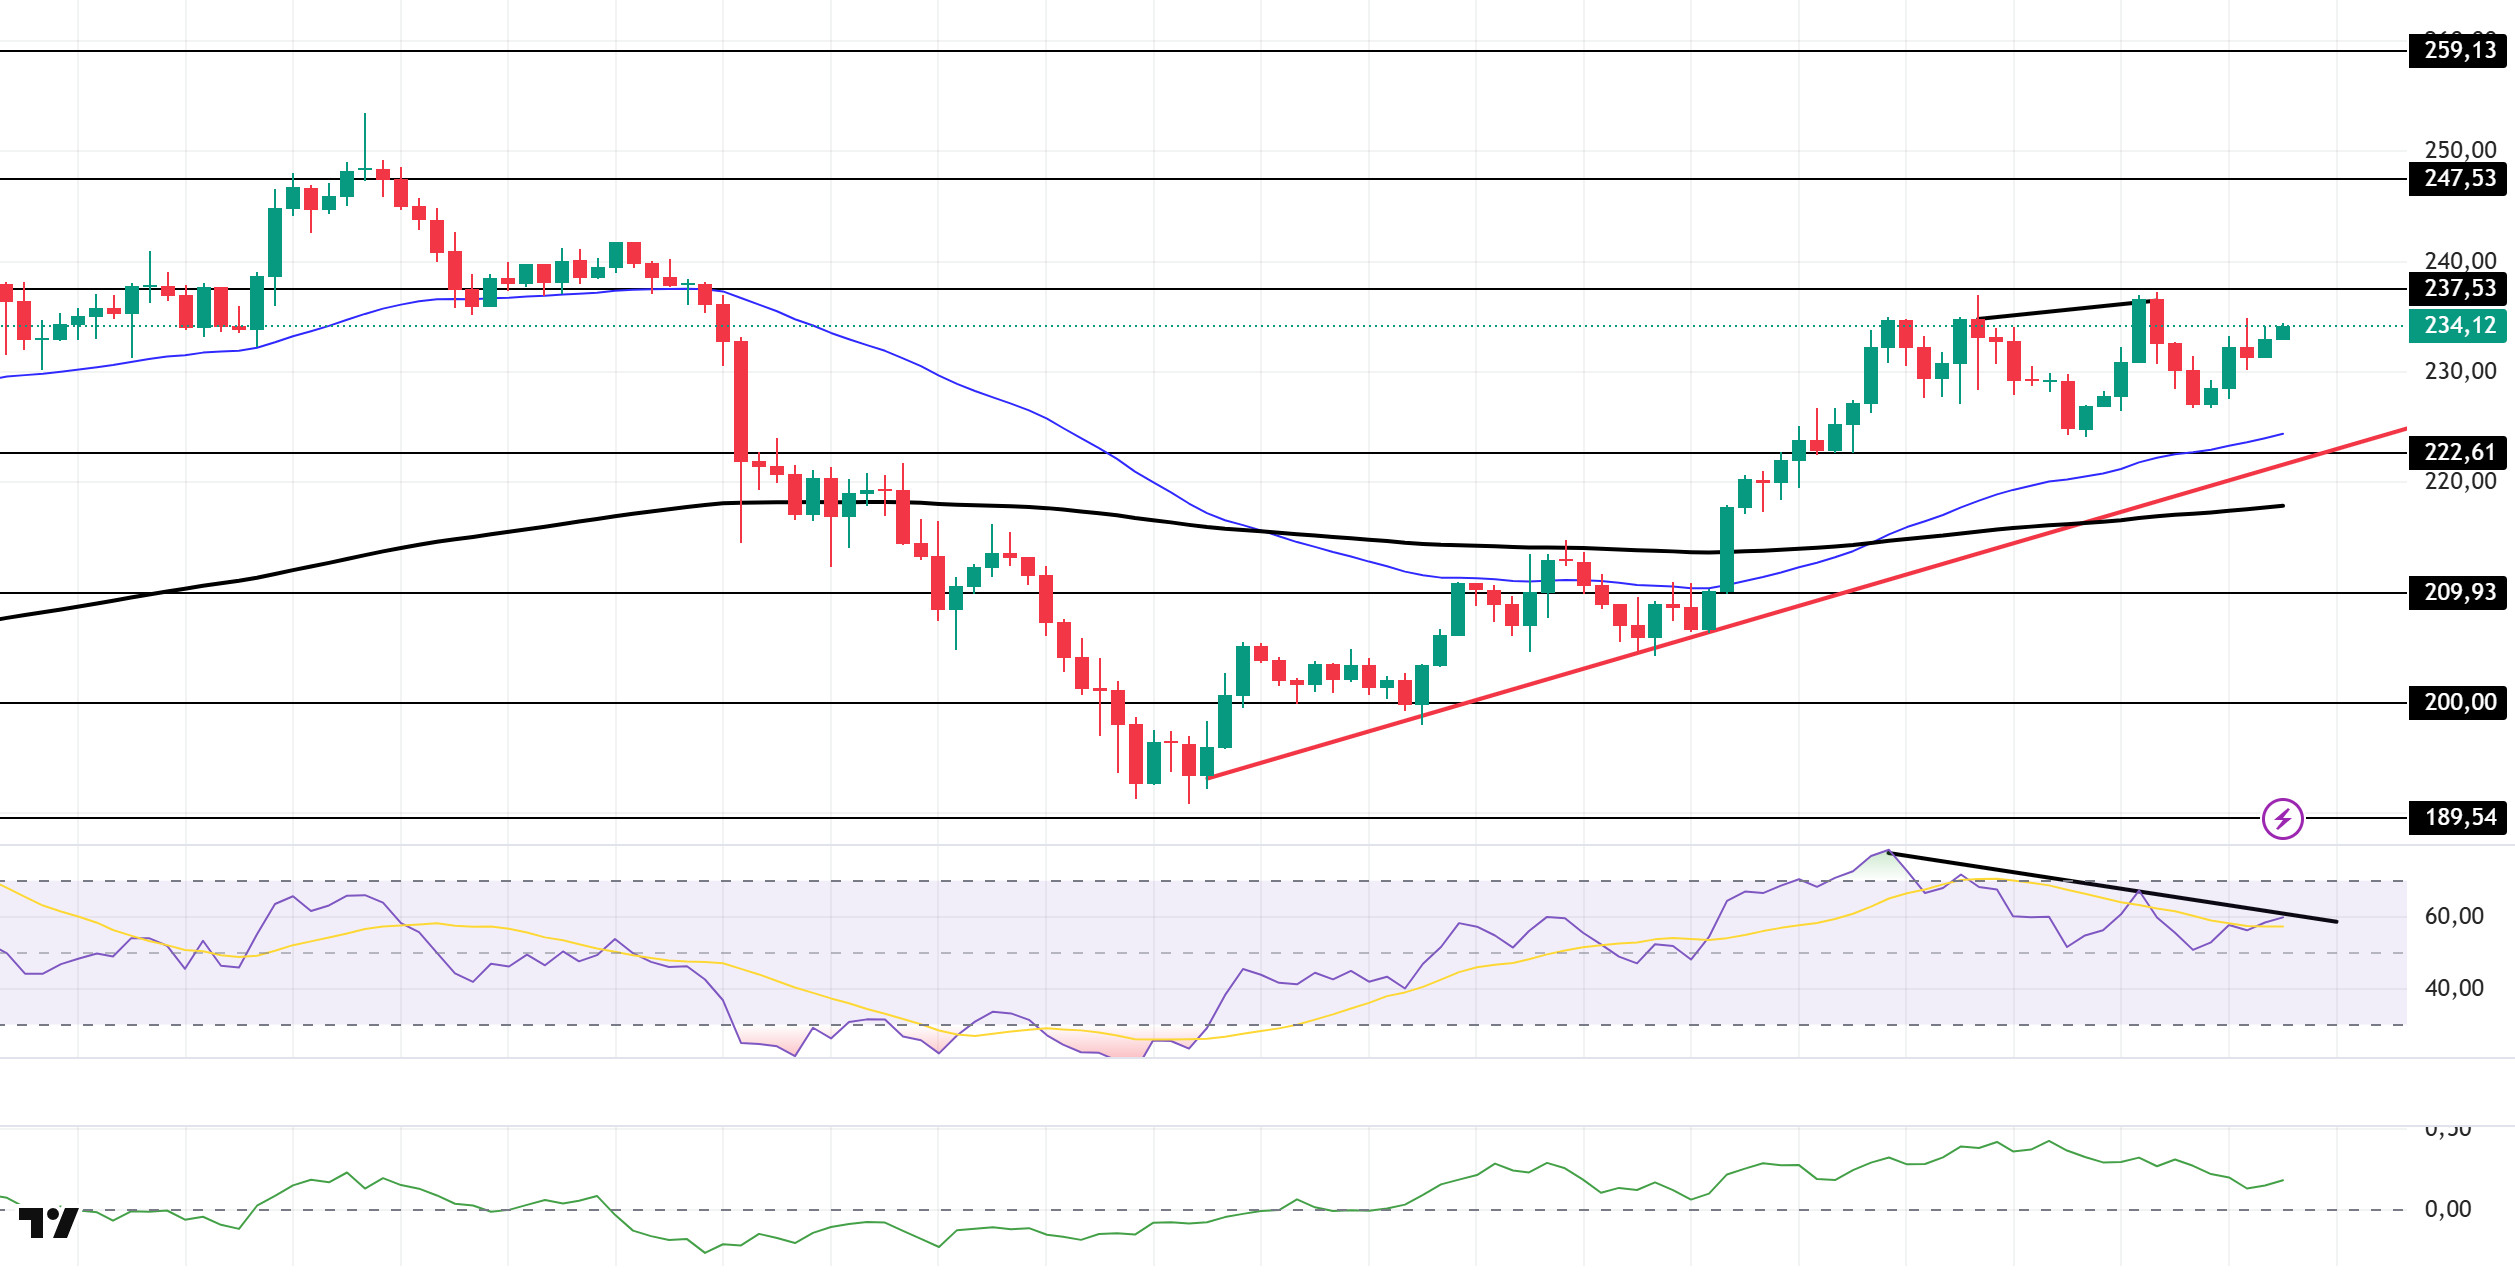
The SOL price showed a slight increase during the day. The asset continues to trade in the upper region of the rising trend that began on September 26. The price, which remains above the 50 EMA (Blue Line) moving average and the 200 EMA (Black Line) moving average, tested the strong resistance level of $237.53 but failed to break through and retreated. As of now, it continues to hold above the strong support level of $222.61, maintaining its momentum. If the upward movement continues, it may retest the $237.53 level. In case of pullbacks, the $209.93 level can be monitored.
On the 4-hour chart, it has started to trade above the 50 EMA (Exponential Moving Average – Blue Line) and 200 EMA (Black Line). This indicates a possible uptrend in the medium term. At the same time, the price being above both moving averages shows us that the asset is trending upward in the short term. The Chaikin Money Flow (CMF-20) remained in positive territory. However, a decrease in money inflows could push the CMF into negative territory. The Relative Strength Index (RSI-14) also remained in positive territory. At the same time, it continued to be in the lower region of the downward trend that began on October 2. This signaled that the downward pressure was continuing. However, it is currently testing this level as resistance. A break above this level could strengthen the uptrend. However, there is a negative divergence, which could deepen the pullback. If the price rises due to macroeconomic data or positive news related to the Solana ecosystem, the $237.53 level stands out as a strong resistance point. If this level is broken upwards, the uptrend is expected to continue. If pullbacks occur due to developments in the opposite direction or profit-taking, the $222.61 level could be tested. If it retreats to these support levels, an increase in buying momentum could present a potential upside opportunity.
Supports: 222.61 – 209.93 – 200.00
Resistances: 237.53 – 247.53 – 259.13
DOGE/USDT
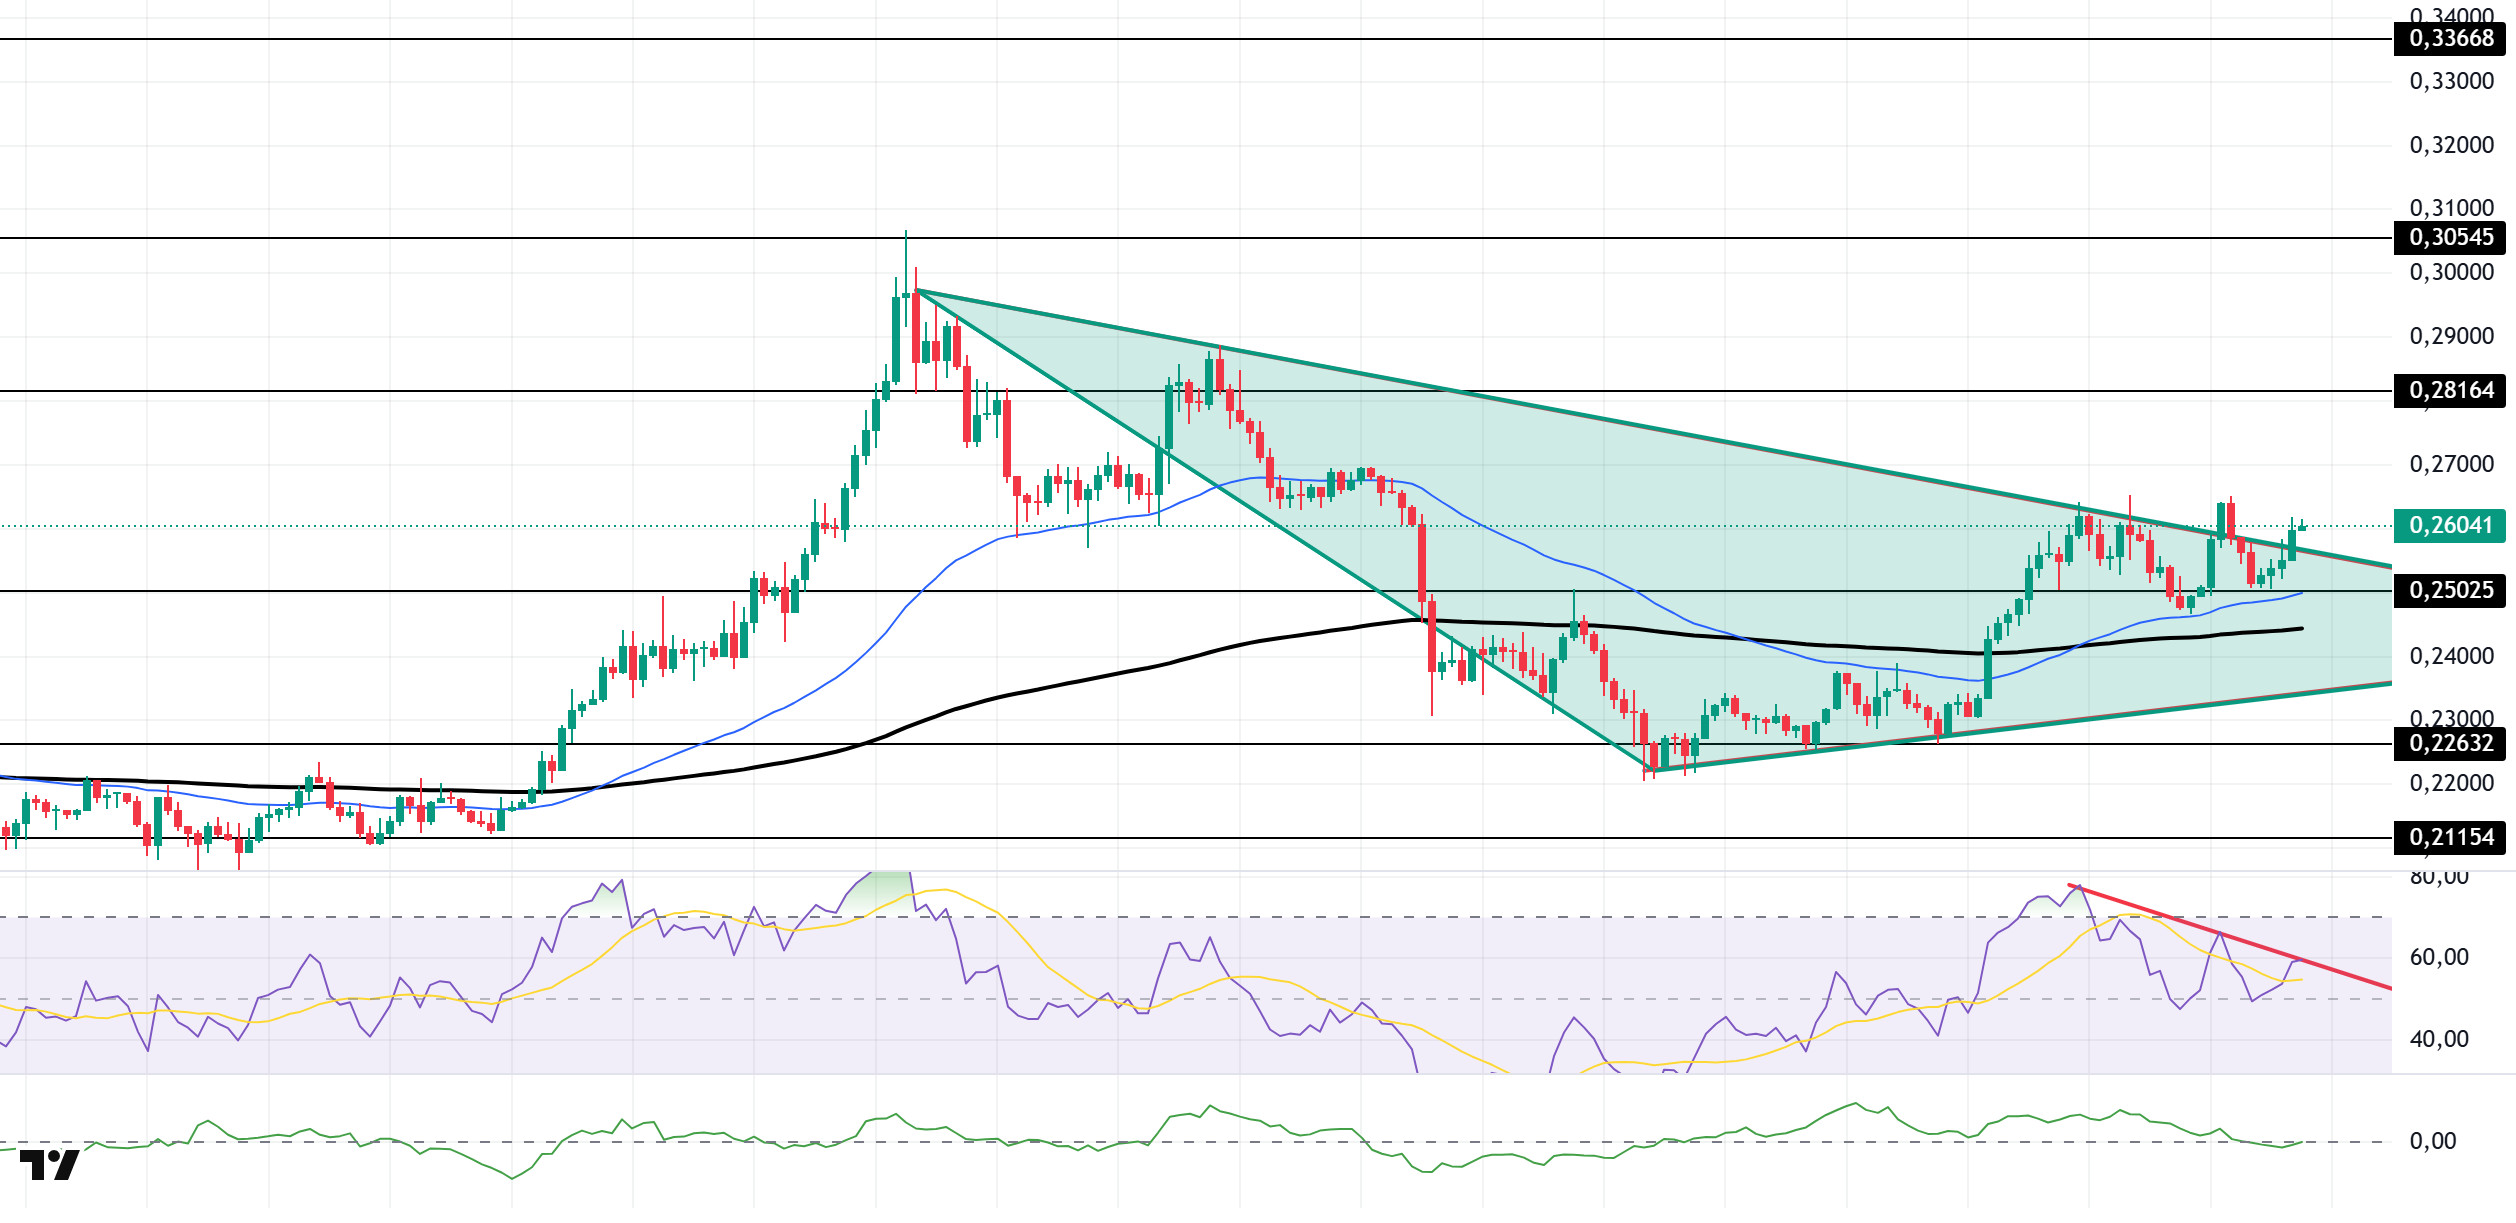
The DOGE price showed an upward trend during the day. The asset broke above the ceiling level of the symmetrical triangle formation that began on September 14, signaling increased buying pressure. Currently maintaining its position above the symmetrical triangle formation, the asset could test the $0.28164 level as resistance if the uptrend continues. In case of a pullback, it could test the $0.22632 level as support if candles close below the moving average.
On the 4-hour chart, the 50 EMA (Exponential Moving Average – Blue Line) remained above the 200 EMA (Black Line). This indicates that an uptrend may begin in the medium term. The price being above both moving averages indicates that the price is bullish in the short term. Chaikin Money Flow (CMF-20) experienced a pullback towards the negative zone. Additionally, a decrease in money inflows could push the CMF deeper into the negative zone. The Relative Strength Index (RSI-14) is currently testing the resistance level that began on October 2. If it breaks above this level, buying pressure may increase. In the event of an uptrend driven by political developments, macroeconomic data, or positive news flow in the DOGE ecosystem, the $0.28164 level stands out as a strong resistance zone. Conversely, in the event of negative news flow, the $0.22632 level could be triggered. A decline to these levels could increase momentum and potentially initiate a new upward wave.
Supports: 0.25025 – 0.22632 – 0.21154
Resistances: 0.28164 – 0.30545 – 0.33668
LTC/USDT
LTC ended the day up 0.79% against USDT, but down 0.1% against Bitcoin. In the futures market, the long/short position ratio fell to 0.9944 in the last 24 hours, indicating a slight downward trend in the expectations of derivatives market participants. Funding rates remain positive but are close to neutral territory. This picture reveals that the upward expectations that dominated the first half of the day in the derivatives markets began to weaken in the second half, but a clear directional expectation has not yet formed.
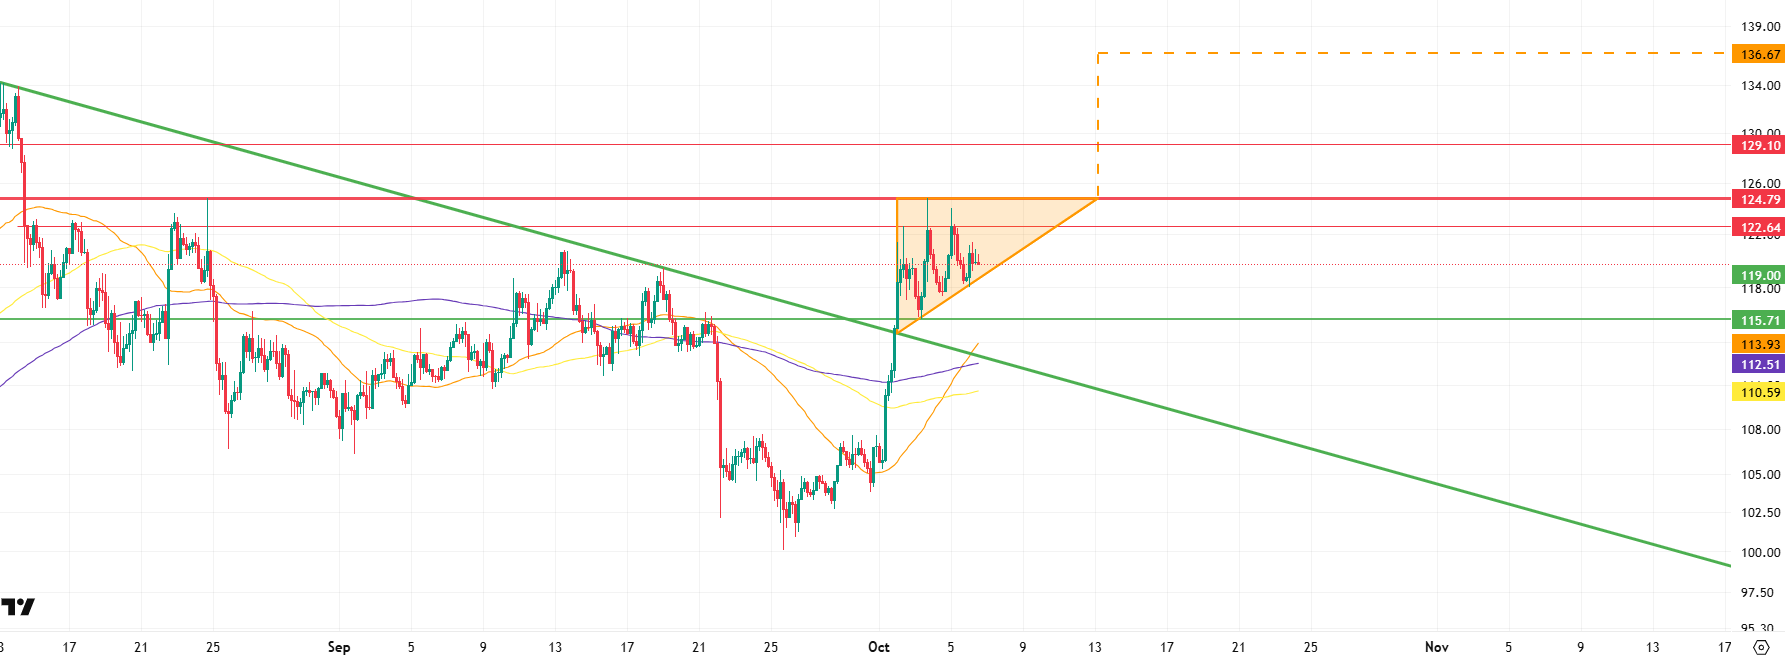
Looking at the technical chart, the chart formation supporting potential upward movements is noteworthy. First, the horizontal resistance level at 122.64 acts as a potential barrier to upward movement. Then, the upper band of the ascending triangle at the 124.79 level emerges as another important resistance point. Breaking the resistance level at 124.79 could complete the ascending triangle formation upward, increasing the potential for movement towards the 136.67 level. However, the first significant test on this journey is expected to be the resistance at the 129.10 level. After a short-term correction at this level, the price could break through and continue its rise towards the target of 136.67.
In possible pullback scenarios, the fact that the previously broken downtrend has not yet been retested indicates that a short-term correction may be on the agenda, even for the healthy continuation of the medium-term uptrend. In this context, the possibility of a pullback towards the 112.51 level, where the 100-period moving average (purple line) passes, should not be overlooked. If such a move begins, the 119.00 level, which is the lower band of the ascending triangle formation, can be considered an intermediate support level. Below this level, the horizontal support at 115.71 stands out as another critical area where the price could consolidate before a possible retest.
Supports: 119.00 – 115.71 – 112.51
Resistances: 122.64 – 124.79 – 129.10
Legal Notice
The investment information, comments, and recommendations contained herein do not constitute investment advice. Investment advisory services are provided individually by authorized institutions taking into account the risk and return preferences of individuals. The comments and recommendations contained herein are of a general nature. These recommendations may not be suitable for your financial situation and risk and return preferences. Therefore, making an investment decision based solely on the information contained herein may not produce results in line with your expectations.


