
Technical Analysis
BTC/USDT
US President Donald Trump has rejected claims of peace talks with Iran, saying he is not interested in negotiations at this stage. Trump emphasized that the deal offered to Iran should be accepted and announced new tariffs on pharmaceuticals. On the other hand, a Fed spokesperson stated that despite the recent improvement in inflation data, a rate cut would have been possible this week if not for the tariff pressure. According to CME FedWatch data, no rate cut is expected tomorrow, while the probability of a rate cut in July is only 14.5%. In the rest of the day, US stock markets, which are preparing for a positive opening, will be followed by the Genius Act vote and Trump’s council meeting.
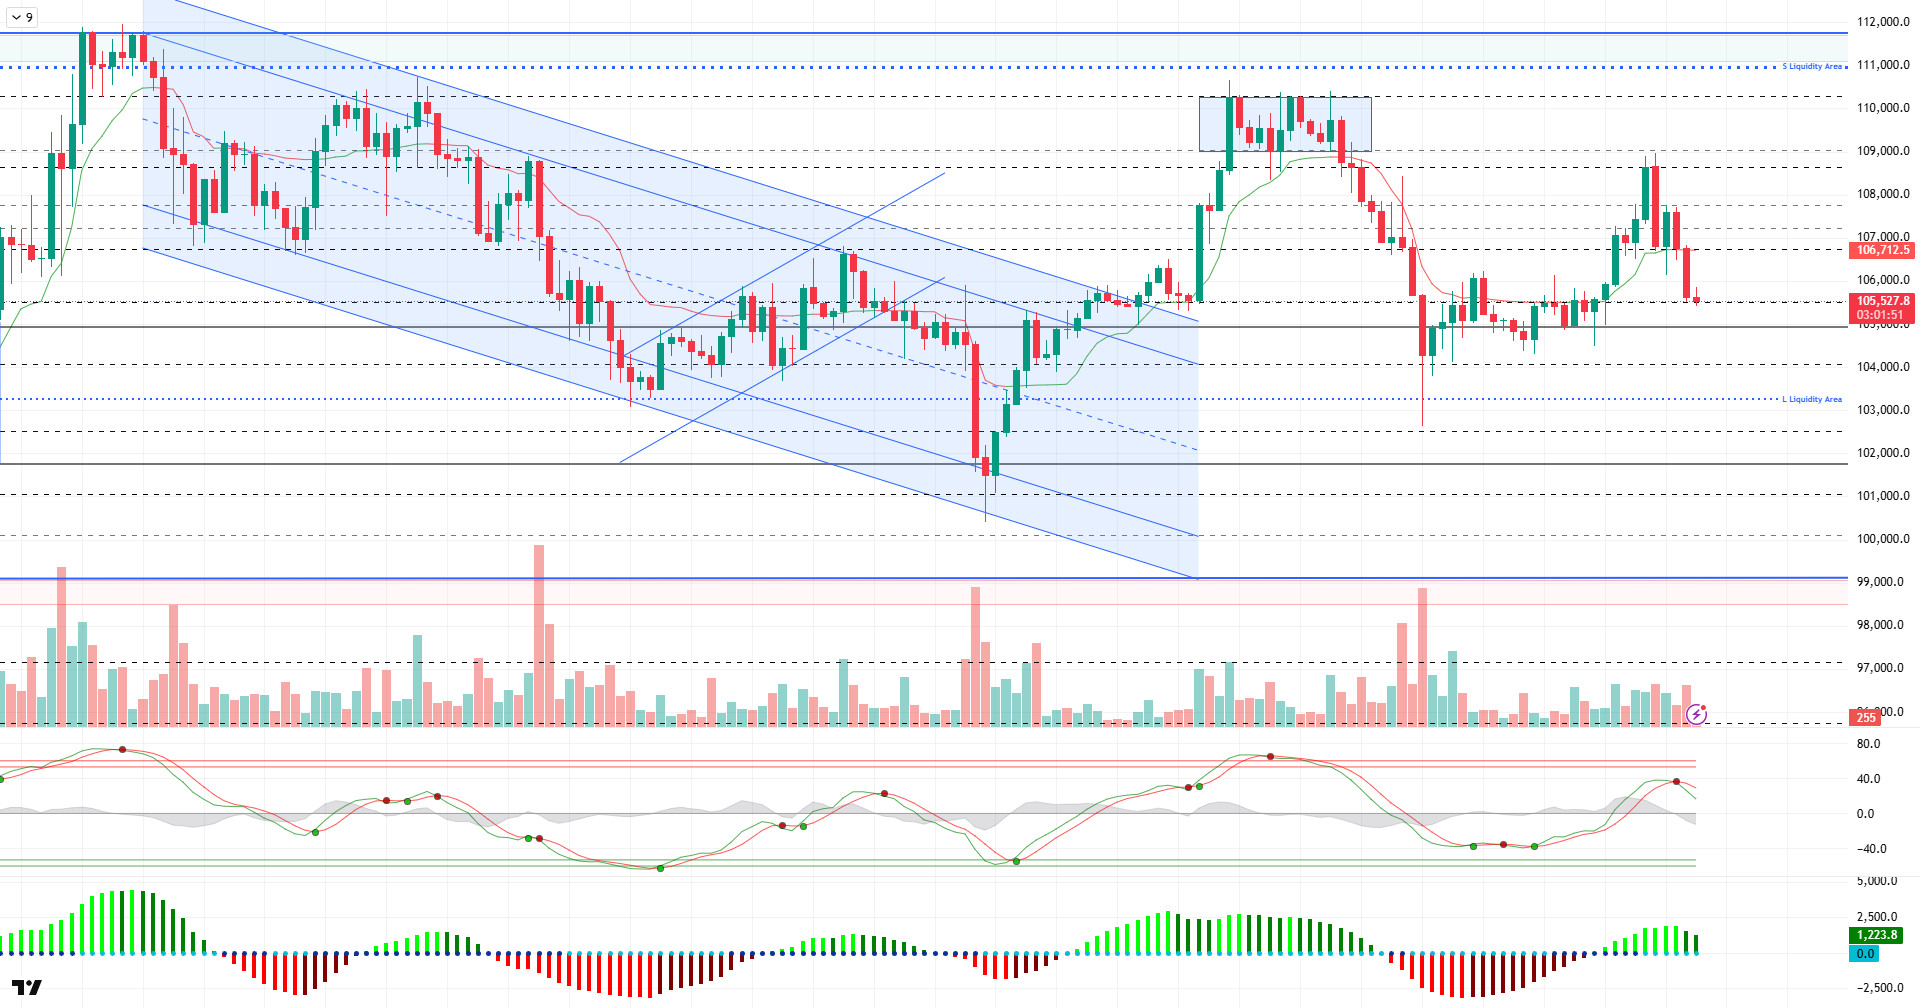
When we look at the technical outlook, it is seen that BTC, under the influence of selling pressure, broke the 106,600 support downwards and fell to 105,500 with a voluminous 4-hour bearish candle. At the time of writing, the price is trading around 105,800 and it is observed that it has encountered a weak reaction in this region.
Technical indicators confirm the bearish move. While the Wave trend oscillator maintains its sell signal, the weakening in the squeeze momentum indicator also supports the bearish trend. Kaufman moving average is positioned above the price at 106,700, indicating that downward pressure continues in technical terms.
Looking at the liquidity data, it is seen that short-term transactions are liquidated with the recent decline. Especially the 105,000 level is critical at this point. Closures below this level may result in the liquidation of long positions totaling 1.27 billion dollars. On the other hand, the liquidation intensity of selling positions is at the level of 538 million dollars.
As a result, both technical indicators and liquidity data continue to support the bearish trend in BTC. The 105,000 level stands out as the most important reference point in this process. If it is broken, it can be expected that the decline will deepen further and liquidations will accelerate. On the other hand, the 106,600 level will be followed as a resistance point in a short-term upside recovery attempt.
Supports 105,500 – 105,000 – 104,000
Resistances 106,600 – 107,300 – 109,000
ETH/USDT
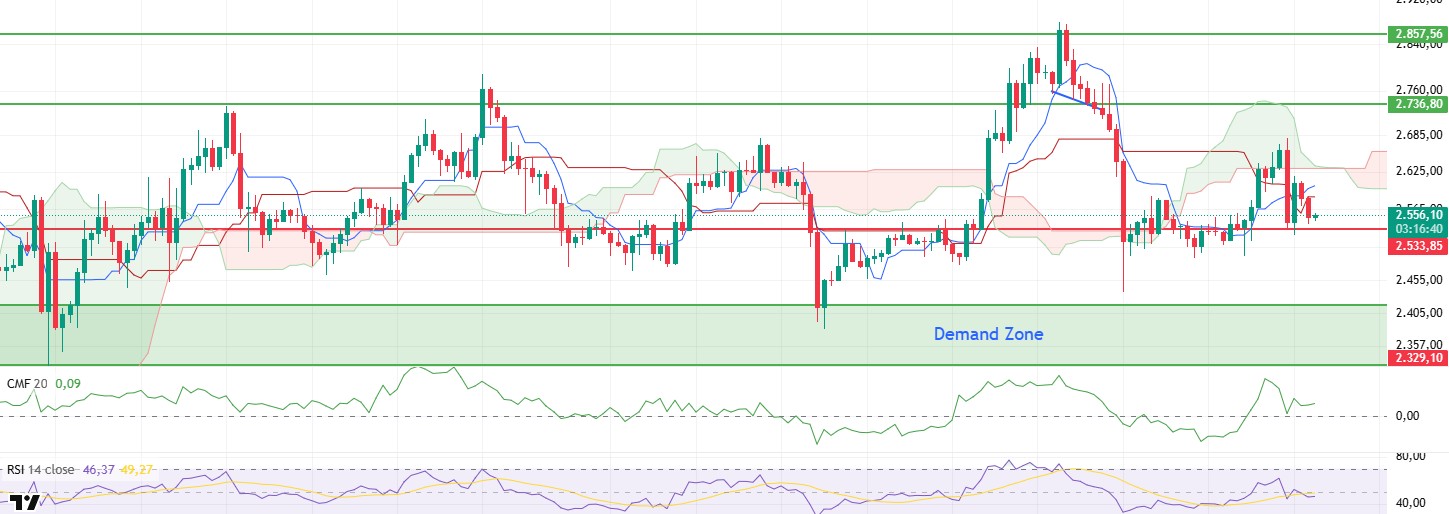
ETH retreated as expected due to the weakness in technical indicators during the day, down to the level of $2,533. This level is considered an important technical threshold both in terms of determining the direction of short-term price movements and to see whether buyers will re-engage. During the retreat, especially on-chain data reveals a remarkable picture.
Analyzing the Cumulative Volume Delta (CVD) data, it is seen that the decline was mainly realized on the futures side. This suggests that the downward movement was mostly driven by leveraged positions and the selling pressure in the spot market remained low. The fact that buyers have not yet left the spot market suggests that the pullback may be short-lived. The fact that the spot side remains balanced despite the decline in futures increases the possibility of a price reaction from these levels.
In addition, the slight increase in the aggregated funding rate in recent hours indicates that market participants continue to hold their positions on the long side. This suggests that the bullish expectation has not completely disappeared, on the contrary, the market is trying to maintain the positive short-term structure. Taken together with this data, it can be said that the market has not fully embraced the downward movement and the potential for an upward correction is still on the table.
The Chaikin Money Flow (CMF) indicator also provides important signals in terms of the liquidity flow in the market. Despite the recent price decline, the fact that CMF remains in positive territory and shows an upward movement indicates that intra-market money inflows continue and buyer pressure is still strong.
In the light of all these data, maintaining the $2,533 level until the close of the day may form the basis for an upward reaction movement in the short term. With the support to be received from this level, it is technically possible for the price to rebound and head towards the upper band of the sand cloud at $ 2,631. This region should also be followed as critical resistance for short-term momentum to gain strength. In the event of persistence above the $2,631 level, the market can be expected to regain momentum and confirm the short-term uptrend. However, a close below the $2,533 support could lead to a further deepening of technical weakness and a gradual retracement of the price to the $2,417-$2,329 range.
Supports 2,533 – 2,329 – 2,130
Resistances 2,736 – 2,857- 3,062
XRP/USDT
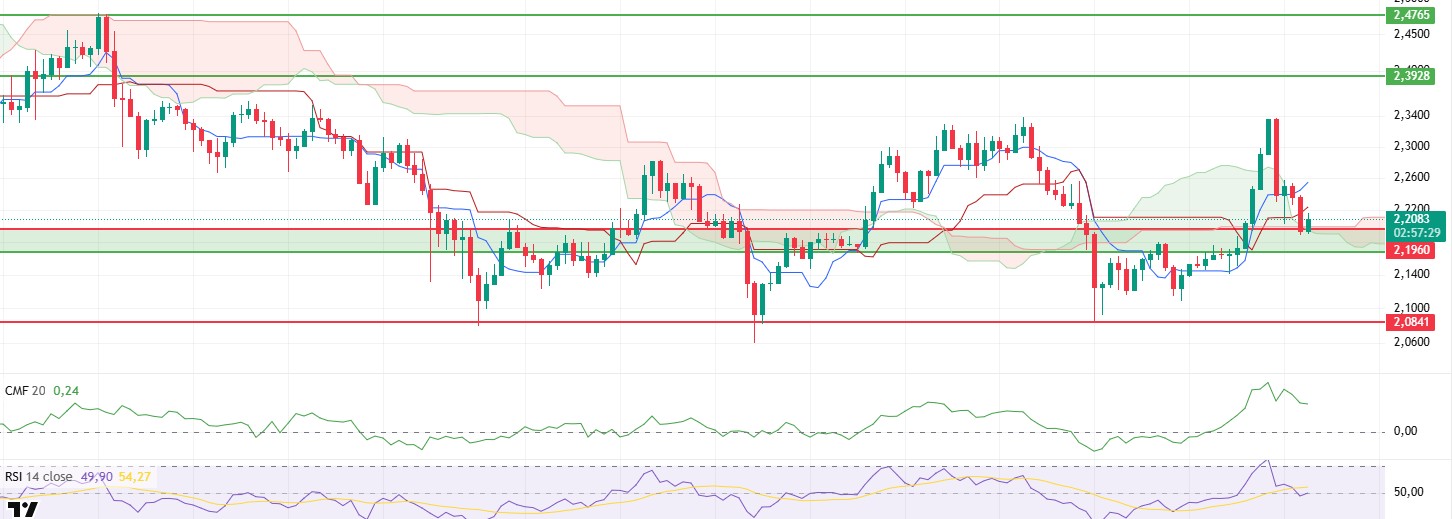
XRP fell to the critically important $2.19 level as selling pressure increased during the day. The fact that the price moved upwards with a limited reaction after approaching this level shows that buyers are still active in this region and the market tends to defend this support point. However, in order for this reaction to gain strength, technical indicators must also give recovery signals.
Although the Chaikin Money Flow (CMF) indicator remains in positive territory, there is a slight weakening in the indicator with the recent pullback. This suggests that some liquidity is flowing out of the market, but buyers have not completely lost the upper hand in terms of the overall structure.
The Relative Strength Index (RSI), on the other hand, accompanied the recent price decline and broke down from the overbought zone and dipped below the based MA line. This suggests that short-term momentum has weakened and buying power has been temporarily lost. This break in the RSI suggests that momentum needs to regain strength in order for the upside reaction to continue.
The Ichimoku indicator shows that the price dipped below both the tenkan and kijun levels and after these losses, it retreated directly to the limits of the kumo cloud. While the kumo cloud acts as a strong support area, especially in the current market uncertainties, it is also an important directional technical structure. Maintaining the cloud boundary may help suppress some of the short-term downside risks. However, closes below this zone may cause the current decline to deepen further and increase selling pressure according to the Ichimoku system.
Supports 2.1960 – 2.0841 – 1.6309
Resistances 2.3928 – 2.4765- 2.5900
SOL/USDT
FTX bought 252,847 Solana (SOL) tokens on a centralized exchange. Pump.fun sold 741 million SOL worth $4.1 million.
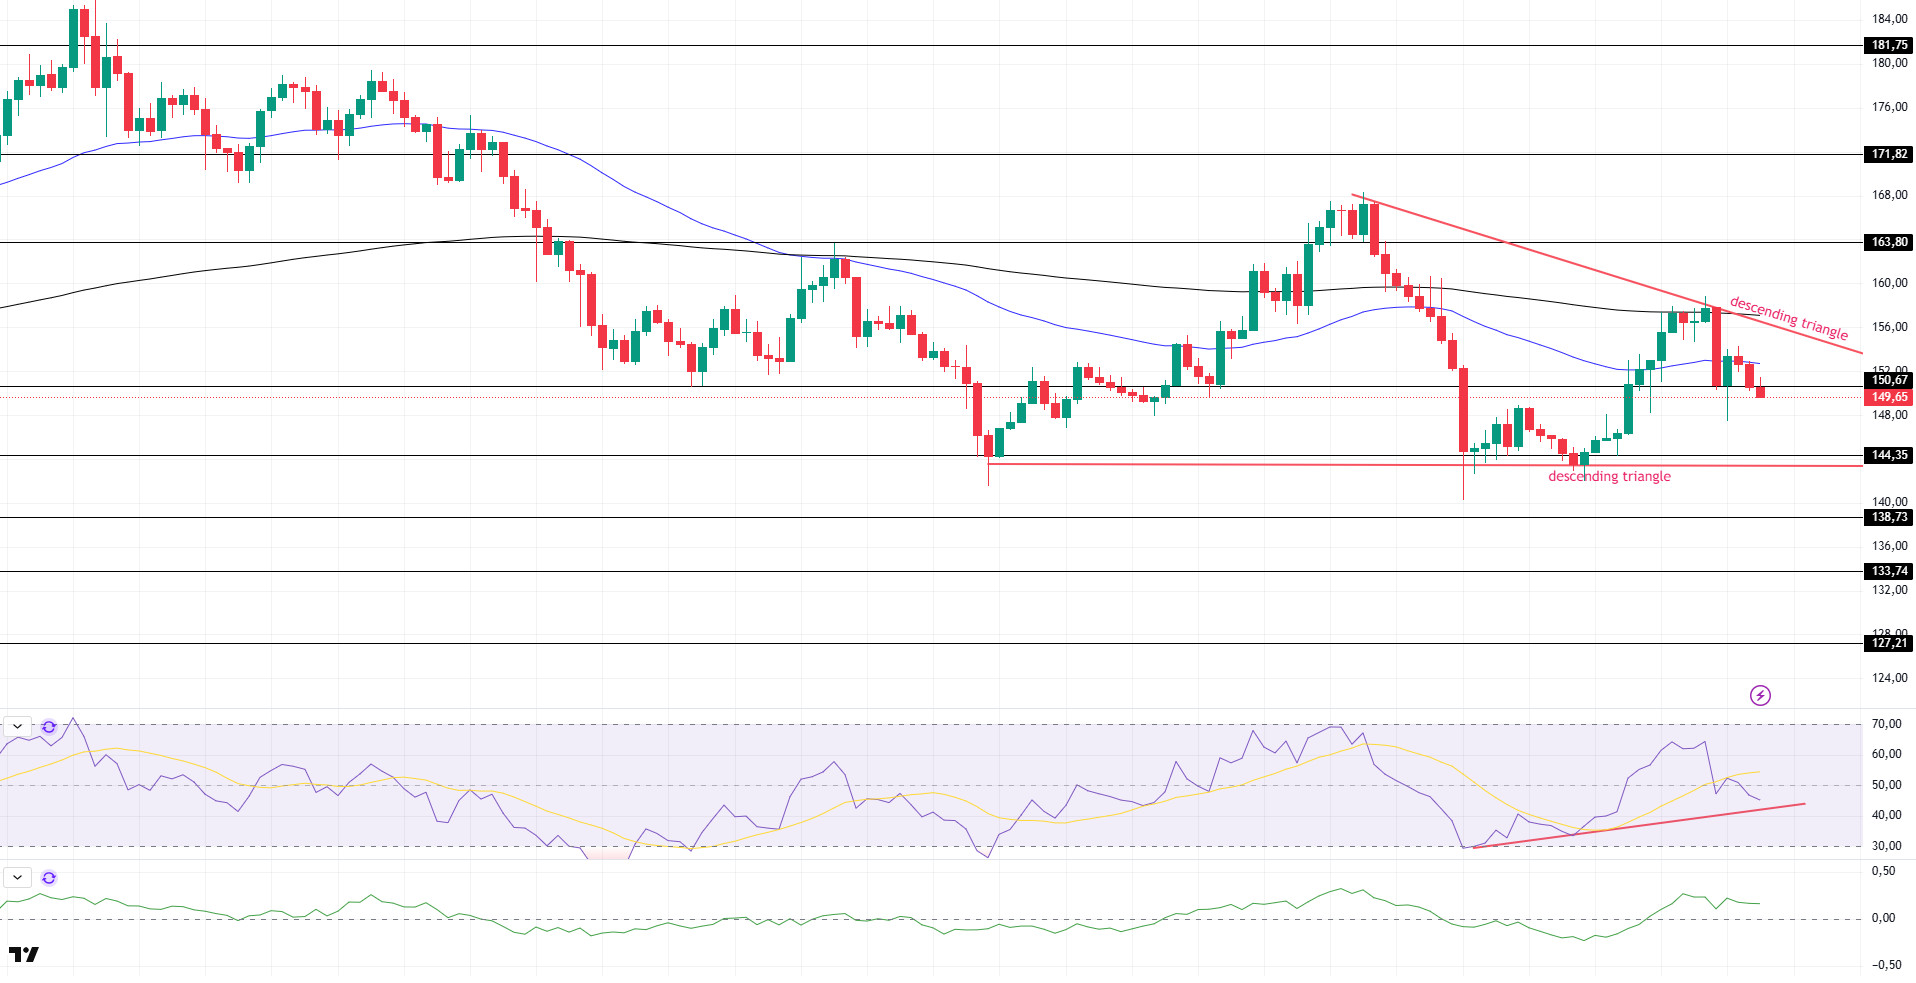
SOL price moved sideways during the day. The asset tested the 50 EMA (Blue Line) moving average, a strong resistance, but failed to break it and retreated. The price found support at the $150.67 level and managed to hold above this important support level with a slight rise from here. Below the 50 EMA moving average, the retracement may continue if the asset fails to break it to the upside. If the upward movement continues, the 200 EMA (Black Line) level, which is a strong resistance, may be triggered. At the same time, a descending triangle pattern has formed.
On the 4-hour chart, the 50 EMA continued to be below the 200 EMA. This suggests that the bearish trend may continue in the medium term. At the same time, the fact that the price is below both moving averages suggests that the market may continue to retrace in the short term at the moment. Chaikin Money Flow (CMF-20) has crossed into positive territory; additionally, a decrease in daily inflows may move CMF into negative territory. Relative Strength Index (RSI-14) moved into negative territory. On the other hand, it remains above the uptrend that started on June 13. The $163.80 level stands out as a strong resistance point in case of an uptrend on the back of macroeconomic data or positive news on the Solana ecosystem. If this level is broken upwards, the rise can be expected to continue. If there are pullbacks due to contrary developments or profit realizations, the $ 144.35 level may be retested. In case of a decline to these support levels, the increase in buying momentum may offer a potential bullish opportunity.
Supports 144.35 – 138.73 – 133.74
Resistances 150.67 – 163.80 – 171.82
DOGE/USDT
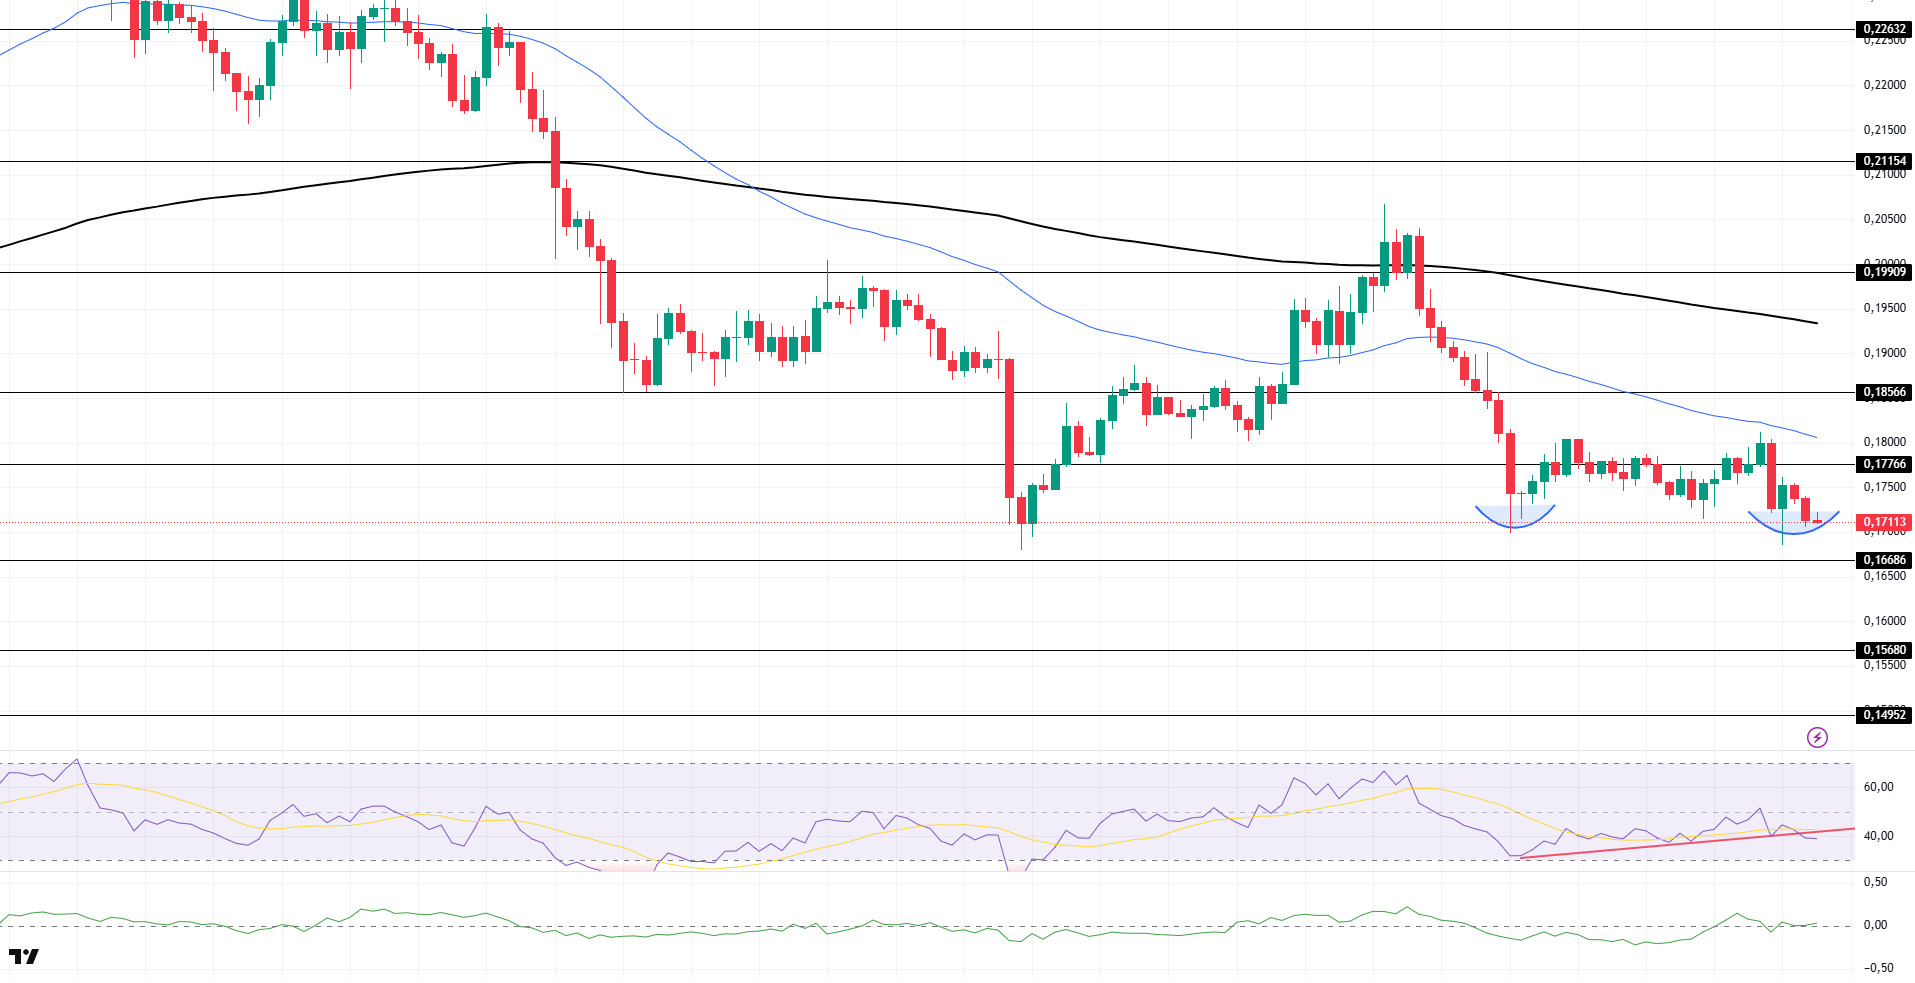
The DOGE price was flat during the day. Unable to break the 50 EMA (Blue Line), the strong resistance, the asset remained below the $0.17766 level. On the other hand, the double bottom formation may be bullish.
On the 4-hour chart, the 50 EMA (Blue Line) continues to be below the 200 EMA (Black Line). This suggests that the asset is bearish in the medium term. The fact that the price is below the two moving averages suggests that the asset remains bearish in the short term. The Chaikin Money Flow (CMF-20) indicator is at a neutral level. In addition, negative money inflows may move CMF into negative territory. Relative Strength Index (RSI-14) continued to be in negative territory. However, it is below the uptrend that has formed since June 13. This may cause the price to fall. The $0.17766 level stands out as a strong resistance zone in case of a rally in line with political developments, macroeconomic data or positive news flow in the DOGE ecosystem. In the opposite case or possible negative news flow, the $0.16686 level may be triggered. In case of a decline to these levels, the increase in momentum may start a new bullish wave.
Supports 0.16686 – 0.15680 – 0.14952
Resistances 0.17766 – 0.18566 – 0.19909
Legal Notice
The investment information, comments and recommendations contained herein do not constitute investment advice. Investment advisory services are provided individually by authorized institutions taking into account the risk and return preferences of individuals. The comments and recommendations contained herein are of a general nature. These recommendations may not be suitable for your financial situation and risk and return preferences. Therefore, making an investment decision based solely on the information contained herein may not produce results in line with your expectations.