Technical Analysis
BTC/USDT
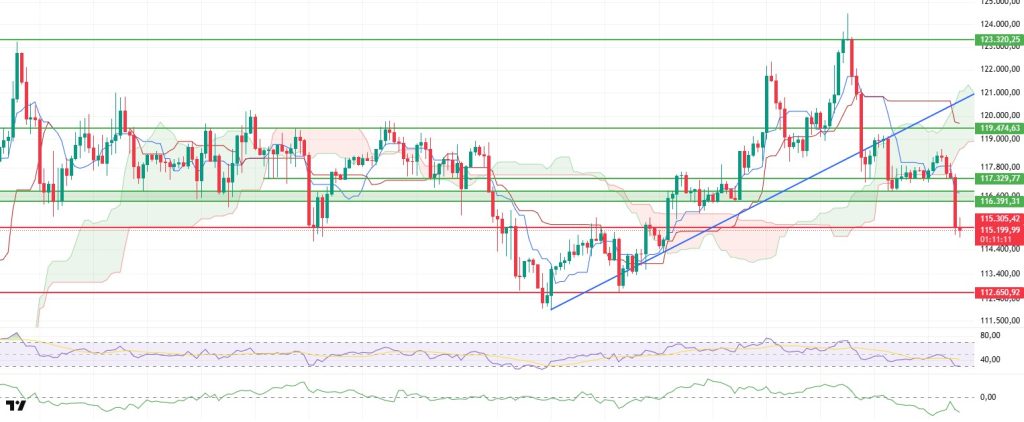
The BTC price extended the pullback it began last Thursday into the weekend, deepening the downtrend. The price retreated to the upper band of the Kumo cloud before falling to the $117,300 level, driven by diminishing momentum. Following the weekly close, the breakdown of this region further accelerated selling pressure, causing the price to drop below the 115,300 dollar level. This outlook indicates that market participants are seeking strong support in the short term and that control of the current trend remains largely in the hands of sellers.
When technical indicators are examined, it can be seen that the Chaikin Money Flow (CMF) indicator continues its downward trend in the negative zone. This indicates a significant outflow of liquidity from the market and highlights that buyers are losing strength. The sharp decline in the Cumulative Volume Delta (CVD) spot indicator further confirms that selling pressure is not only affecting prices but also trading volume, reinforcing the notion that the market is currently under the control of sellers.
The Relative Strength Index (RSI) indicator has fallen to the oversold zone, indicating that the market has entered an oversold region and that momentum loss has become evident. This weak structure of the RSI suggests that the downtrend could deepen further, especially if prices remain below the 115,000 dollar level. In this context, the RSI’s continued stay at low levels makes it challenging for investors to anticipate a strong recovery in the short term.
The Ichimoku indicator also produces signals that support the downward trend. The price falling below the kumo cloud indicates that the market structure is deteriorating, while the tenkan level cutting below the kijun level confirms that the trend has clearly turned negative. This technical outlook strengthens the likelihood that the BTC price will continue its downward movement in the coming days.
When evaluating the overall outlook, both technical indicators and on-chain data confirm BTC’s weakening structure. If the price fails to rise above the $117,320 level, selling pressure is likely to increase further, and the downward movement could continue to the $112,650 level. However, a sustained close above the 117,300 dollar level could reverse the current negative outlook and provide a strong foundation for an upward recovery to begin.
Support levels: 115,188 – 112,650 – 110,936
Resistance levels: 117,329 – 119,474 – 123,320
ETH/USDT
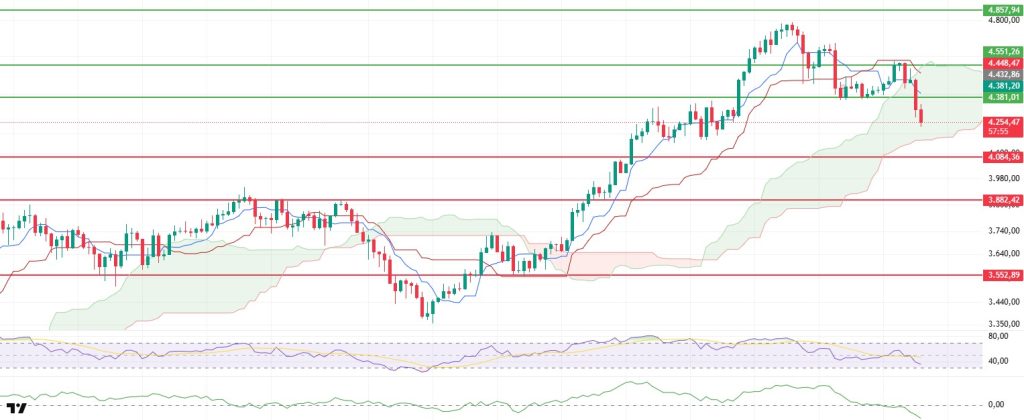
The ETH price entered a downward trend on Friday evening, driven by risk reduction triggered by the liquidation of long positions, particularly in leveraged markets, and a sharp decline in open interest. After testing the $4,381 support level, short-term buying activity pushed the price back up to $4,551. However, sustained selling pressure limited the rally, causing the price to lose momentum and drop below the $4,300 threshold.
On-chain and futures market metrics support weakness. The sharp decline in open interest indicates that existing long positions are being systematically closed, while the downward trend observed in both spot and futures markets on the Cumulative Volume Delta (CVD) confirms that buy order flow has weakened and that the sell side has been aggressive for some time. The Chaikin Money Flow (CMF) indicator’s continued downward movement in the negative zone highlights ongoing net capital outflows and the difficulty of upward reactions in sustaining momentum for now.
From the Ichimoku indicator perspective, the price retreating to the kumo cloud boundaries after losing the tenkan and kijun levels, followed by the tenkan level cutting below the kijun level, confirms the trend reversal with a sell signal. Persistence within or below the kumo cloud increases the risk of short- to medium-term momentum consolidating in the negative zone, while also failing to provide sufficient structure for any rebound rallies to evolve into a strong reversal pattern.
In this context, it seems likely that the price will fall to between the lower limit of the cloud at $4.164 and the main support zone at $4.084. If this band is broken downwards, sales will accelerate with the triggering of stop clusters, and the possibility of a deeper pullback will remain on the table. On the other hand, staying above 4.381 in the short term and then clearly regaining the 4.551 dollar level could be seen as the first structural signals that could reverse the current negative picture. In such a scenario, a return to the Tenkan and Kijun lines could bring the upward trend back into focus. Therefore, short-term strategies should monitor the 4,084–4,164 support corridor and the 4,381–4,551 resistance zone.
Top of Form
Below the Form
Support levels: 4,084 – 3,882 – 3,552
Resistance levels: 4,381 – 4,551 – 4,857
XRP/USDT
There has been a significant development in the ongoing lawsuit between the SEC and Ripple. The parties have submitted official notifications to the court to withdraw their appeals, and the process is currently awaiting approval from the Court of Appeals. If approved, Ripple’s $125 million fine will be finalized, and Judge Torres’ ruling that XRP is not a security in secondary markets will be upheld. This development is seen as critical in reducing the legal uncertainty that has been weighing on investors for some time. Gemini has entered into a $75 million credit agreement with Ripple as part of its initial public offering preparations. The terms of the agreement allow the loan to be increased up to $150 million and include the option to borrow through the RLUSD stablecoin in the future. This move strengthens Ripple’s role in the corporate finance sector and could accelerate the adoption of RLUSD. Wellgistics has launched an XRP Ledger-based payment system in 6,500 US pharmacies. The system is compliant with HIPAA and AML regulations, enabling faster and lower-cost payments in the healthcare sector. The start of XRP’s scaled use in the real economy is seen as a significant step toward the adoption of blockchain technology. On-chain data is sending mixed signals. Over 1.5 million transactions were processed within 24 hours, but the total payment volume dropped to 193 million XRP, indicating a decline in large transfers. The number of active payments fell to 835,000. 93.9% of the circulating supply is in profit, increasing the risk of investors selling for gains.
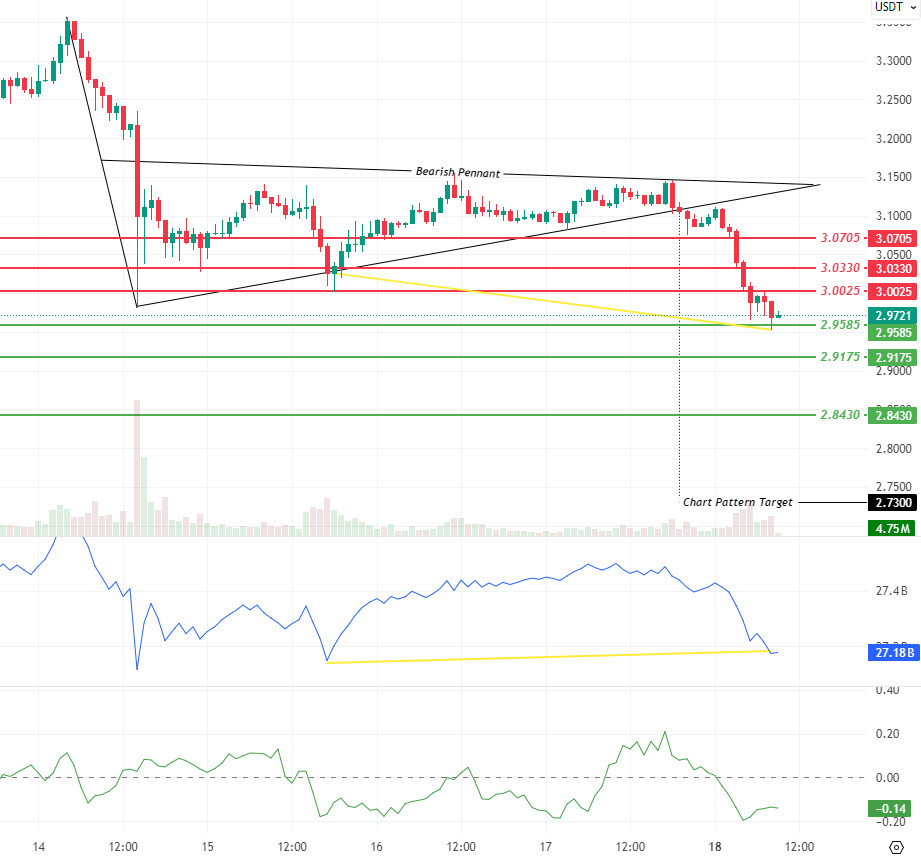
On the technical front, the Bearish Pennant breakout indicated on the chart occurred in a downward direction. The price retreated to $2.9585 during the day and is currently trading at around $2.97. The $3.0025 and $3.0330 range stands out as strong resistance in the short term, and upward attempts may remain limited unless hourly closes above $3.0705 occur. Downward, 2.9585 is the first support level, and a sustained move below this level could bring 2.9175 and 2.8430 into focus. The measured target of the formation points to 2.73, and daily closes below this level could accelerate selling pressure.
The On Balance Volume (OBV) indicator is showing positive divergence (Yellow Line) with the price. While the price is showing a downward break, the OBV is maintaining an upward trend, indicating that buyers are accumulating on the volume side despite selling pressure. This positive divergence stands out as a signal that increases the potential for short-term rebound rallies. The Chaikin Money Flow (CMF) 20-period value is around -0.14, indicating that capital outflows are continuing. Volume became noticeable during the downward breakout candle at 3.0025, and may remain weak unless increasing volume is seen above 3.0025 during potential rebound attempts.
Support levels: 2.9585 – 2.9175 – 2.8430
Resistance levels: 3.0025 – 3.0330 – 3.0705
SOL/USDT
The Solana community is preparing to vote on Alpenglow (SIMD-0326), which could redefine the network’s performance and scalability.
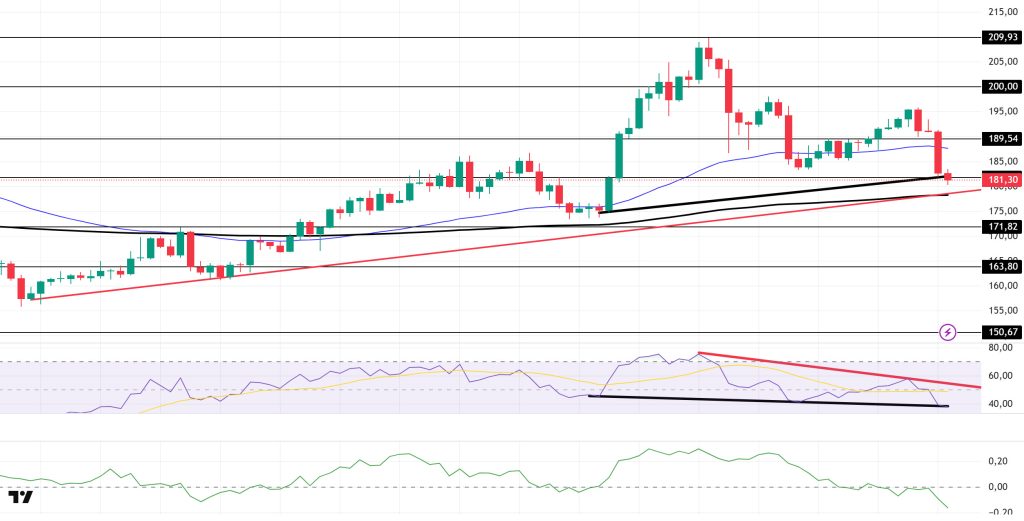
The SOL price continues to decline. The asset has remained above the upward trend line that began on August 2. After breaking through the $189.54 level with a strong candle, the price is currently testing the $181.75 level as support. If the price closes below this level, the upward trend could be tested as support.
On the 4-hour chart, the 50 EMA (Blue Line) remains above the 200 EMA (Black Line). This indicates that the upward trend may continue in the medium term. Additionally, the price being between the two moving averages suggests that the market is in a decision phase in the short term. Chaikin Money Flow (CMF-20) has moved into the negative zone. Additionally, a decrease in money inflows could push the CMF further into the negative zone. The Relative Strength Index (RSI-14) remains below the downward trend that began on August 14. This indicates that selling pressure is continuing. On the other hand, there is a positive divergence. This could bring about an increase. If there is an increase due to macroeconomic data or positive news related to the Solana ecosystem, the $189.54 level stands out as a strong resistance point. If this level is broken upward, the increase is expected to continue. In the event of developments in the opposite direction or profit-taking, pullbacks may occur, testing the 171.82 dollar level. A decline to these support levels could see an increase in buying momentum, presenting a potential opportunity for an upward move.
Support levels: 181.75 – 171.82 – 163.80
Resistance levels: 189.54 – 200.00 – 209.93
DOGE/USDT
Dogecoin Foundation director Timothy Stebbing outlined his vision for RadioDoge, a Dogecoin-based project aimed at improving financial inclusion for unbanked individuals.
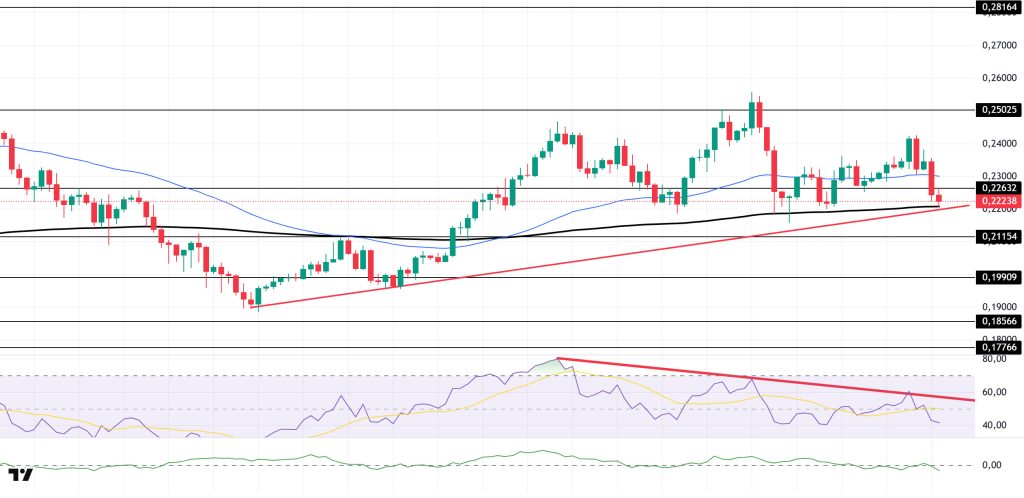
The DOGE price experienced a decline. The asset remains above the upward trend that began on August 2. As of now, the price has broken below the 0.22632 dollar level and is testing the 200 EMA (Black Line) moving average as support. If the price closes below this level, the 0.21154 dollar level should be monitored. In the event of an upward movement, the 50 EMA (Blue Line) moving average should be monitored.
On the 4-hour chart, the 50 EMA (blue line) remains above the 200 EMA (black line). This indicates that the asset is in an upward trend in the medium term. The price being between the two moving averages also indicates that the asset is in a decision-making phase in the short term. The Chaikin Money Flow (CMF-20) has moved into negative territory. Additionally, negative cash inflows could push the CMF further into the negative zone. The Relative Strength Index (RSI-14) remains in the negative zone. It also continues to stay below the downward trend that began on August 9, indicating that selling pressure persists. In the event of any upward movements driven by political developments, macroeconomic data, or positive news flow within the DOGE ecosystem, the $0.25025 level emerges as a strong resistance zone. In the opposite scenario or in the event of negative news flow, the 0.21154 dollar level could be triggered. A decline to these levels could increase momentum and potentially trigger a new upward wave.
Support levels: 0.21154 – 0.19909 – 0.18566
Resistance levels: 0.22632 – 0.25025 – 0.28164
SHIB/USDT
The key development in the Shiba Inu ecosystem this morning was the record increase in the burn rate. Approximately 85.79 million SHIB tokens were burned in the last 24 hours, bringing the burn rate to 83,891%. This extraordinary increase marked one of the strongest burn rate surges of the year and reinforced expectations of a tightening supply in the ecosystem. Additionally, Shibarium’s security-focused partnership with DegenSafe has drawn attention. This collaboration aims to enhance user wallet protection and smart contract security, marking a significant step toward ensuring the long-term reliability of the Shibarium ecosystem.
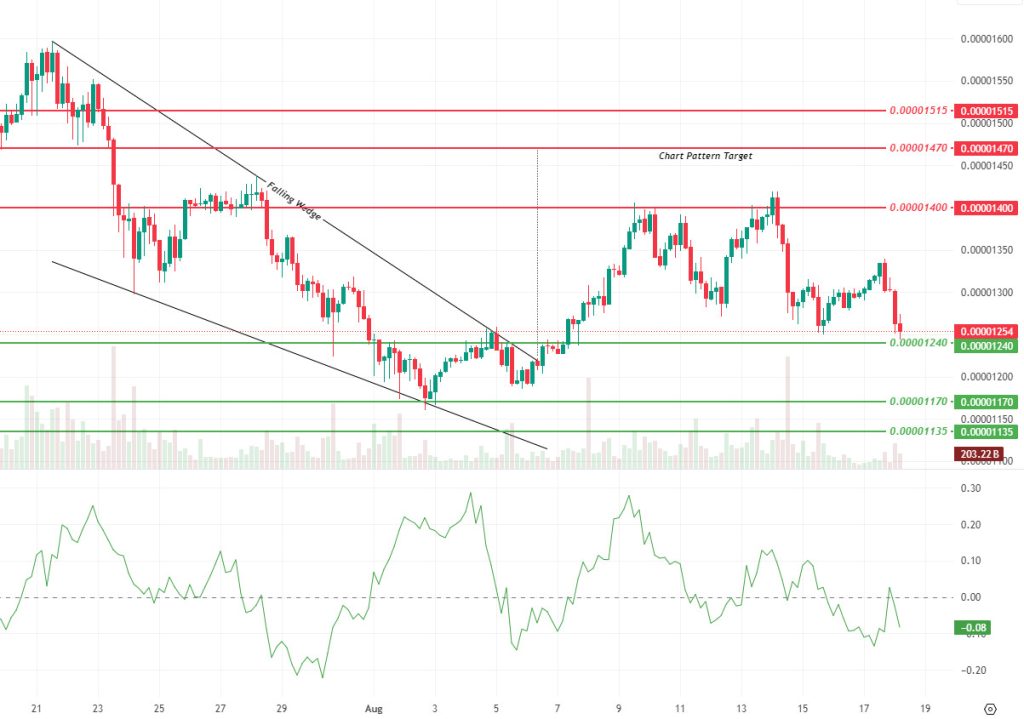
Technically, SHIB broke below the $0.00001270 support level during the day, intensifying downward pressure. Currently, the price is attempting to hold above the $0.00001240 support level. If this level is sustained, the next strong support levels of $0.00001170 and $0.00001135 could come into focus. On the upside, the 0.00001400 dollar level is the first critical resistance level. If this level is broken, 0.00001470 and 0.00001515 dollars could emerge as targets.
The Chaikin Money Flow (CMF) indicator is at -0.08 in the negative zone, indicating that capital outflows are continuing. As we emphasized in our previous analysis, we need to see volume-driven buying to confirm an upward breakout. The Falling Wedge formation that formed starting from July 21 remains valid in the medium term; however, for the price to approach the target level of 0.00001470 dollars, both volume support and closes above the 0.00001400 dollar resistance level are required.
Support levels: 0.00001240 – 0.00001170 – 0.00001135
Resistances: 0.00001400 – 0.00001470 – 0.00001515
LINK/USDT
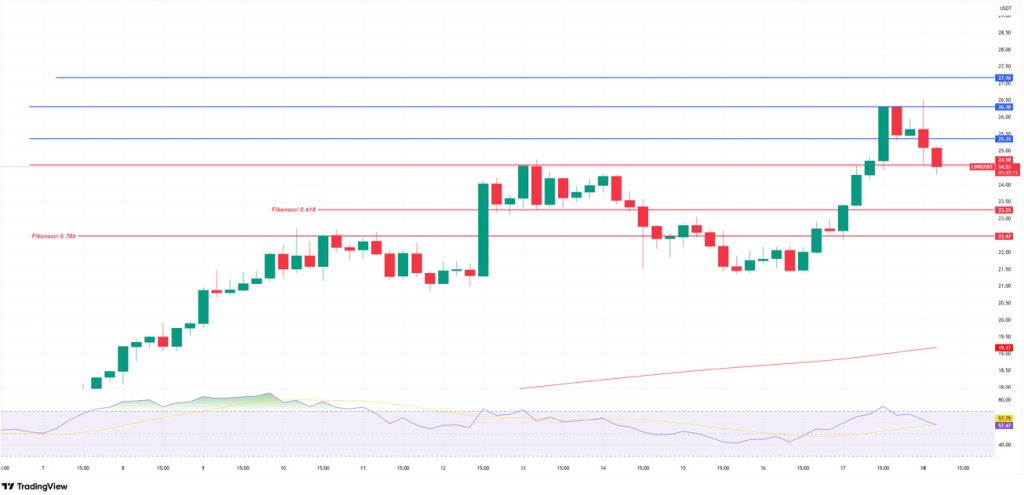
LINK is attempting to stabilize in the $25-26 range after pulling back from the $26.30 level. Sustained trading above $25.35 would indicate that the price is maintaining its recovery momentum. In such a scenario, the price could retest the strong resistance level at $26.30. A breakout above this level with significant volume could bring the 27.16 range into focus, potentially leading to a more aggressive upward price movement as the trend gains momentum.
On the other hand, if the price closes below 25.35, selling pressure is likely to regain momentum. Such a move would initially highlight the 24.58 level, and if this support is broken, the 23.25 and Fibonacci 0.618 retracement level of 22.47 would play a critical role. Although we expect the price to see a strong reaction at this level initially, the most critical area for us will be the 0.786 region. Four-hour closes below this level could create a panic atmosphere and deepen the decline. Therefore, this region stands out as the main defense line for the preservation of the medium-term trend.
The Relative Strength Index (RSI) at 57 levels indicates that buyers still hold the advantage, but recent pullbacks suggest that momentum is weakening. For the upward trend to regain strength, it is critical for the RSI to rise back above the 60 band. Additionally, the price maintaining stability above the 26 dollar level would serve as an important confirmation of buyers’ confidence and the sustainability of the upward movement.
Support levels: 24.58 – 23.25 – 22.47
Resistance levels: 25.35 – 26.30 – 27.16
ADA/USDT
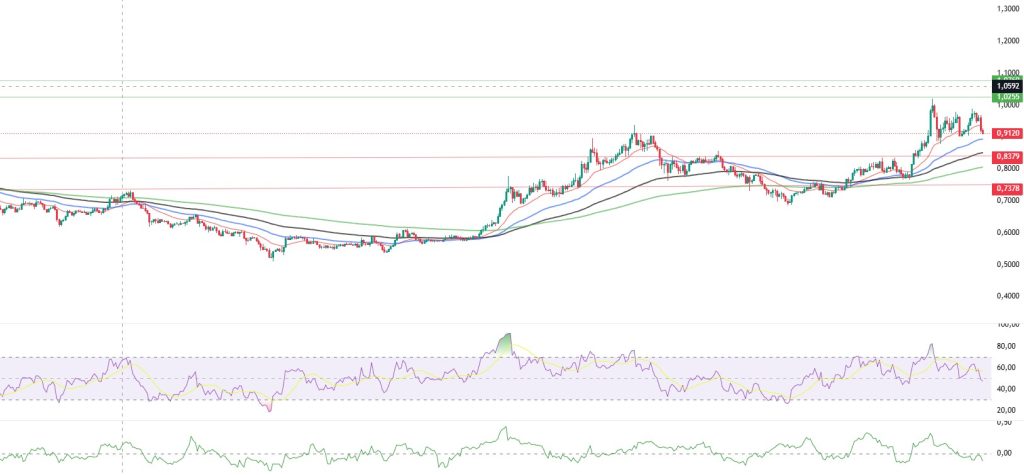
Digital asset management company Grayscale Investments has filed an application for a spot exchange-traded fund for ADA and HBAR in Delaware, USA. With the news and data coming from the US, ADA has formed a flag pattern in the rising channel and identified new resistance points. It reached 1.098 during the day at the close of last week. It continues to move within the horizontal channel band due to selling pressure during the day. After testing the resistance level of 1.0178 from last week, it managed to stay above the 0.9017 level. If it breaks above the upper band of the horizontal channel on the 4-hour chart, it is expected to maintain its position above the 1.0237 level. As long as the price remains within the horizontal channel band of the EMA 20 (Red Line), it may continue its downward trend.
The price remains above the 50 and 100-day Exponential Moving Averages (EMA-Blue Line) and (EMA-Black Line) on the 4-hour chart, indicating that buyers are gaining strength. However, the Relative Strength Index (RSI-14) continues to move near the sell zone by falling to 48 levels, while the Chaikin Money Flow (CMF-20) indicates a possible downtrend signal by dropping to -0.10 levels. The decline in capital inflows could keep the CMF in the horizontal zone and exert a bearish influence. In the event of positive macroeconomic data or news related to the Cardano ecosystem, the $1.0255 level could emerge as a strong resistance point. If the decline begins, the $0.8379 level will be the key support level to monitor.
Supports 0.8444 – 0.8379 – 0.7378
Resistance levels: 1.0255 – 1.0237 – 0.9447
Legal Notice
The investment information, comments, and recommendations contained herein do not constitute investment advice. Investment advisory services are provided individually by authorized institutions taking into account the risk and return preferences of individuals. The comments and recommendations contained herein are of a general nature. These recommendations may not be suitable for your financial situation and risk and return preferences. Therefore, making an investment decision based solely on the information contained herein may not produce results in line with your expectations.


