
Technical Analysis
BTC/USDT
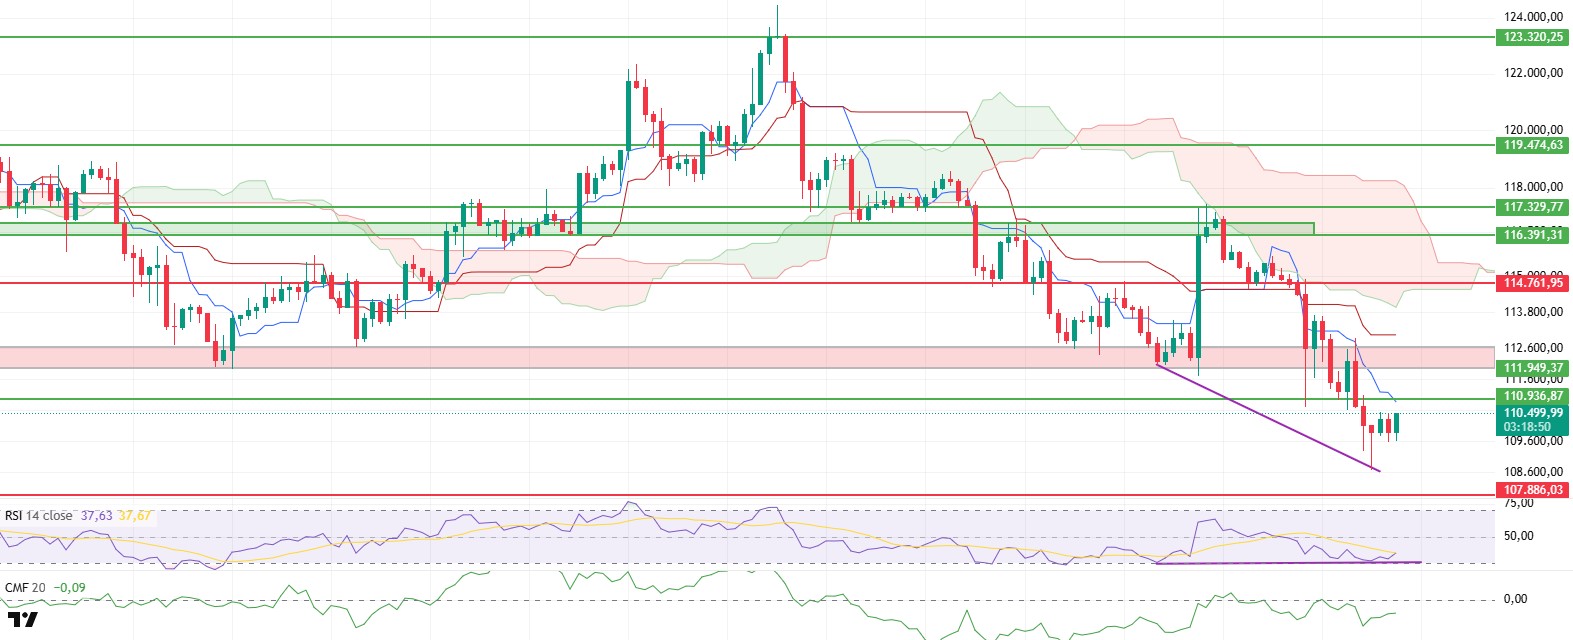
The BTC price moved within a narrow range during the day and stabilized at the $109,800 level. Although the trend remains flat, notable changes in technical indicators and on-chain data stand out. In particular, the volatility in the futures markets is signaling that the price may break out of its current range.
BTC open interest data has started to recover after the recent decline and showed a slight increase. This recovery indicates that market players are starting to reposition themselves, while the rise in the funding fee rate confirms that long positions are beginning to open. This scenario suggests that upward momentum could be supported as the price approaches critical resistance levels.
Although the Chaikin Money Flow (CMF) indicator remains in negative territory, its upward movement during the price’s sideways trend reveals that new liquidity inflows, albeit limited, have begun. Activity on the CMF suggests that the price could respond more strongly if supported by spot purchases.
In the Ichimoku indicator, the tenkan level remaining below the $110.936 resistance zone is noteworthy. If the price breaks above this level, upward momentum is likely to strengthen and the downtrend could be broken. However, the price still remains below both the kumo cloud and the tenkan levels, indicating that the main trend remains negative. This suggests that a strong breakout is needed for upward attempts to be sustainable.
The Relative Strength Index (RSI) shows a slight upward trend, influenced by the previously observed positive divergence, creating a healthier foundation for price increases. The strengthening upward trend in momentum indicators also points to the potential for rapid movement if the price challenges critical levels.
A close above $110,936 during the day could accelerate the upward movement with the break of the downtrend. In a downward scenario, the $107,886 level is a critical key support. Closes below this level could lead to a sharp decline and the market entering a deeper correction.
Support levels: 107.886 – 105.213 – 103.794
Resistance levels: 110,936 – 111,949 – 114,761
ETH/USDT
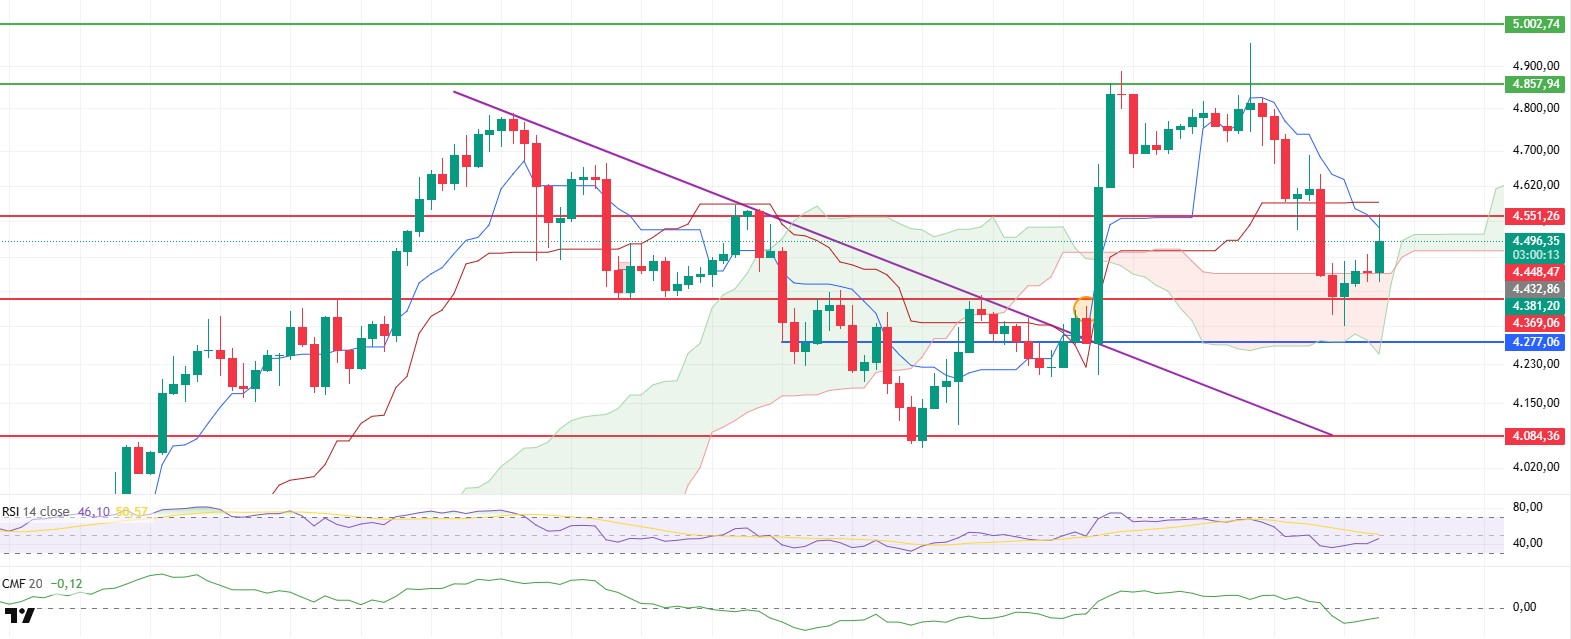
ETH rose to $4,551 as expected, breaking above the kumo cloud during the day. The price is currently attempting to break above this level, and the recovery in indicators shows that buyers are regaining strength in the short term. However, a clear close above this level is necessary for the rally to be sustainable.
In the futures market, the open interest increasing by $1.6 billion after the recent decline and the funding rate rising indicate that long positions are intensifying again. This increase could support the price, but if spot demand is insufficient and the price remains below $4,551, the squeeze on long positions could trigger sharp pullbacks.
The Chaikin Money Flow (CMF) indicator has also started to recover after falling sharply into negative territory, indicating that liquidity is returning to the market. If the CMF continues to trend upward, it could be an important signal for strong price support.
In the Ichimoku indicator, although the tenkan remaining below the kijun signals continued weakness, the price finding support from the kumo cloud indicates that the overall trend maintains a positive outlook. If the price breaks above $4,551 and manages to stay above this level, momentum is expected to accelerate. Otherwise, the price may fall back into the cloud, and the possibility of a deeper correction remains on the table.
The Relative Strength Index (RSI) indicator is also approaching the MA line and moving above the 50 level. This indicates that momentum is gradually gaining strength and could support the price if the resistance zone is broken.
In summary, a sustained break above $4,551 could accelerate the upward movement. If this level cannot be breached, it will be critical for the price to hold within the $4,369 to $4,277 range. If this zone is broken, the declines could be more severe. Closely monitoring open interest and funding rates remains important to understand how strong or fragile the movement is.
Support levels: 4,369 – 4,277 – 4,084
Resistance levels: 4,551 – 4,857 – 5,000
XRP/USDT
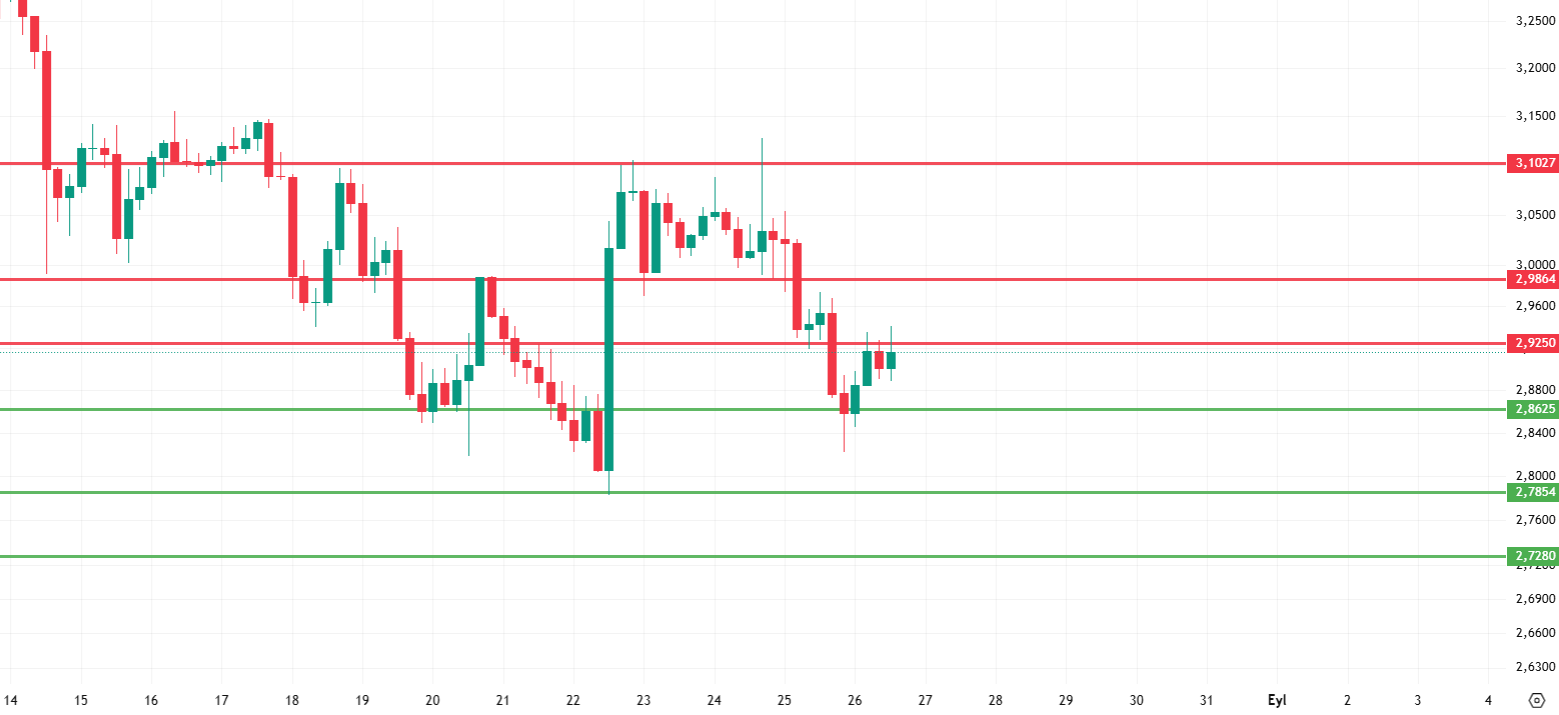
XRP continues to struggle with resistance at the 2.9250 level. Despite two attempts during the day, it has struggled to maintain stability above this level. With XRP stuck in a relatively narrow range, the 2.9250 resistance could contribute to increased downward pressure in the short term.
Failure to break above the 2.9250 level strengthens the downward scenario. At this stage, the 2.8625 level is a critical support level where selling pressure in the market can be countered and upward movements can be encouraged. A significant break below this level could pave the way for a stronger downward trend and a pullback towards the 2.7854 level, which previously acted as one of the lows. As the 2.7854 level stands out as a strong reaction zone, the price reaction at this point will be decisive for the subsequent direction. However, if buyers fail to defend this level, selling pressure could deepen, and XRP could potentially retreat to its next critical support level at 2.7280. In such a scenario, it is crucial that the price does not fall below 2.8625 and then breaks above 2.9250 in order to reduce the risk of testing lower support levels.
In the upward scenario, if the 2.9250 level is breached, the price is expected to accelerate towards the 2.9864 level in the first stage. The 2.9864 level stands out as a strong major resistance point, and the selling pressure encountered in this area is expected to be more intense compared to previous resistance levels. Therefore, the price reaction at this level will be a critical stage that will determine whether the short-term upward momentum can be maintained. If buyers manage to absorb the selling pressure at 2.9864 and sustain the upward momentum, the price is likely to advance to the 3.1027 level within a wide range. The 3.1027 level is an important threshold in the short term, and breaking above this point will boost market confidence, creating positive momentum in both the technical outlook and investor psychology. Such a break could pave the way for a new wave of upward movement in the medium-term trend. However, since the 3.1027 level is a strong resistance zone, the possibility of profit-taking at this point should not be overlooked; the price’s sustainability and the increase in trading volume must be closely monitored.
Supports: 2.8625 – 2.7854 – 2.7280
Resistances: 2.9250 – 2.9864 – 3.1027
SOL/USDT
Pantera Capital has set a target of $1.25 billion to support the Solana treasury initiative.
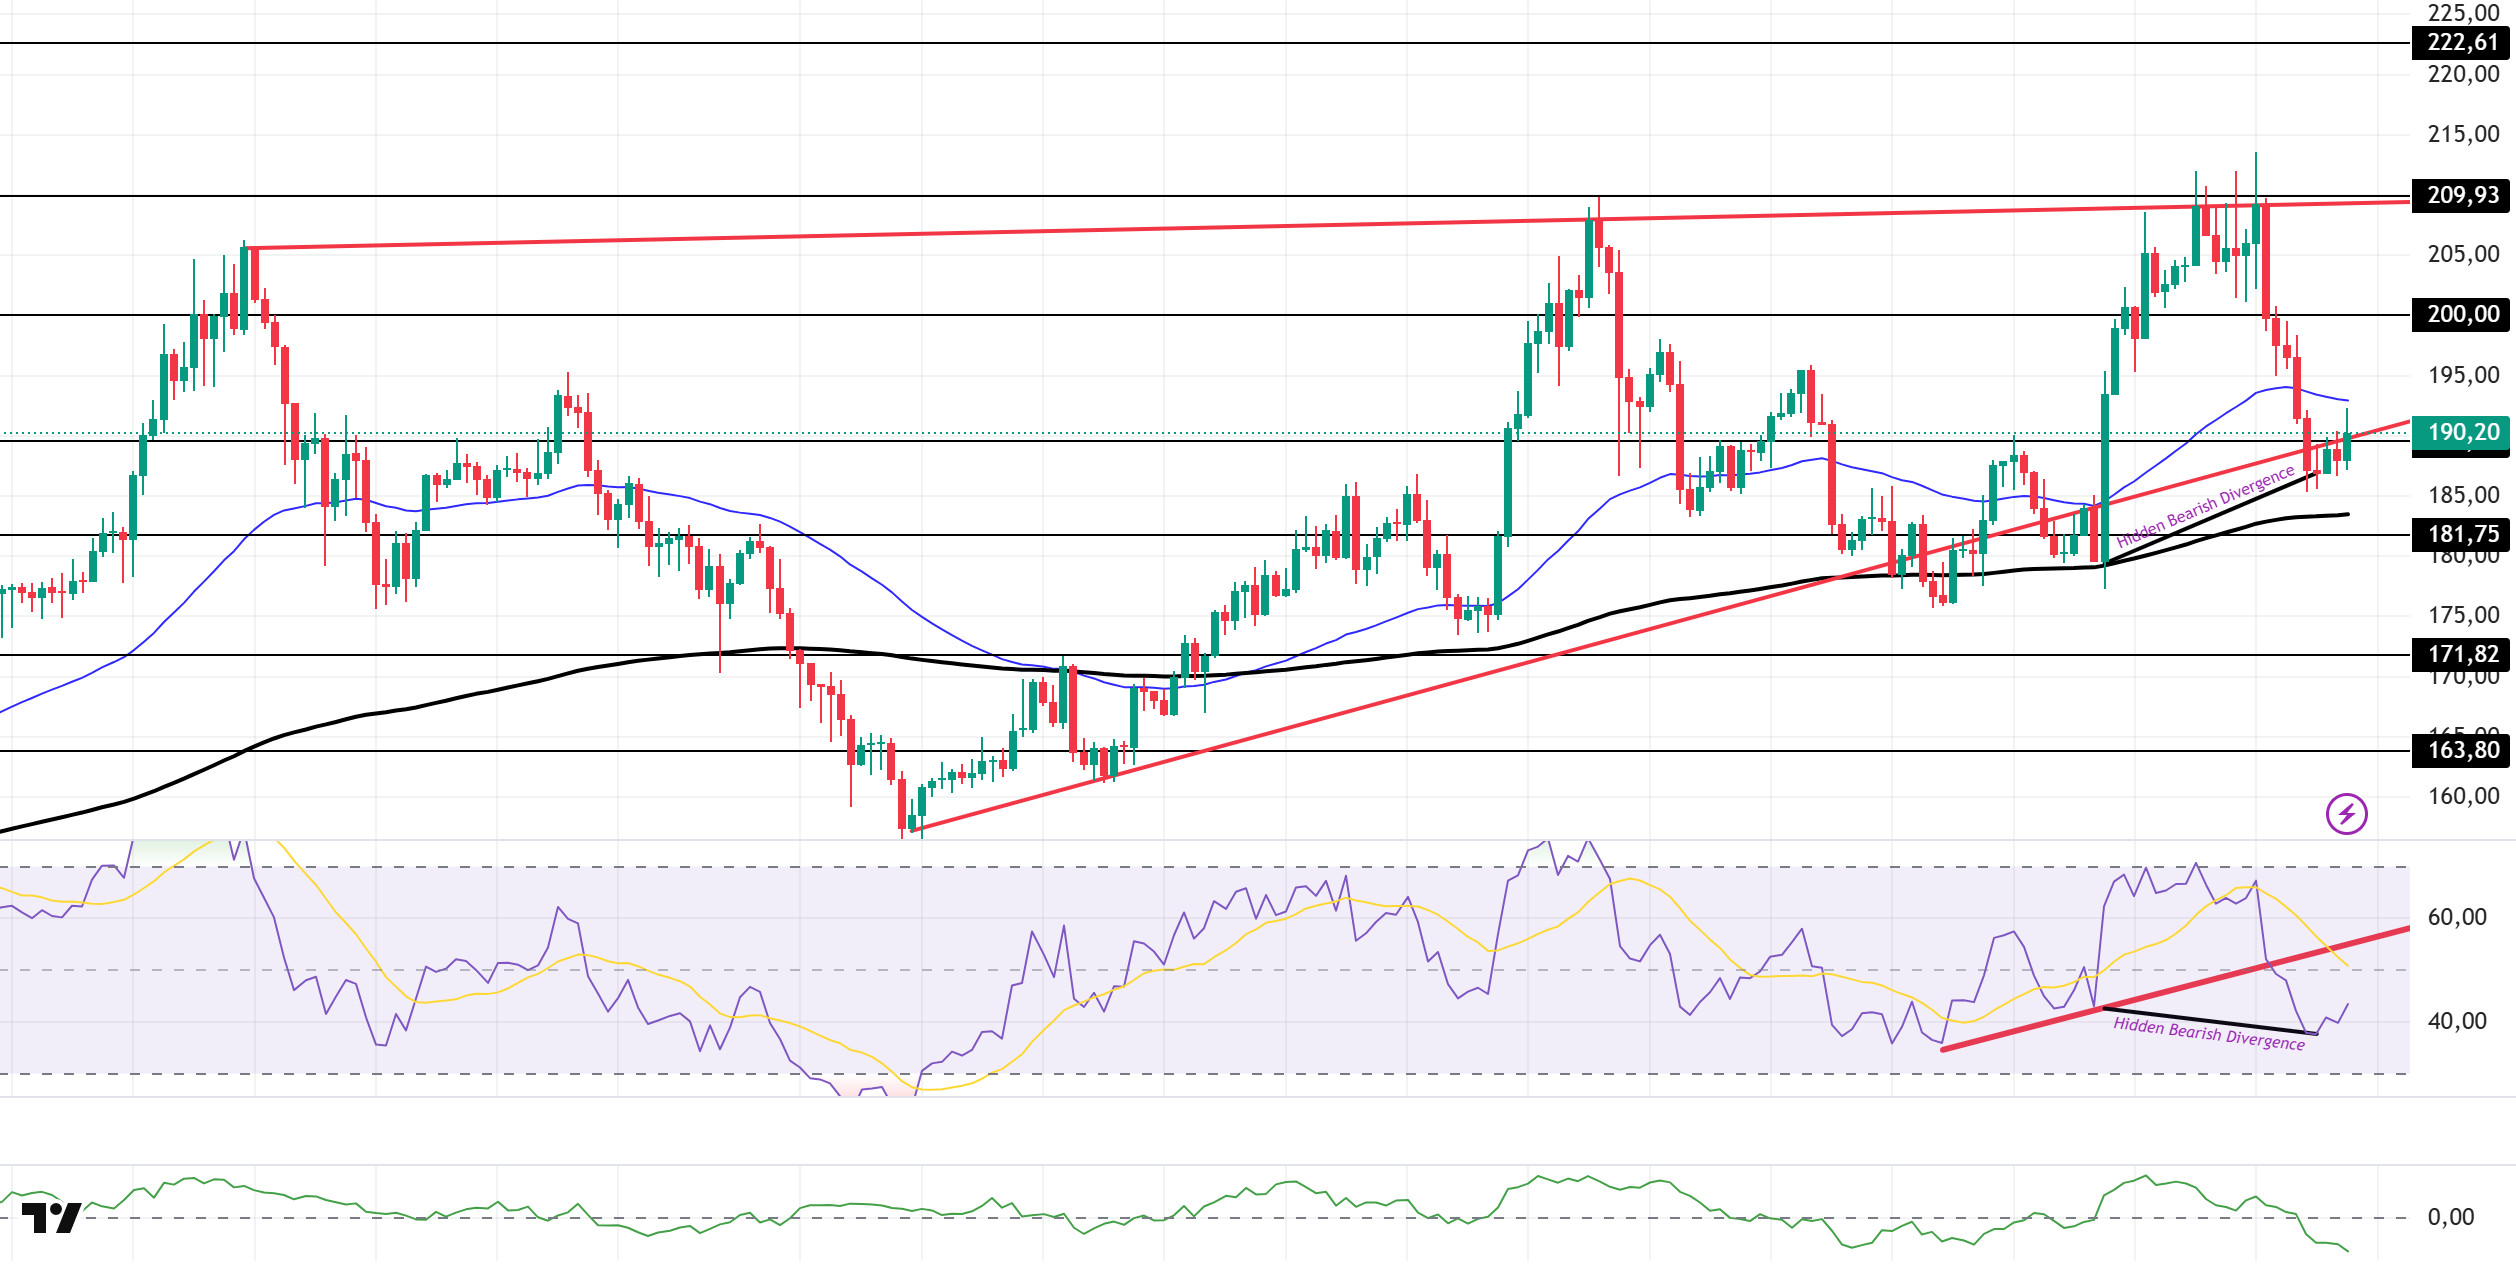
The SOL price traded sideways during the day. The asset remained below the rising wedge formation that began on August 2 and the strong support level of $189.54. Currently testing the base level of the ascending wedge formation, the price could test the 200 EMA (Exponential Moving Average – Black Line) moving average if the pullback continues. If the uptrend resumes, it could retest the $200.00 level as resistance.
On the 4-hour chart, the 50 EMA (Blue Line) remained above the 200 EMA (Black Line). This indicates that the medium-term upward trend may continue. At the same time, the price being between the two moving averages shows us that the market is in a decision phase in the short term. The Chaikin Money Flow (CMF-20) remained in negative territory. However, an increase in money inflows could push the CMF to the upper levels of the negative zone. The Relative Strength Index (RSI-14) continues to trade below the upward trend that began on August 19. This indicates that selling pressure persists. However, positive divergence could bring an uptrend. In the event of an uptrend driven by macroeconomic data or positive news related to the Solana ecosystem, the $200.00 level stands out as a strong resistance point. If this level is broken upwards, the uptrend is expected to continue. In the event of pullbacks due to developments in the opposite direction or profit-taking, the $181.75 level could be tested. A decline to these support levels could increase buying momentum, presenting a potential opportunity for an upward move.
Supports: 181.75 – 171.82 – 163.80
Resistances: 189.54 – 200.00 – 209.93
DOGE/USDT
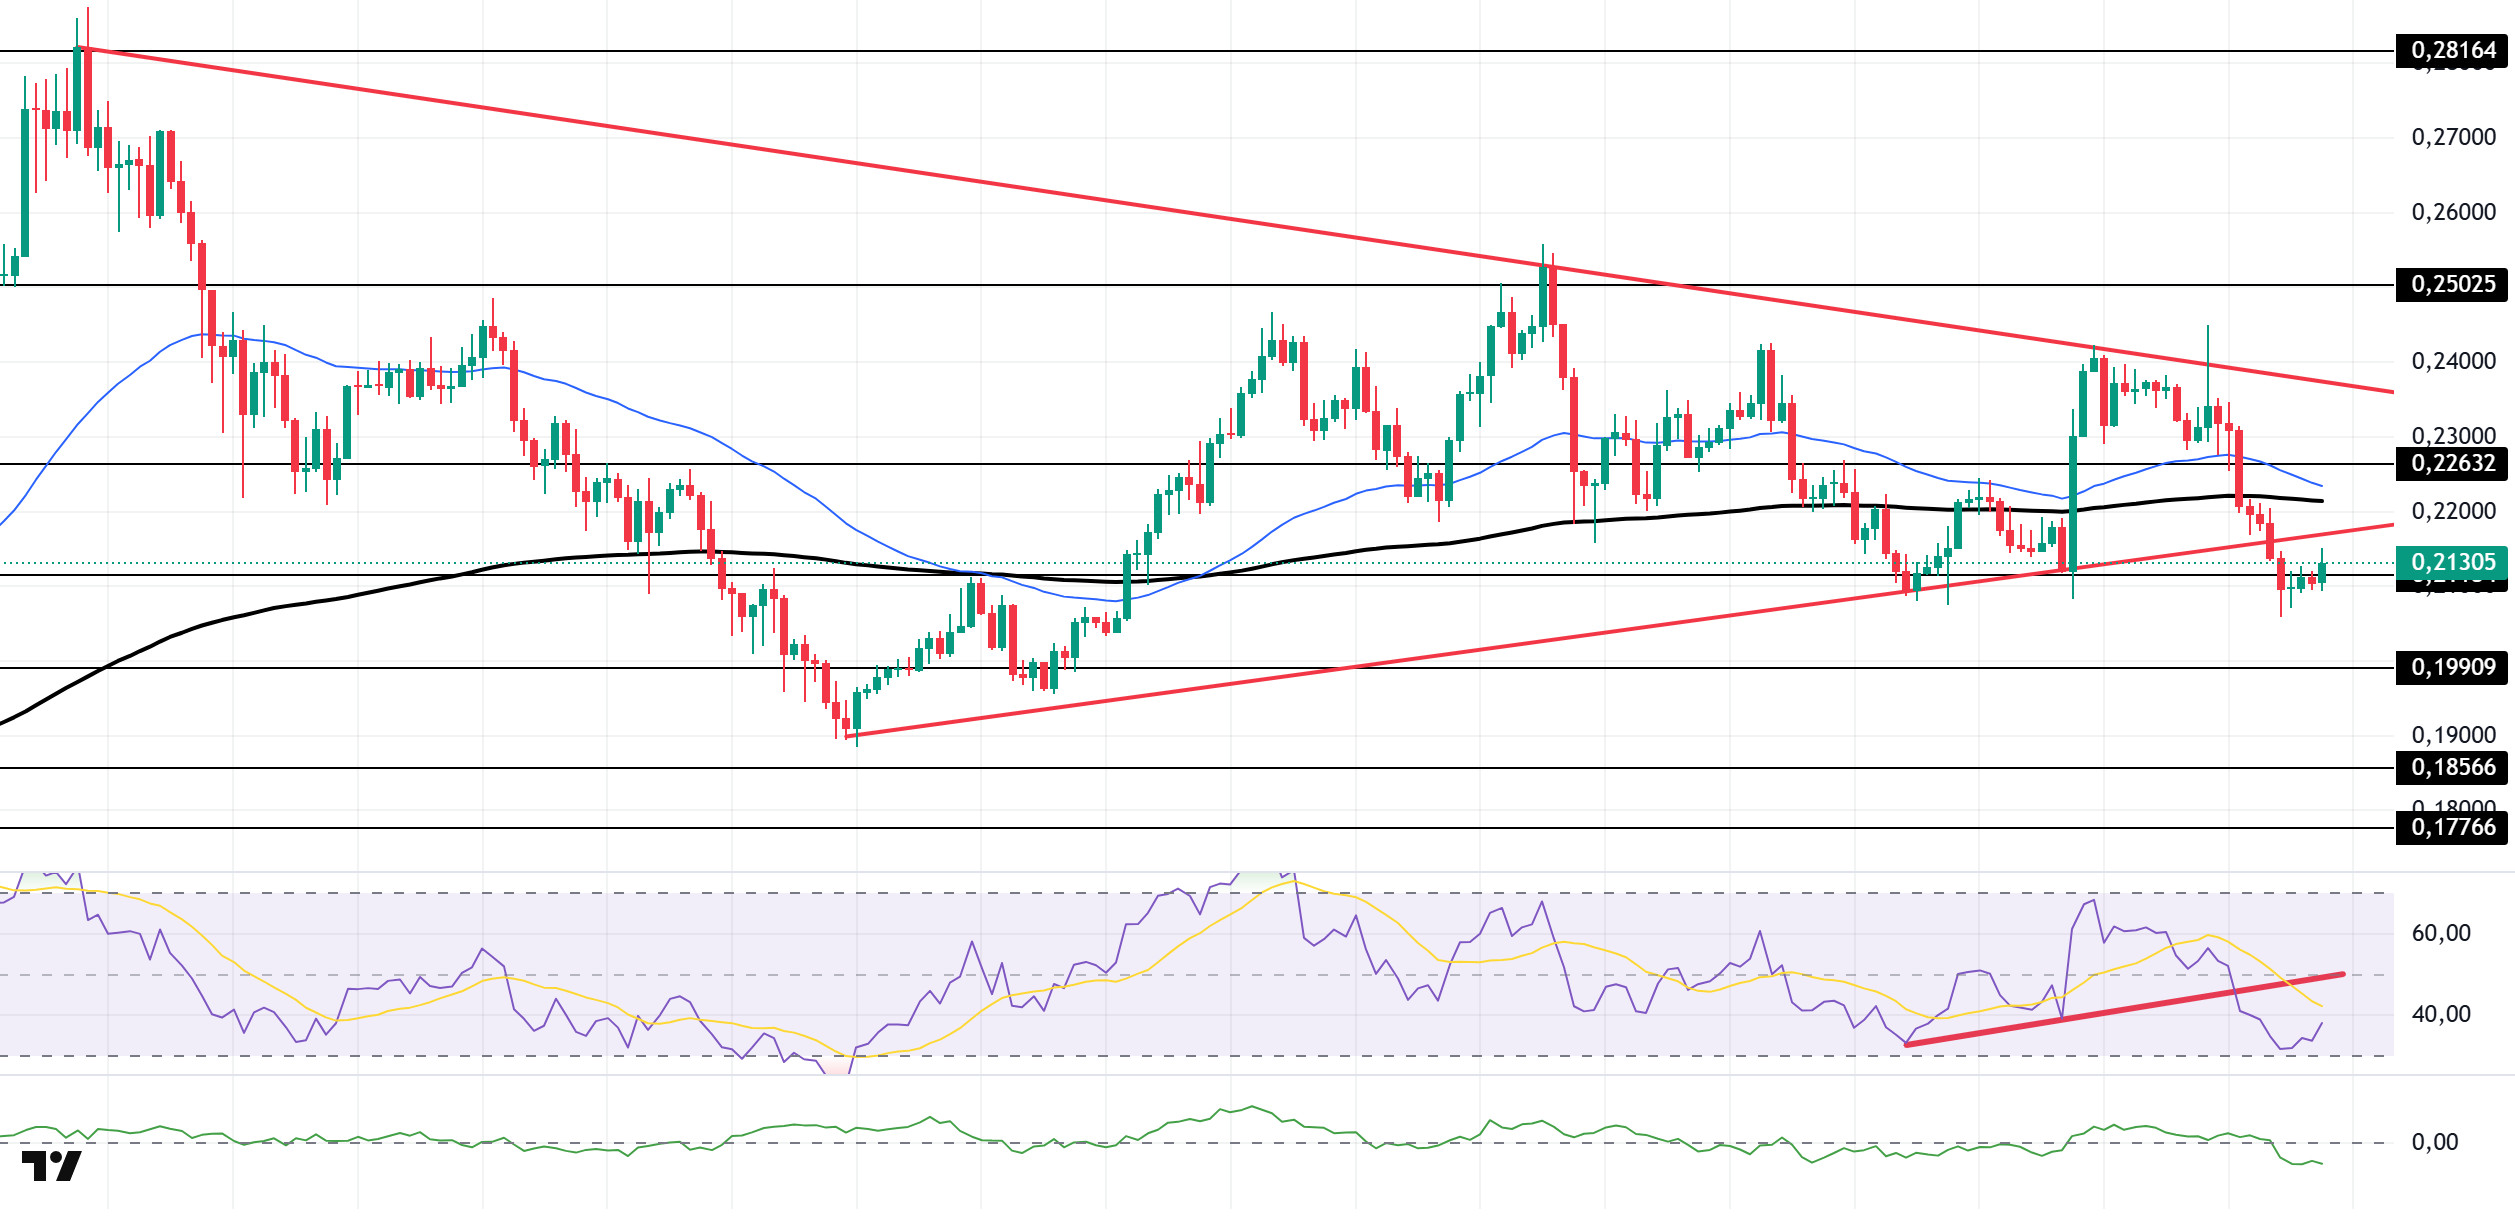
The DOGE price traded sideways during the day. The asset remained below the 200 EMA (Exponential Moving Average – Black Line) moving average and the lower region of the symmetrical triangle formation that began on August 2. Currently, the price is testing the strong resistance level of $0.21154. If it closes above this level, it could test the $0.22632 level. In the event of a continued pullback, the $0.19909 level should be monitored.
On the 4-hour chart, the 50 EMA (Blue Line) continues to remain above the 200 EMA. This indicates that the asset is in an upward trend in the medium term. The price being below both moving averages indicates that the asset is also trending downward in the short term. The Chaikin Money Flow (CMF-20) has moved into negative territory. Additionally, an increase in cash inflows could push the CMF into positive territory. The Relative Strength Index (RSI-14) remained in the negative zone. It also continued to trade below the upward trend that began on August 19, indicating that selling pressure persists. In the event of potential upward movements driven by political developments, macroeconomic data, or positive news flow within the DOGE ecosystem, the $0.22632 level stands out as a strong resistance zone. Conversely, in the event of negative news flow, the $0.19909 level could be triggered. A decline to these levels could increase momentum and potentially initiate a new upward wave.
Supports: $0.19909 – $0.18566 – $0.17766
Resistances: 0.21154 – 0.22632 – 0.25025
TRX/USDT
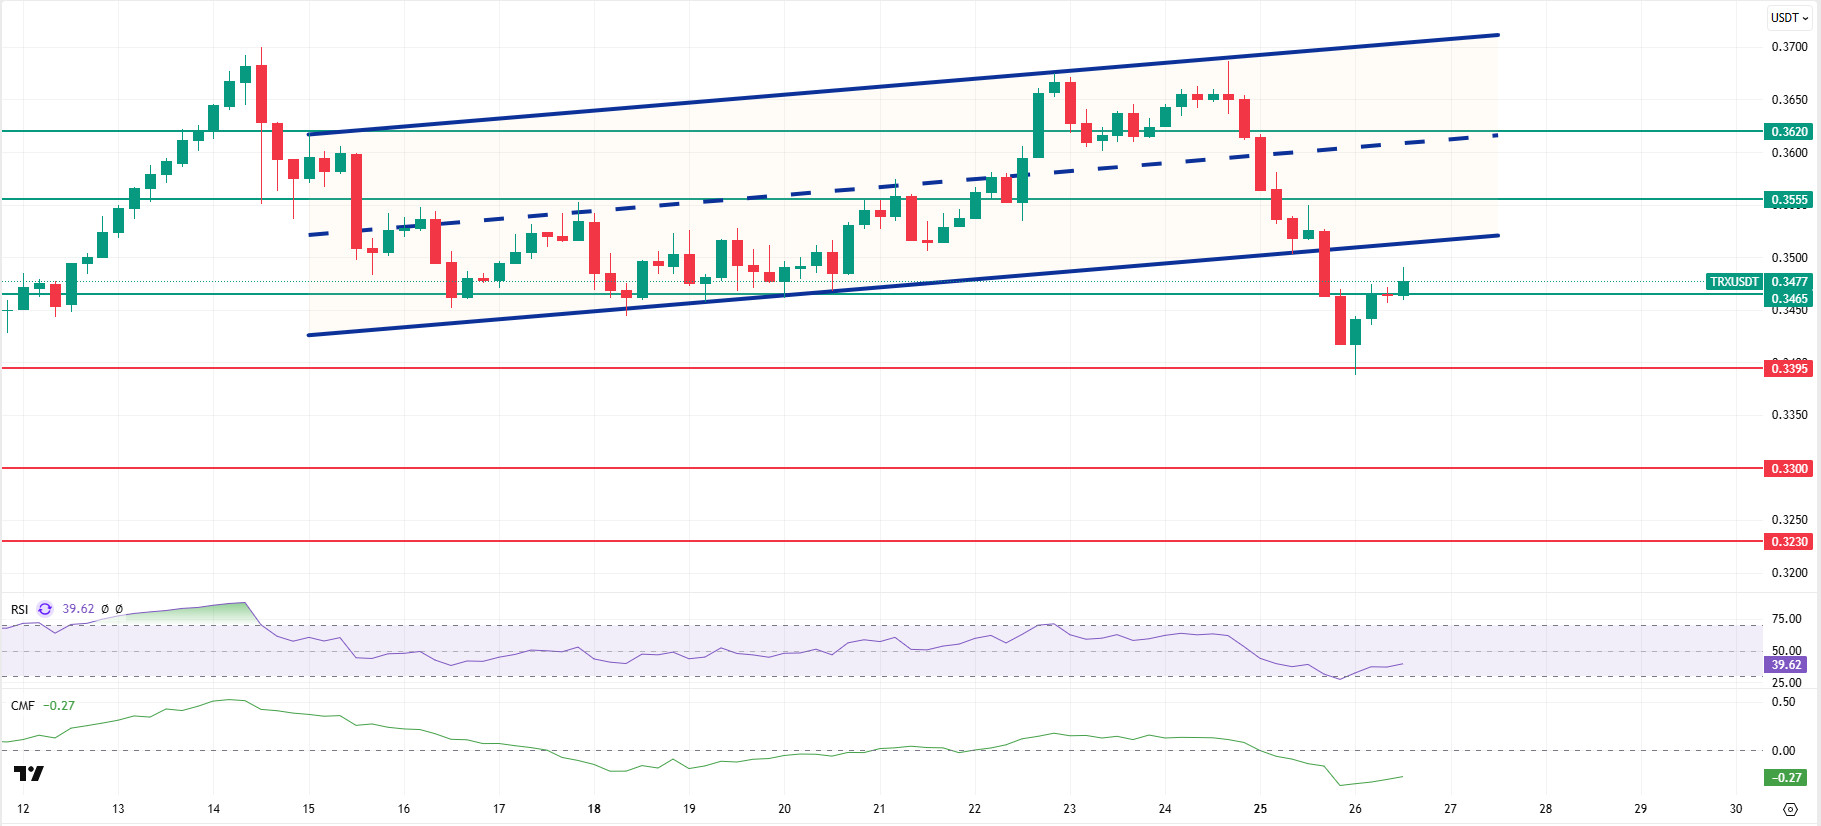
TRX, which attempted to break the 0.3465 resistance during the day, is currently trading at 0.3477. Currently under a bullish channel, TRX is trading above the 0.3465 resistance on the 4-hour chart. The Relative Strength Index (RSI) value is 39, indicating that it is close to the oversold zone and that a buying reaction may occur from these levels. In addition, the Chaikin Money Flow (CMF) indicator continues to remain below zero at -0.27, signaling a decrease in cash inflows. The CMF remaining in negative territory signals pressure on the price.
In light of all these indicators, TRX may attempt to rise slightly and enter the bullish channel in the second half of the day. In this case, it may test the 0.3555 resistance level. A candle close above the 0.3555 resistance level could signal a continuation of the uptrend, potentially moving toward the channel’s mid-band and testing the 0.3620 resistance level. If the candle does not close above the 0.3555 resistance level, capital outflows may continue, causing the price to move downward, along with the CMF remaining in negative territory. As a result, it may test the 0.3395 and 0.3300 support levels in sequence.
On the 4-hour chart, 0.3300 is an important support level, and as long as it remains above this level, the upward trend is expected to continue. If this support level is broken, selling pressure is expected to increase.
Supports: 0.3395 – 0.3300 – 0.3230
Resistances: 0.3465 – 0.3555 – 0.3620
LTC/USDT
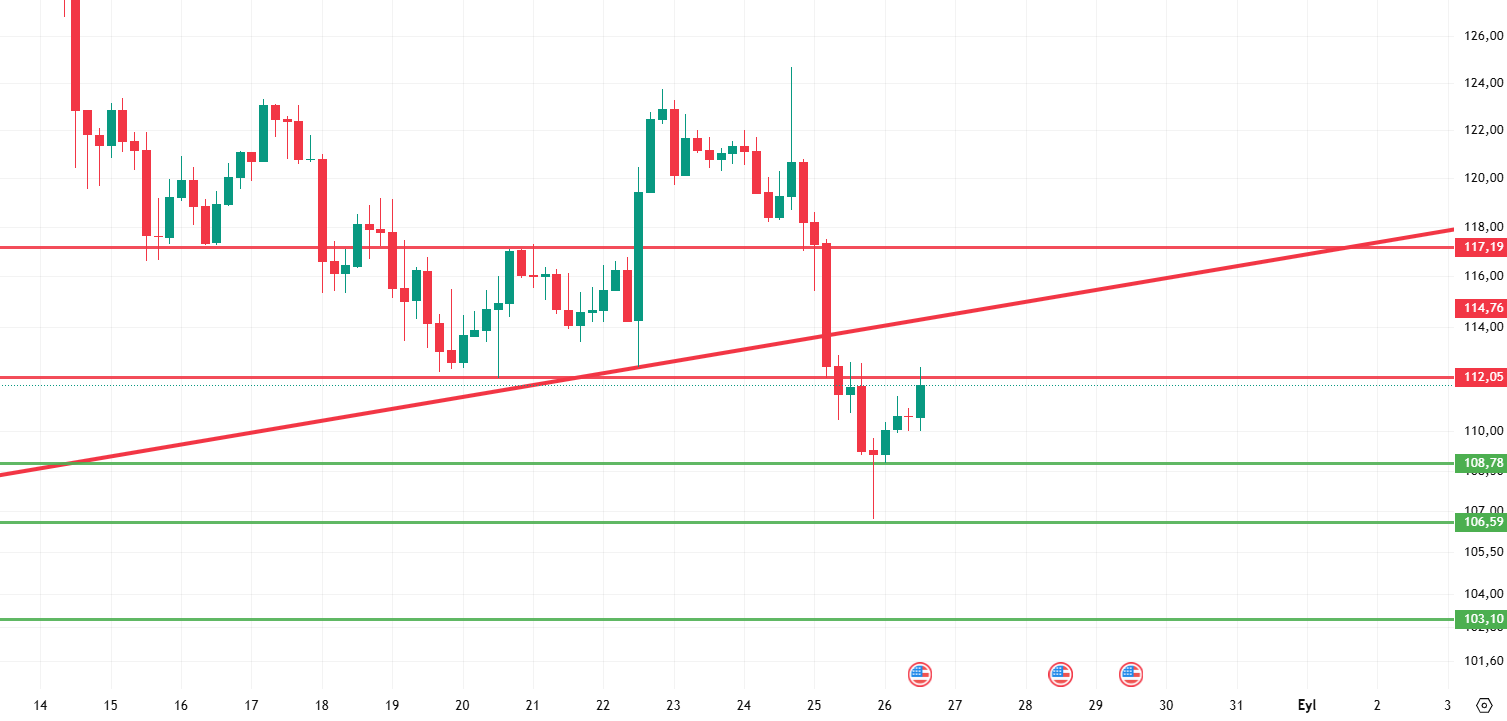
LTC, which recorded a 2.88% increase during the day, gave signals of strengthening in the technical outlook by trying to hold above the 112.05 resistance. Although the response attempts following the sharp sell-off have been insufficient so far, continuing to paint a negative picture in the short term, 4-hour candle closes above 112.05 could push the price up, but this has not happened yet. Therefore, the current pullback may not be complete yet, and the search for a new equilibrium in the short term appears to be at the forefront.
Following the recent decline, the price needs to close above the major resistance level of 112.05, supported by rebound buying. This level stands out as the first key threshold indicating whether buyers can gain strength in the short term. If 112.05 is breached, the price could be pushed up to the lower band of the broken uptrend, driven by rebound buying. At this point, the 114.24 level is particularly critical as a decision zone. This is because this level represents both the bottom of the trend and has seen heavy trading volume in the market, making it decisive in terms of determining the direction. If the price fails to break above the 114.76 level and selling pressure increases again at this point, the upward movement can be considered a “retest,” and this scenario could lead to the price coming under downward pressure again. However, if buyers strongly break the 114.24 level, the technical outlook will change positively, and the likelihood of the price rapidly accelerating towards the 117.19 level will increase. In this context, the 114.24 level should be closely monitored as a key area in terms of both the continuation of short-term rises and whether selling pressure will return.
If the downward movement continues, the 108.78 level can be monitored as an intermediate support level. This level stands out as an area that could slow down the pace of the price decline in the short term and allow buyers to enter the market, albeit to a limited extent. However, if 108.78 is broken, attention will turn to the 106.59 level as selling pressure deepens. 106.59 can be considered a stronger support zone as it is the last reaction point, and reactions from this point will be decisive in determining whether the price will enter a new recovery process. If this level is also broken downwards , selling will accelerate in the market, and the price will likely retreat to the next major support area at 103.10. 103.10 has the potential to form a strong base due to its structure and stands out as a critical level where buyers could regain strength in the event of a major sell-off. Therefore, whether 103.10 is broken or not could clearly determine the market’s direction in terms of the medium-term trend.
Supports: 108.78 – 106.59 – 103.10
Resistances: 112.05 – 114.24 – 117.19
SUI/USDT
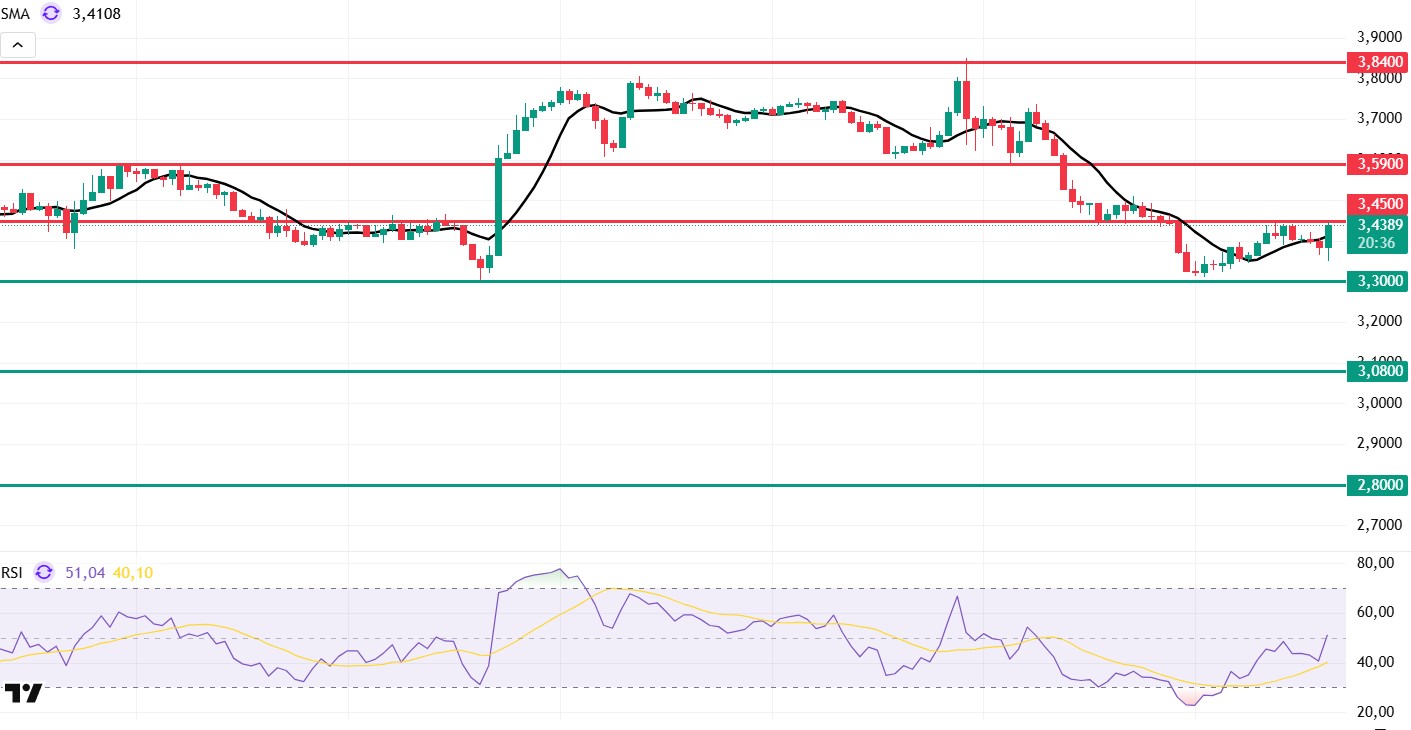
Looking at Sui’s technical outlook, we see that the price has declined on a weekly basis to around $3.43, influenced by fundamental developments. The Relative Strength Index (RSI) is currently in the 51.04 – 40.10 range. This range indicates that the market is trading close to the sell zone; however, if the RSI weakens and falls to the 30.00 – 35.00 range, it could signal a potential buying point. If the price moves upward, the resistance levels of $3.45, $3.59, and $3.84 can be monitored. However, if the price falls to new lows, it could indicate that selling pressure is intensifying. In this case, the $3.30 and $3.08 levels stand out as strong support zones. In particular, in the event of a sharp sell-off, a pullback to $2.80 appears technically possible.
According to Simple Moving Averages (SMA) data, Sui’s average price is currently at $3.41. The price remaining below this level indicates that the current downtrend may technically continue. The downward trend of the SMA also supports this situation.
Supports 2.80 – 3.08 – 3.30
Resistances 3.45 – 3.59 – 3.84
Legal Notice
The investment information, comments, and recommendations contained herein do not constitute investment advice. Investment advisory services are provided individually by authorized institutions taking into account the risk and return preferences of individuals. The comments and recommendations contained herein are of a general nature. These recommendations may not be suitable for your financial situation and risk and return preferences. Therefore, making an investment decision based solely on the information contained herein may not produce results in line with your expectations.

