
BTC/USDT
The latest employment data released in the US gave positive signals for the economic outlook. Nonfarm payrolls increased by 147,000 in June, exceeding the expectations of 110,000. Unemployment rate was realized as 4.1% in June, below the forecast of 4.3%. These data may cause the Fed to postpone its interest rate policy again. Later in the day, the final vote of the law declared as the “Great and Beautiful” law in the House of Representatives will be followed.
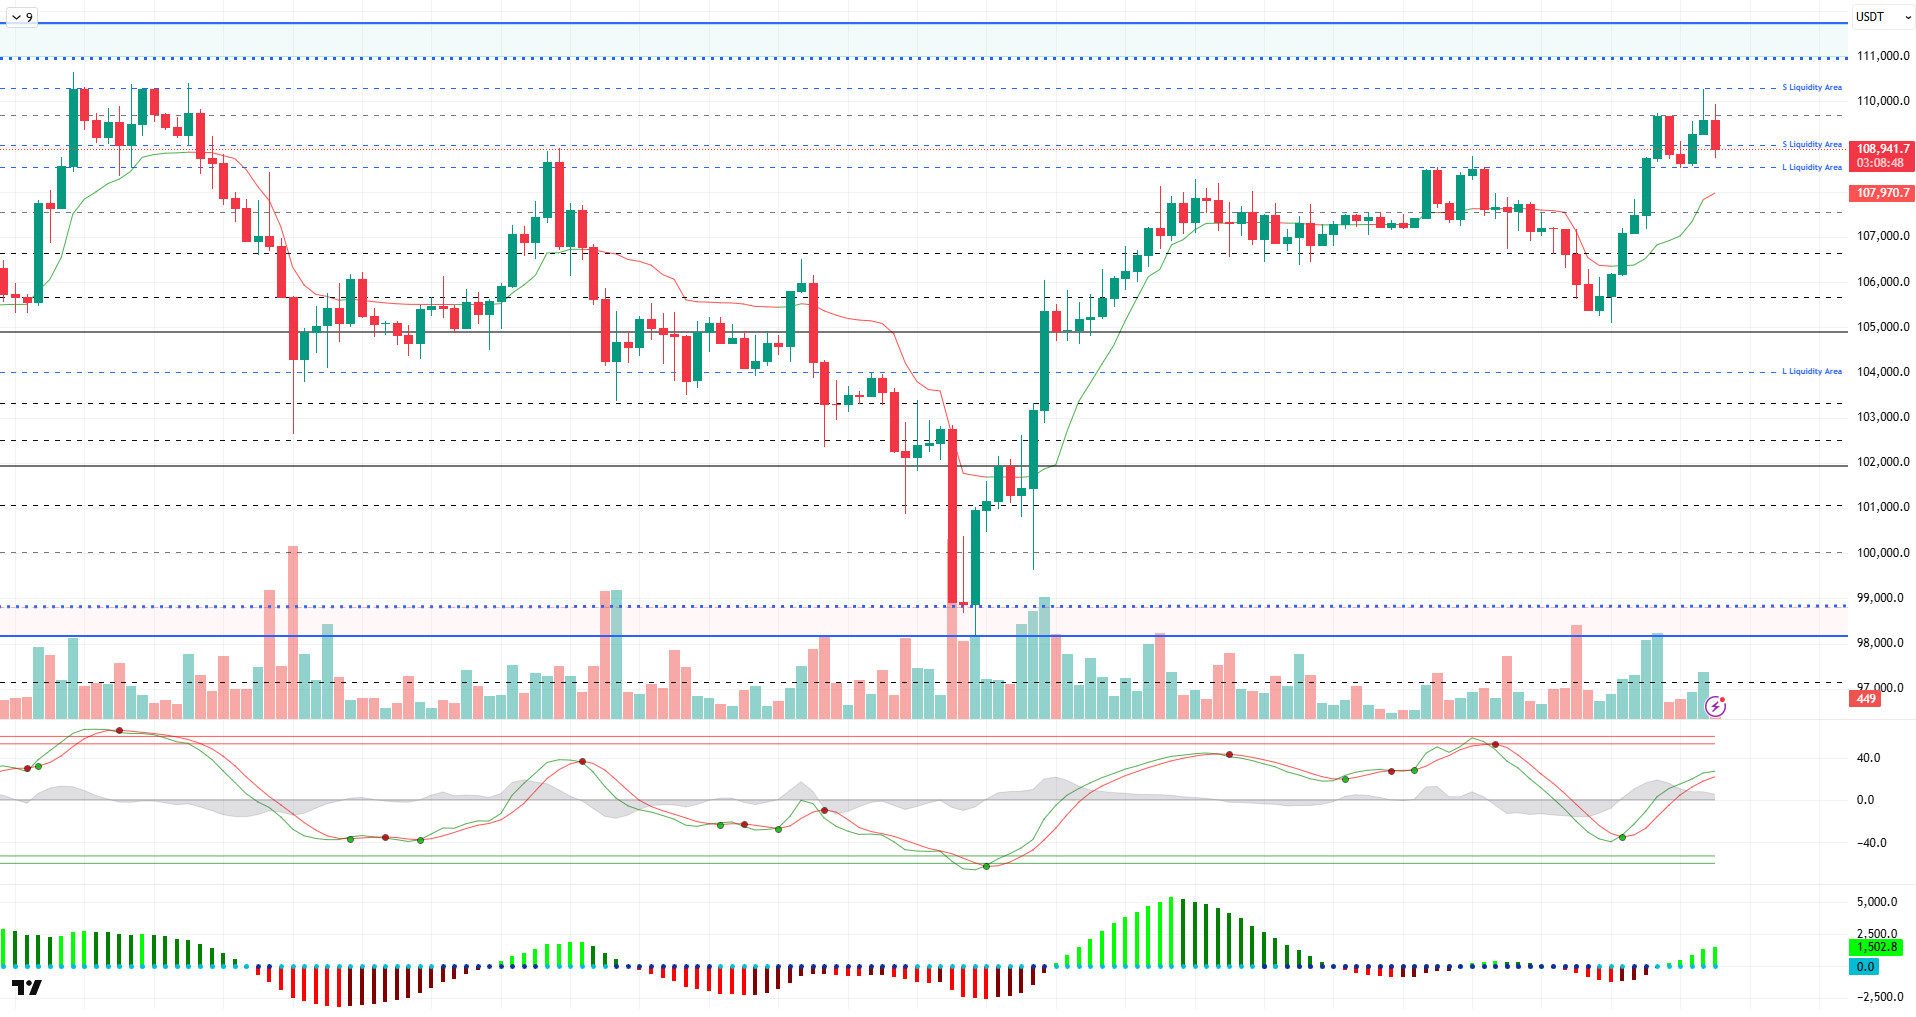
Looking at the technical outlook, BTC continued to maintain its gains, but faced selling pressure after reaching 110,300 during the day. At the time of writing, it is trading at 108,800, exhibiting volatile movements.
Technical indicators are showing signs of weakness as the Wave Trend (WT) trend reversal is moving towards overbought territory. The histogram on the Squeeze Momentum (SM) indicator is back in positive territory, while the Kaufman moving average is below the price at 108,000.
When the liquidity data is analyzed, BTC, which headed towards the liquidity area with the recent rise, this time liquidated the sell-side transactions above 110,000. Then, the price, which faced selling pressure, fell below the 109,000 level, while it may target buy trades at 108,400.
In conclusion, fundamental developments continued to be the catalyst for pricing, while macro data postponed expectations for a rate cut. While liquidity data provides liquidations, technical indicators show some weakness. After this stage, a new catalyst may be needed for the rise to gain momentum. In this context, 110,000 is followed as a critical resistance point in the continuation of the rise, while closes above it can move the price back to the ATH level. On the other hand, if the decline deepens, it can be expected to follow liquidity areas. In this possibility, the 108,500 level will be followed by the 107,500 support point.
Supports 109,000 – 108,500 – 107,500
Resistances 110,000 – 111,000 – 111,970
ETH/USDT
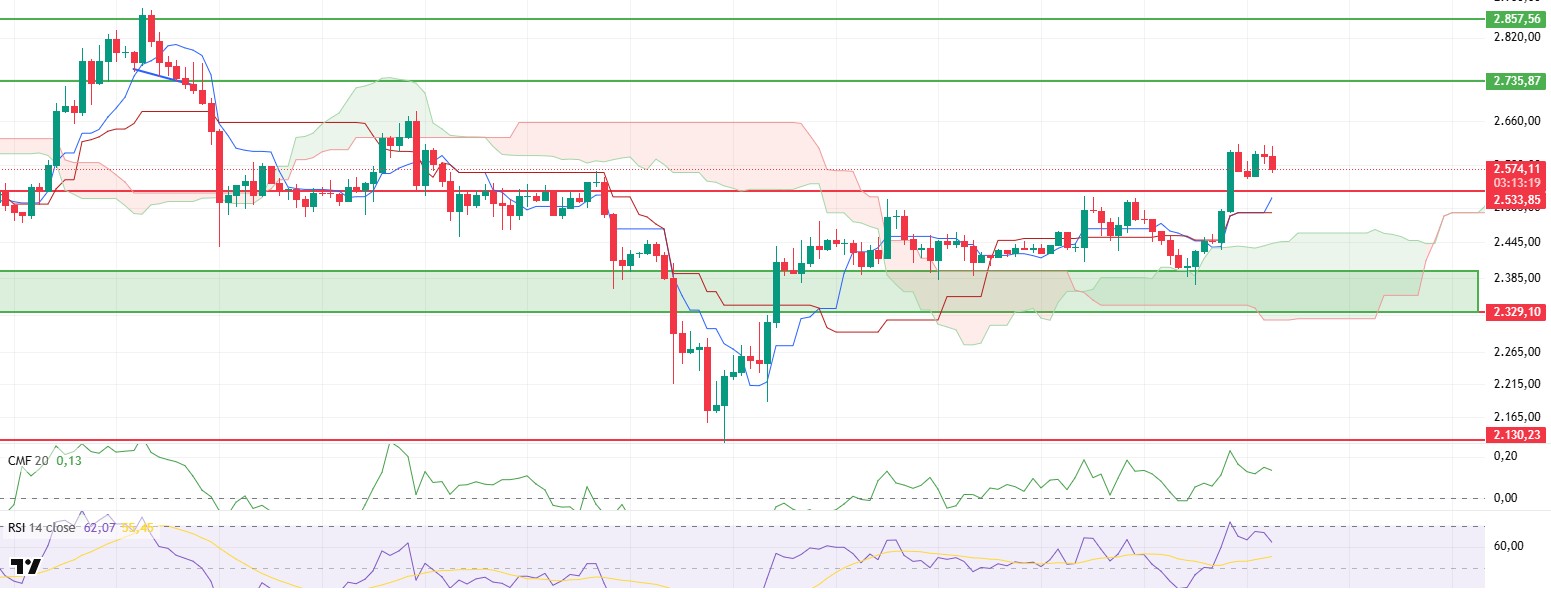
The Nonfarm Payrolls and Initial Jobless Claims data released during the day revealed a weak picture contrary to expectations and weakened expectations for interest rate cuts. As a result, there was a sharp decline in global risk appetite, which was strongly reflected in the cryptocurrency market. Against this backdrop, the ETH price retreated sharply during the day, testing below the $2,570 level.
When technical indicators are analyzed, the upward cut of the tenkan level in the ichimoku indicator to the kijun level produces a positive signal in short-term momentum, while the upward trend of the kumo cloud supports that the uptrend is still valid in the overall structure. This structure indicates that despite the pullbacks, the market has not yet turned down in technical terms and the declines may be a correction.
The Chaikin Money Flow (CMF) indicator, on the other hand, has moved back into slightly negative territory after the recent bearish move. This shows that the liquidity entering the market remains limited and investors continue to act cautiously. At this point, the need for a stronger volume on the buying side comes to the fore in order for price movements to gain momentum.
The Relative Strength Index (RSI) indicator, on the other hand, has turned downward with the selling pressure coming from the overbought zone. However, the fact that this pullback of the RSI is limited along with the price indicates that the overall structure is intact and that this decline is largely a short-term correction. The fact that the RSI is still above neutral levels suggests that buyer interest has not completely disappeared.
When the overall outlook is evaluated, the $2,533 level stands out as a critical support point. Maintaining this level is very important for the continuation of the short-term positive structure. If the price manages to hold above this level, a recovery towards the $ 2,600 level can be expected again. However, it should be noted that if the $2,533 support breaks downwards, selling pressure may increase and the price may enter a deeper correction. Therefore, this support zone is decisive for the short-term direction.
Supports 2,533 – 2,329 – 2,130
Resistances 2,736 – 2,857 – 3,062
XRP/USDT
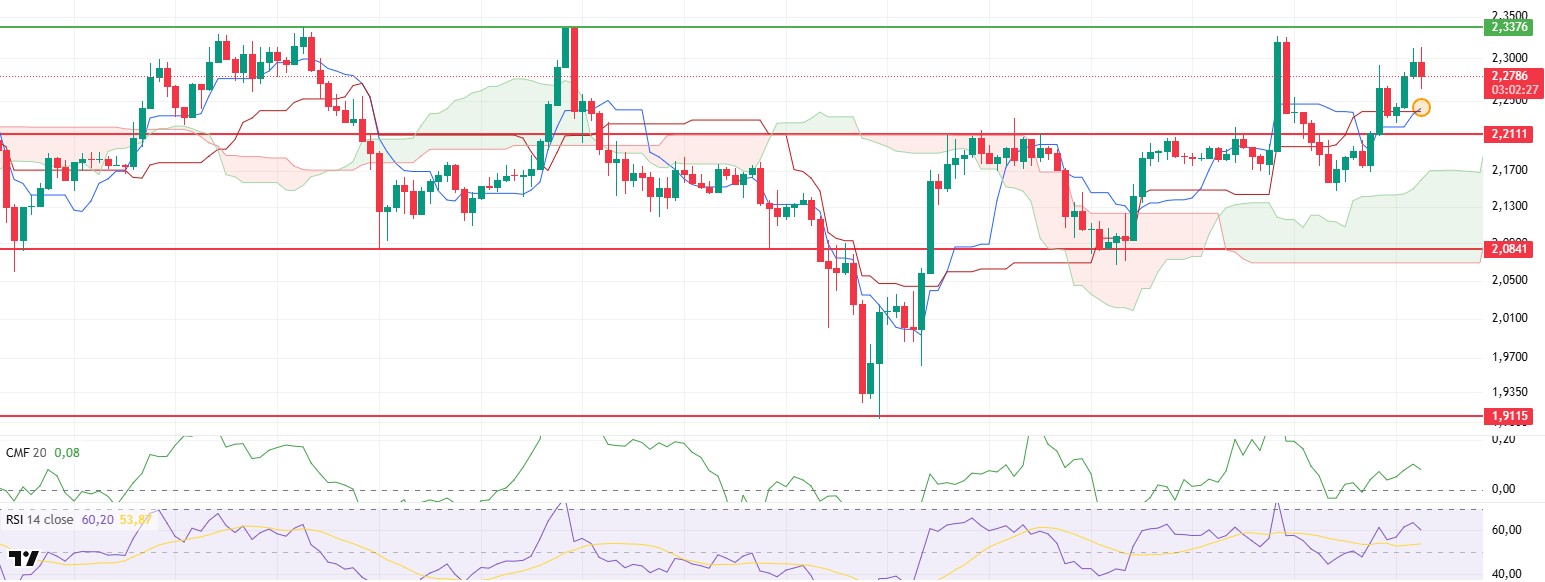
XRP continued its uptrend during the day in line with market expectations, climbing as high as $2.31. However, with the economic data from the US putting pressure on the market, there was a general wave of sales in the cryptocurrency market. These developments also affected the XRP price and the price retreated to the level of $2.26.
Analyzing the technical indicators, although the Chaikin Money Flow (CMF) indicator continues to hover in positive territory, the weak momentum of the rise reveals that market liquidity is still limited. In other words, although there is an upward trend in the price, there is no strong capital inflow to support this trend. This may have a limiting effect on the upward movements of the price from time to time.
Relative Strength Index (RSI) and momentum indicators, on the other hand, continue to remain positive in terms of overall structure, although they have experienced slight pullbacks. The structural strength in these indicators suggests that the short-term bullish scenario is still valid. In particular, the fact that the RSI stays away from the overbought zone and hovers close to neutral levels provides positive signals that the price still has room for upward movement.
On the Ichimoku indicator, an important technical development draws attention. With the kijun level cutting the tenkan level upwards, a classic buy signal has been formed. This signal can be considered as one of the strong technical indicators that support short and medium-term bullish expectations. At the same time, the upward trend is maintained in the overall outlook of the ichimoku structure, indicating that the positive structure continues.
In the overall assessment, most of the technical indicators suggest that the upward movement may continue. In this context, the price is likely to test the resistance zone at $2.33 in the evening. However, downside risks should not be ignored. In particular, the $2.21 level stands out as an important support point. A close below this level may cause the price to turn towards deeper correction movements. Therefore, the $2.21 level is vital to maintain the current positive scenario.
Supports 2.2111 – 2.0841 – 1.9115
Resistances 2.3376 – 2.5900 – 2.8347
SOL/USDT
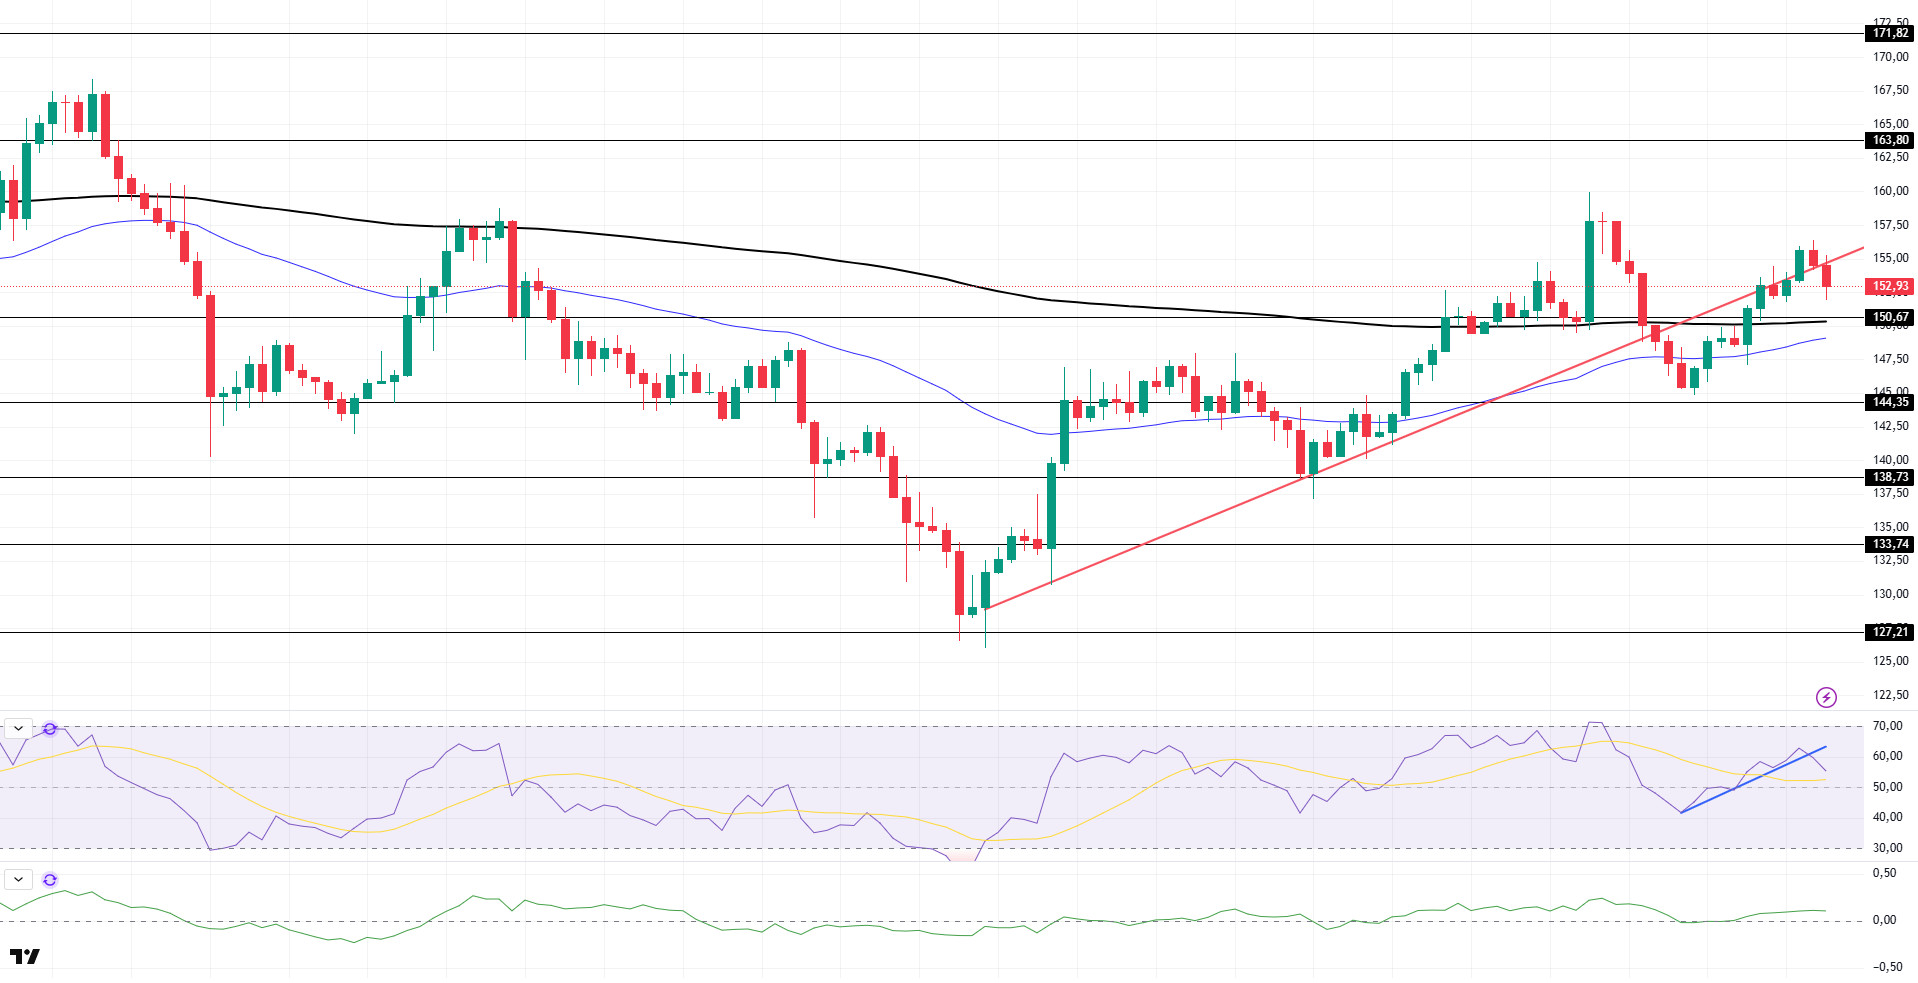
The SOL price was slightly bullish during the day. The asset managed to hold above the $150.67 level, which is a strong resistance. The price, which is currently testing the uptrend that started on June 22 as support, may target the $ 163.80 level on candle closes above the uptrend.
On the 4-hour chart, the 50 EMA (Blue Line) continued to be below the 200 EMA (Black Line). This suggests that the bearish trend may continue in the medium term. At the same time, the fact that the price is above both moving averages suggests that the market is currently bullish in the short term. Chaikin Money Flow (CMF-20) continues to be in positive territory; in addition, a decline in inflows could move CMF into negative territory. Relative Strength Index (RSI-14) continued to be in positive territory. It also broke the uptrend that started on July 1 to the downside. This could be bearish. The $163.80 level stands out as a strong resistance point in case of a bullish rally on the back of macroeconomic data or positive news on the Solana ecosystem. If this level is broken upwards, the rise can be expected to continue. If there are pullbacks due to contrary developments or profit realizations, the $150.67 level can be tested. In case of a decline to these support levels, the increase in buying momentum may offer a potential bullish opportunity.
Supports 150.67 – 144.35 – 138.73
Resistances 163.80 – 171.82 – 181.75
DOGE/USDT
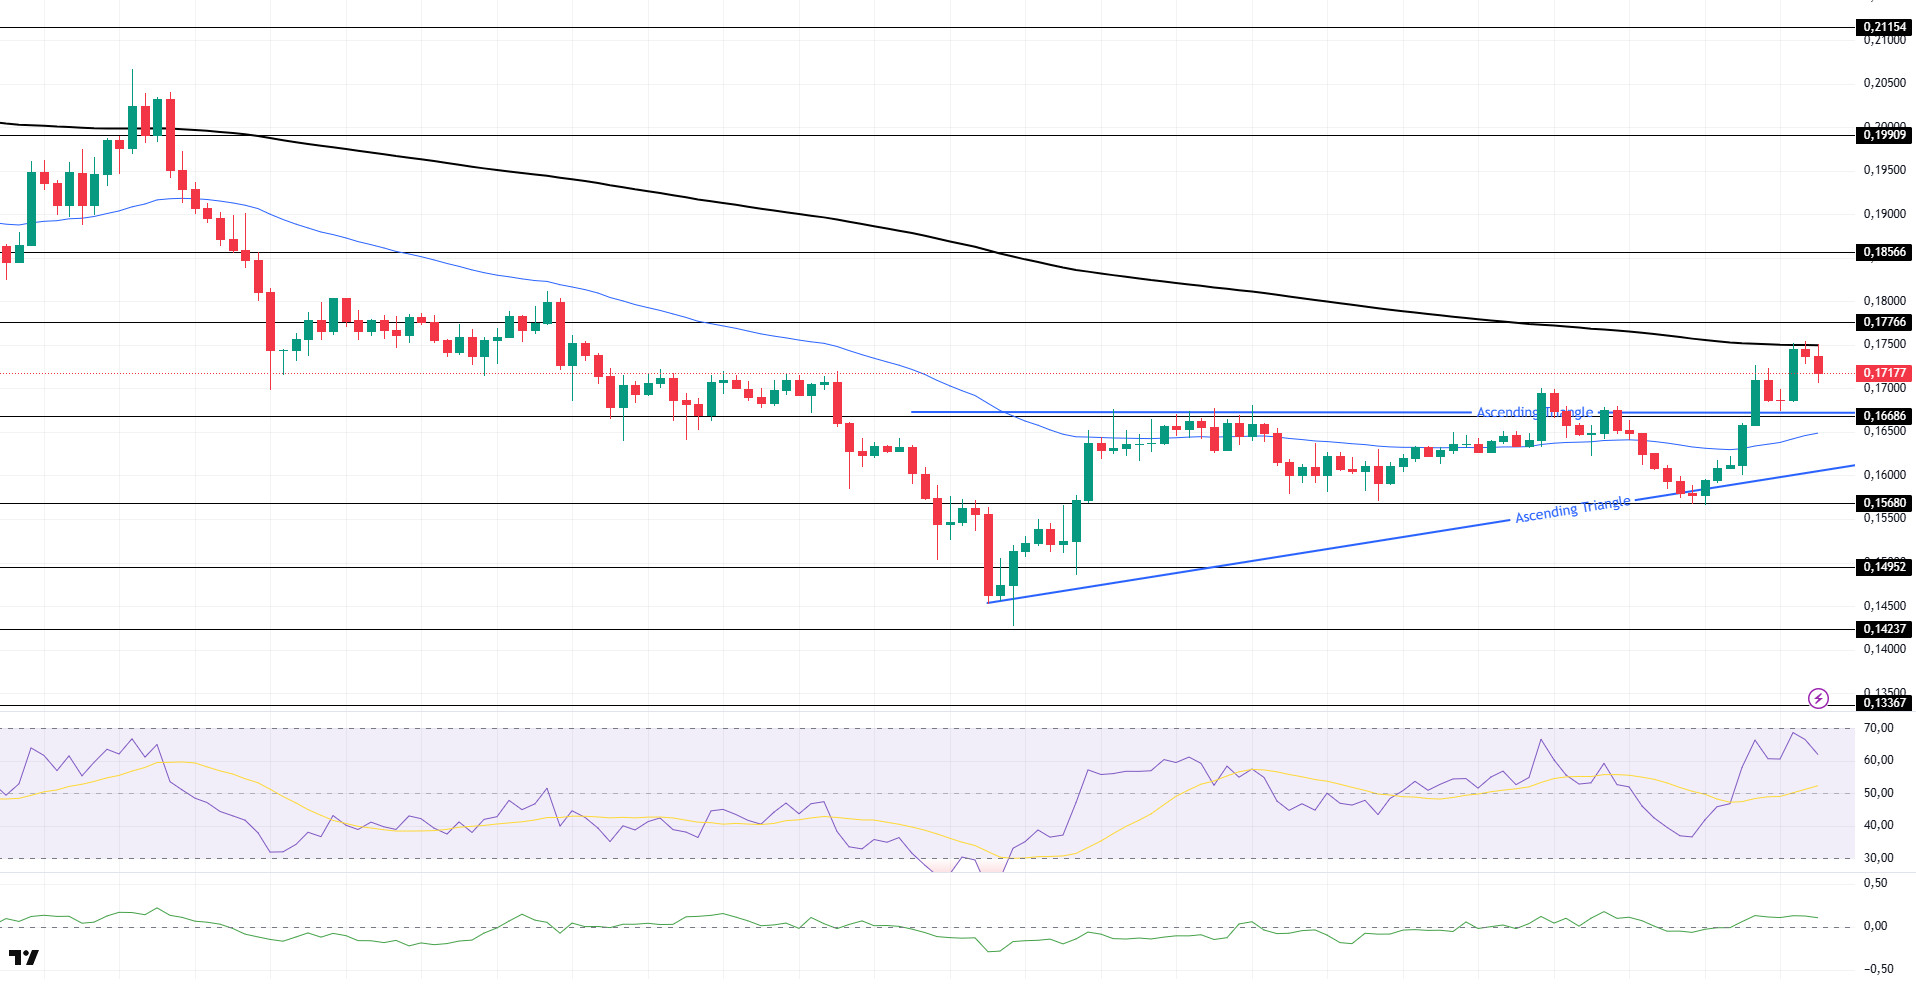
DOGE price moved sideways during the day. It managed to stay above the 50 EMA (Blue Line) moving average and continued to stay above the ascending triangle pattern. The asset, which is currently testing the 200 EMA (Black Line) moving average as resistance, should follow the $ 0.17766 level on candle closures above the 200 EMA.
On the 4-hour chart, the 50 EMA (Blue Line) continues to be below the 200 EMA (Black Line). This suggests that the asset is bearish in the medium term. The fact that the price is between both moving averages suggests that the asset is in the decision phase in the short term. Chaikin Money Flow (CMF-20) started to be in positive territory. In addition, negative money inflows may move CMF into negative territory. Relative Strength Index (RSI-14) continues to be in positive territory. However, selling pressure has emerged. The $0.17766 level stands out as a strong resistance zone in the case of possible rises in line with political developments, macroeconomic data or positive news flow in the DOGE ecosystem. In the opposite case or possible negative news flow, the $0.16686 level may be triggered. In case of a decline to these levels, the momentum may increase and start a new bullish wave.
Supports 0.16686 – 0.15680 – 0.14952
Resistances 0.17766 – 0.18566 – 0.19909
Legal Notice
The investment information, comments and recommendations contained herein do not constitute investment advice. Investment advisory services are provided individually by authorized institutions taking into account the risk and return preferences of individuals. The comments and recommendations contained herein are of a general nature. These recommendations may not be suitable for your financial situation and risk and return preferences. Therefore, making an investment decision based solely on the information contained herein may not produce results in line with your expectations.