
Technical Analysis
BTC/USDT
After 12 days of fighting between Israel and Iran, the economic costs are becoming clearer. The Israeli Finance Ministry announced that the war has so far cost the country $3 billion in direct costs. This amount includes only building repairs and compensation payments to businesses and excludes military expenditures and defence systems. The final cost is estimated to reach 12 billion dollars.
Unemployment claims came in at 236K, below the expected 243.2K, while the US economy contracted by 0.5% in Q2, below both previous and expectations. On the other hand, durable goods orders came as a big surprise with a 16.4% increase.
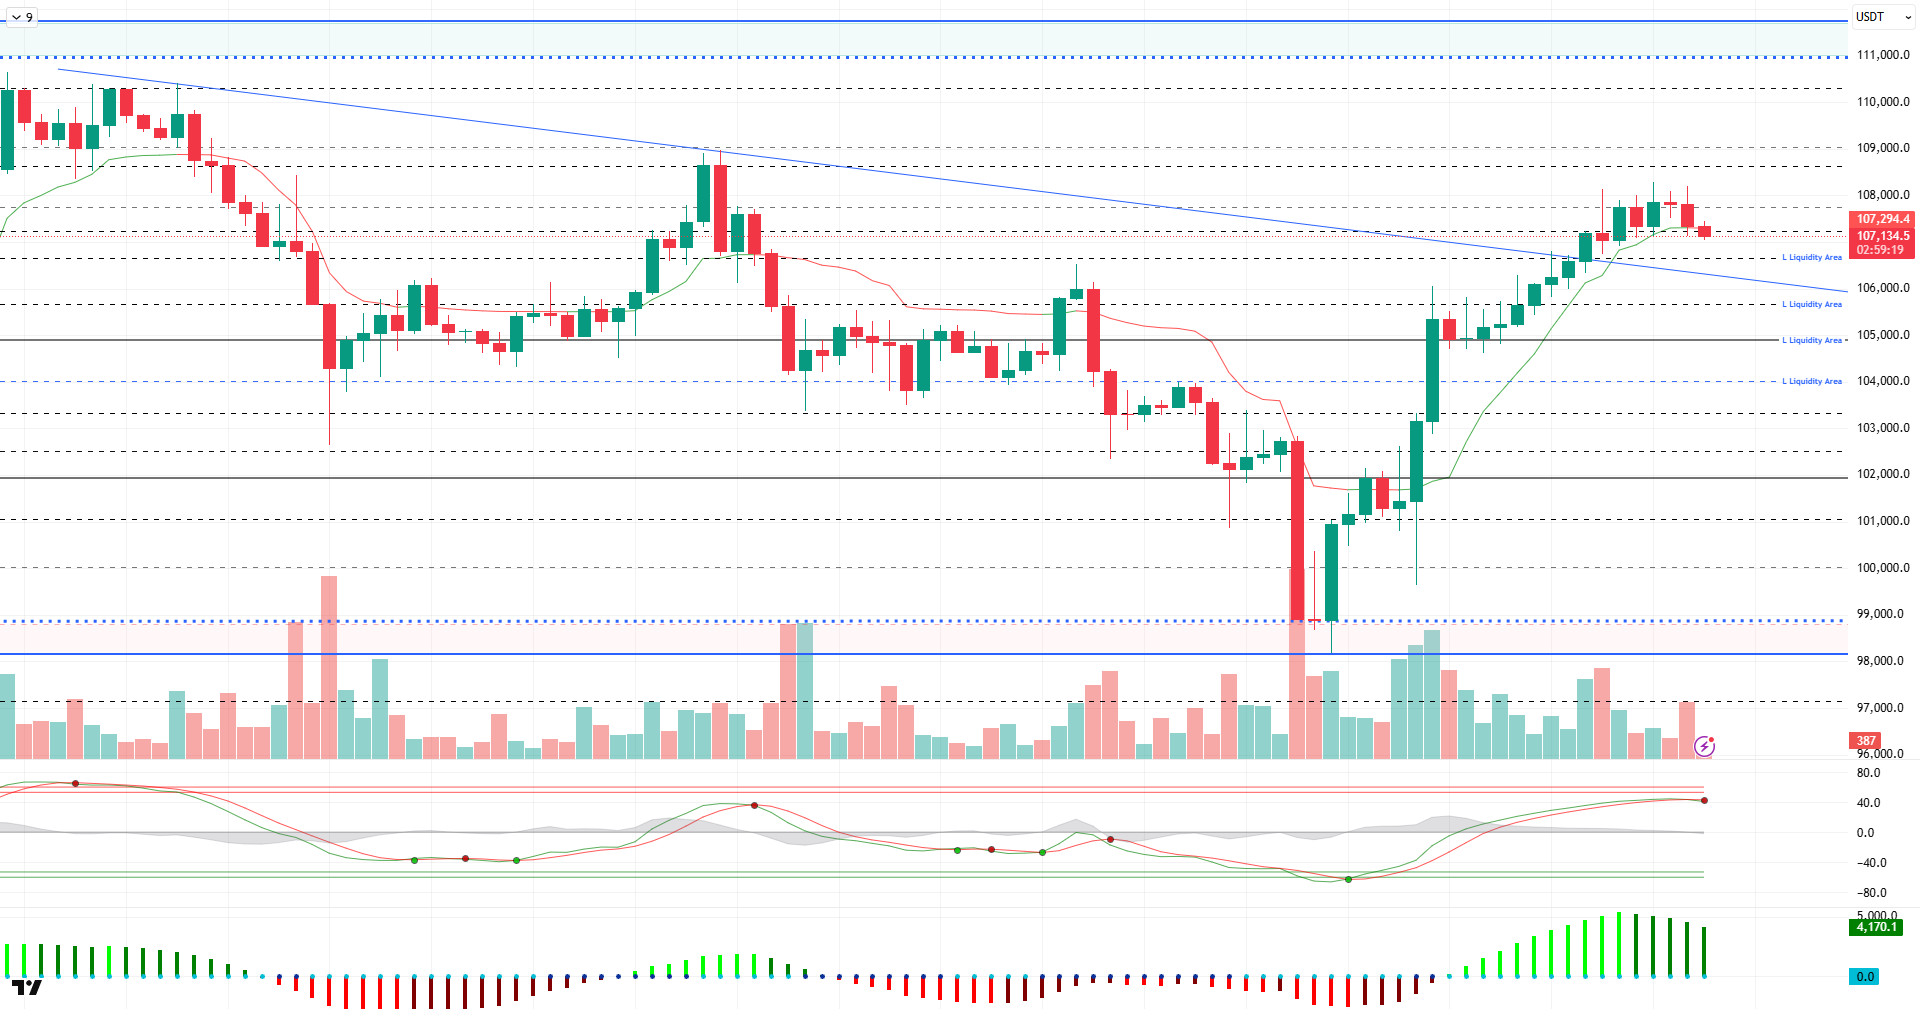
Looking at the technical outlook, BTC continues to hold above the 107,000 level as it continues to hold its gains. Breaching the upper line of the downtrend structure, BTC is trading at 107,300 at the time of writing
On the technical indicators front, the Wave Trend (WT) oscillator is moving close to the overbuy zone, while weakening. The Squeeze Momentum (SM) indicator also supported the upside and is back in positive territory, but the histogram shows signs of weakening. Kaufman moving average crossed above the price, positioned at 107,300
Analysing the liquidity data, short-term buy trades started to reappear, while the last rise was accompanied by the liquidation of the sell trades in the 107,300 band. While the selling range is diluted, the buying range is in a wide band between 103,000 and 107,000.
As a result, while the positive scenario created by fundamental developments stands out as a positive factor in terms of pricing, it is seen that it has entered the respite phase as the momentum weakens. In addition to technical weakness, liquidity data also accompanies the weakening. In this context, 105,500 – 105,000 will be followed as a support band in a possible selling pressure and the ATH level will be followed in the continuation of the rise.
Supports 106,000 – 105,000 – 103,300
Resistances 107,300 – 109,000 – 110,000
ETH/USDT
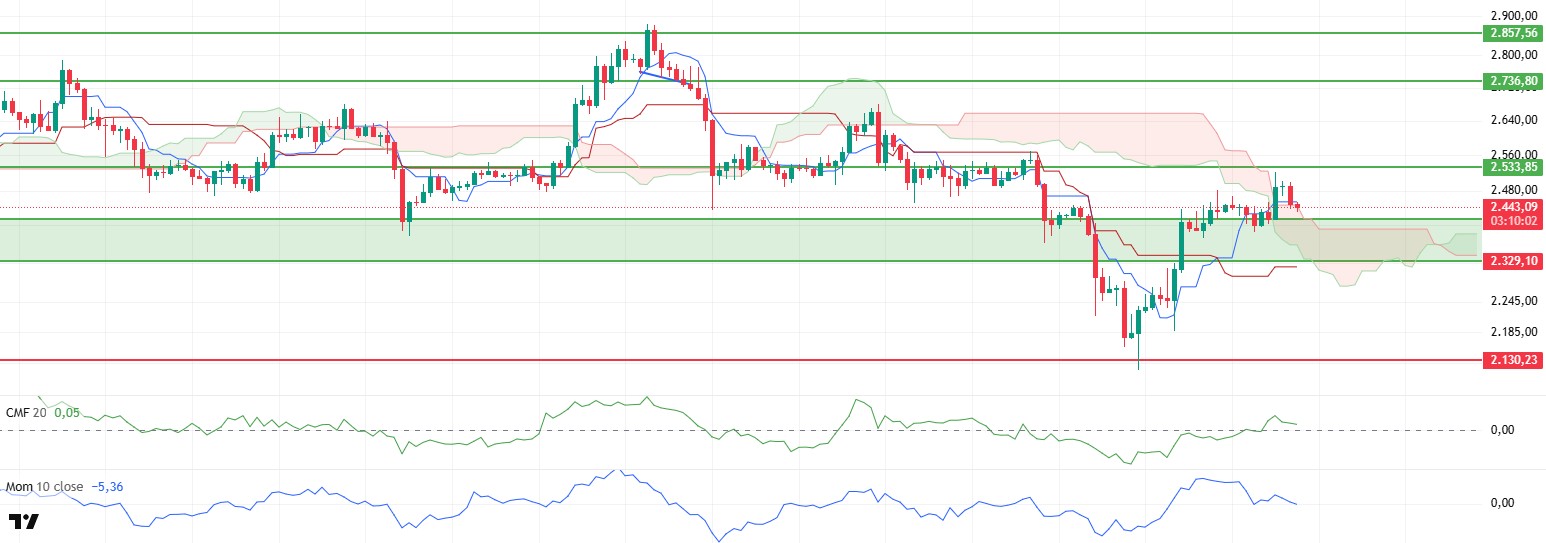
ETH price retreated from the $2,500 level during the day, facing selling pressure and fell to the upper band of the kumo cloud. However, this pullback has not yet triggered weakening signals in the technical outlook. The fact that the price managed to stay above the cloud support reveals that the positive scenario is still valid.
When the Ichimoku indicator is analyzed, it is noteworthy that the price finds support in the upper band of the kumo cloud and the tenkan level moves horizontally. This structure indicates that the current uptrend continues to be technically supported. The lack of a decline, especially at the tenkan level, indicates that buyers are still strong and the market is willing to continue its upward trend.
The liquidity side also supports this picture. The Chaikin Money Flow (CMF) indicator remains flat in the positive zone, indicating that there is no serious capital outflow from the market and liquidity continues to be largely preserved. This suggests that declines may remain limited for now.
Looking at the Cumulative Volume Delta (CVD) data, it is seen that sales are more dominant in the futures market compared to the spot market. Although this may put pressure on the price in the short term, the fact that the spot side remains resistant may have a limiting effect on the price’s downward movements. Moreover, the Aggregated Predicted Funding Rate data has been in the negative territory in recent hours, indicating that short positions have increased and bearish positions have intensified in the futures market. This suggests that a possible short squeeze scenario may be on the agenda in the coming hours.
Although there is a slight weakening in momentum, the overall structure is still on the positive side. Although the downward trend in momentum suggests that short-term fluctuations may continue, the positive picture in technical and on-chain data has the potential to make these declines temporary.
In summary, a retest of the $2,533 level seems likely if the price continues to stay above the kumo cloud. Closes above this resistance could accelerate the uptrend and strengthen the trend. On the other hand, if the upper band of the cloud breaks downwards, retracements that may remain limited in the first place may come to the agenda. In this context, both technical indicators and on-chain data suggest that the price retains the potential to resume the upward movement in the short term.
Supports 2,329 – 2,130 – 2,029
Resistances 2,533 – 2,736 – 2,857
XRP/USDT
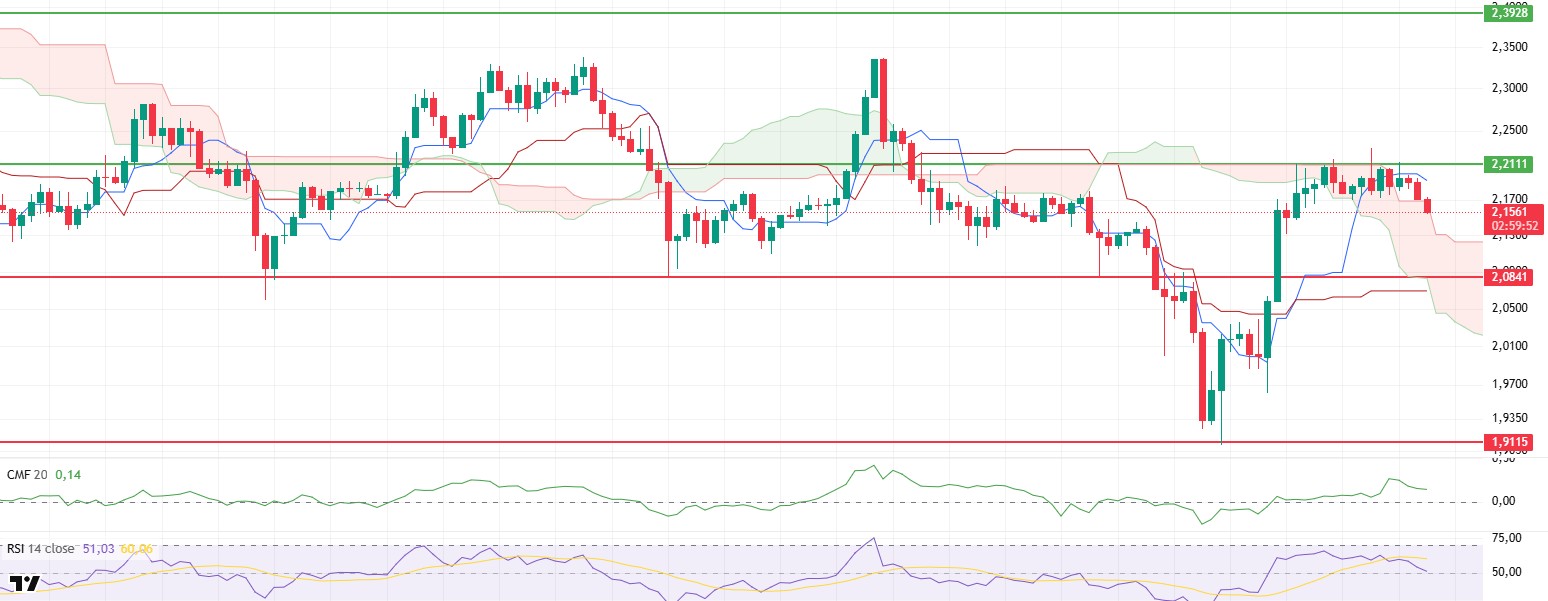
XRP price continued its downtrend, continuing to be affected by the technical weaknesses that emerged in the morning hours, breaking the upper band of the sand cloud to the downside and falling to the $2.15 level. This move reveals that the intraday technical structure has weakened and market participants are unable to resist the selling pressure.
On the technical indicators side, the simultaneous downward trend of the Relative Strength Index (RSI) and the momentum indicator is one of the important signals of the ongoing pressure on the price. The negative trend of the RSI as it dips below the mid-levels indicates that the appetite for buying has significantly decreased. Likewise, the decline in momentum also confirms the loss of upside energy in the market.
When the Ichimoku indicator is analyzed, the price sagging below the kumo cloud support and simultaneously losing the tenkan level are among the factors that strengthen the deterioration in the technical outlook. This structural breakdown supports that the short-term trend has turned negative and the market has entered a downtrend phase.
On the other hand, it is noteworthy that the Chaikin Money Flow (CMF) indicator remains in positive territory despite the price decline. This outlook suggests that there has not been a serious liquidity outflow in the market and that there is still a resilient structure on the capital side despite the declines. This structure of CMF indicates that the price may stabilize with limited pullbacks instead of deeper declines.
Overall, technical indicators are predominantly negative, but the downside potential of the price may be limited to the short term. In this context, the possibility of a pullback towards the $2.12 level stands out. However, since this region is a strong level that has worked as support in the past, purchases from here may make it possible for the price to rebound. On the other hand, if the $2.21 level is exceeded on the upside and sustained above this level, the weaknesses in the technical indicators may become invalid and the uptrend may regain strength. In this scenario, the market outlook may turn back to the buy side.
Supports 2.0841 – 1.9115 – 1.7226
Resistances 2.2111 – 2.3928 – 2.5900
SOL/USDT
Solana reached record highs in futures trading as ETF applications increased.
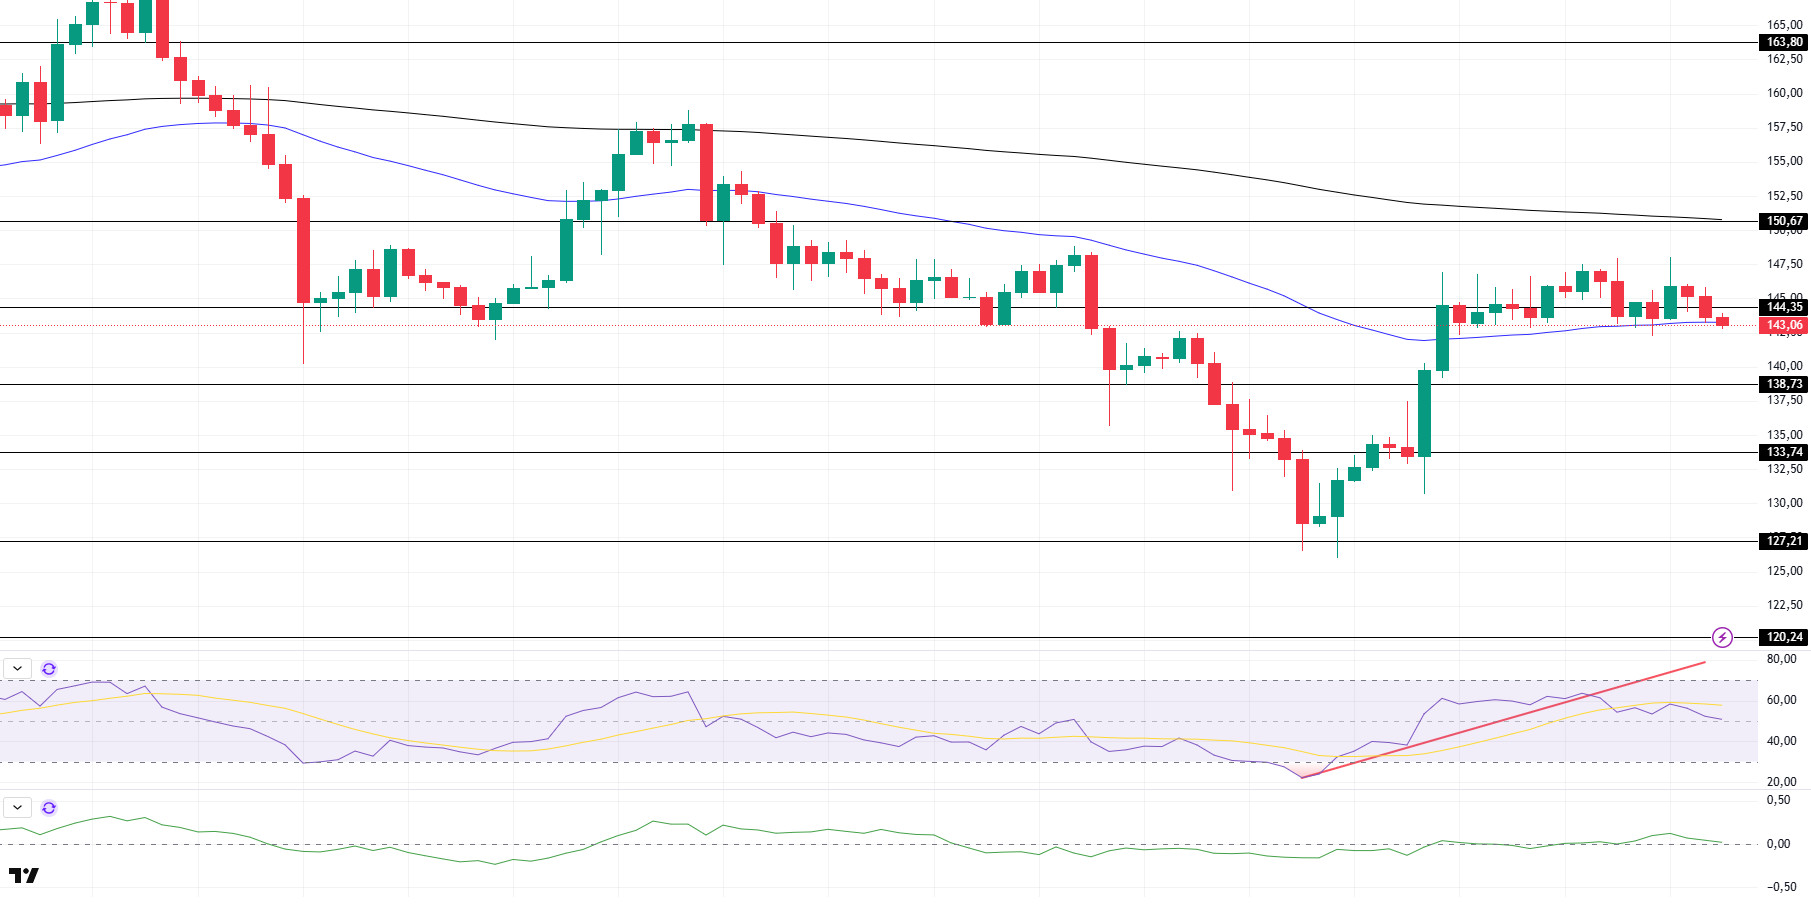
SOL price continued its sideways movement during the day. The asset started to hover below the strong support level of $144.35. However, it remains above the 50 EMA (Blue Line) moving average. If the upward movement continues, it may test the 200 EMA (Black Line) moving average as resistance. Candle closes below the 50 EMA may experience a pullback.
On the 4-hour chart, the 50 EMA continued to be below the 200 EMA. This suggests that the bearish trend may continue in the medium term. At the same time, the fact that the price is between both moving averages suggests that the market is currently in a short-term decision-making phase. Chaikin Money Flow (CMF-20) crossed into positive territory; in addition, a decrease in inflows may move CMF into positive territory. Relative Strength Index (RSI-14) continued to move near the neutral level of the positive zone. However, selling pressure has emerged. On the other hand, it also broke the uptrend that started on June 22nd to the downside. This may bring a decline. The $150.67 level stands out as a strong resistance point in case of an uptrend on the back of macroeconomic data or positive news on the Solana ecosystem. If this level is broken upwards, the rise can be expected to continue. If there are pullbacks due to contrary developments or profit realizations, the $ 138.73 level can be tested. In case of a decline to these support levels, the increase in buying momentum may offer a potential bullish opportunity.
Supports 138.73 – 133.74 – 127.21
Resistances 144.35 – 150.67 – 163.80
DOGE/USDT
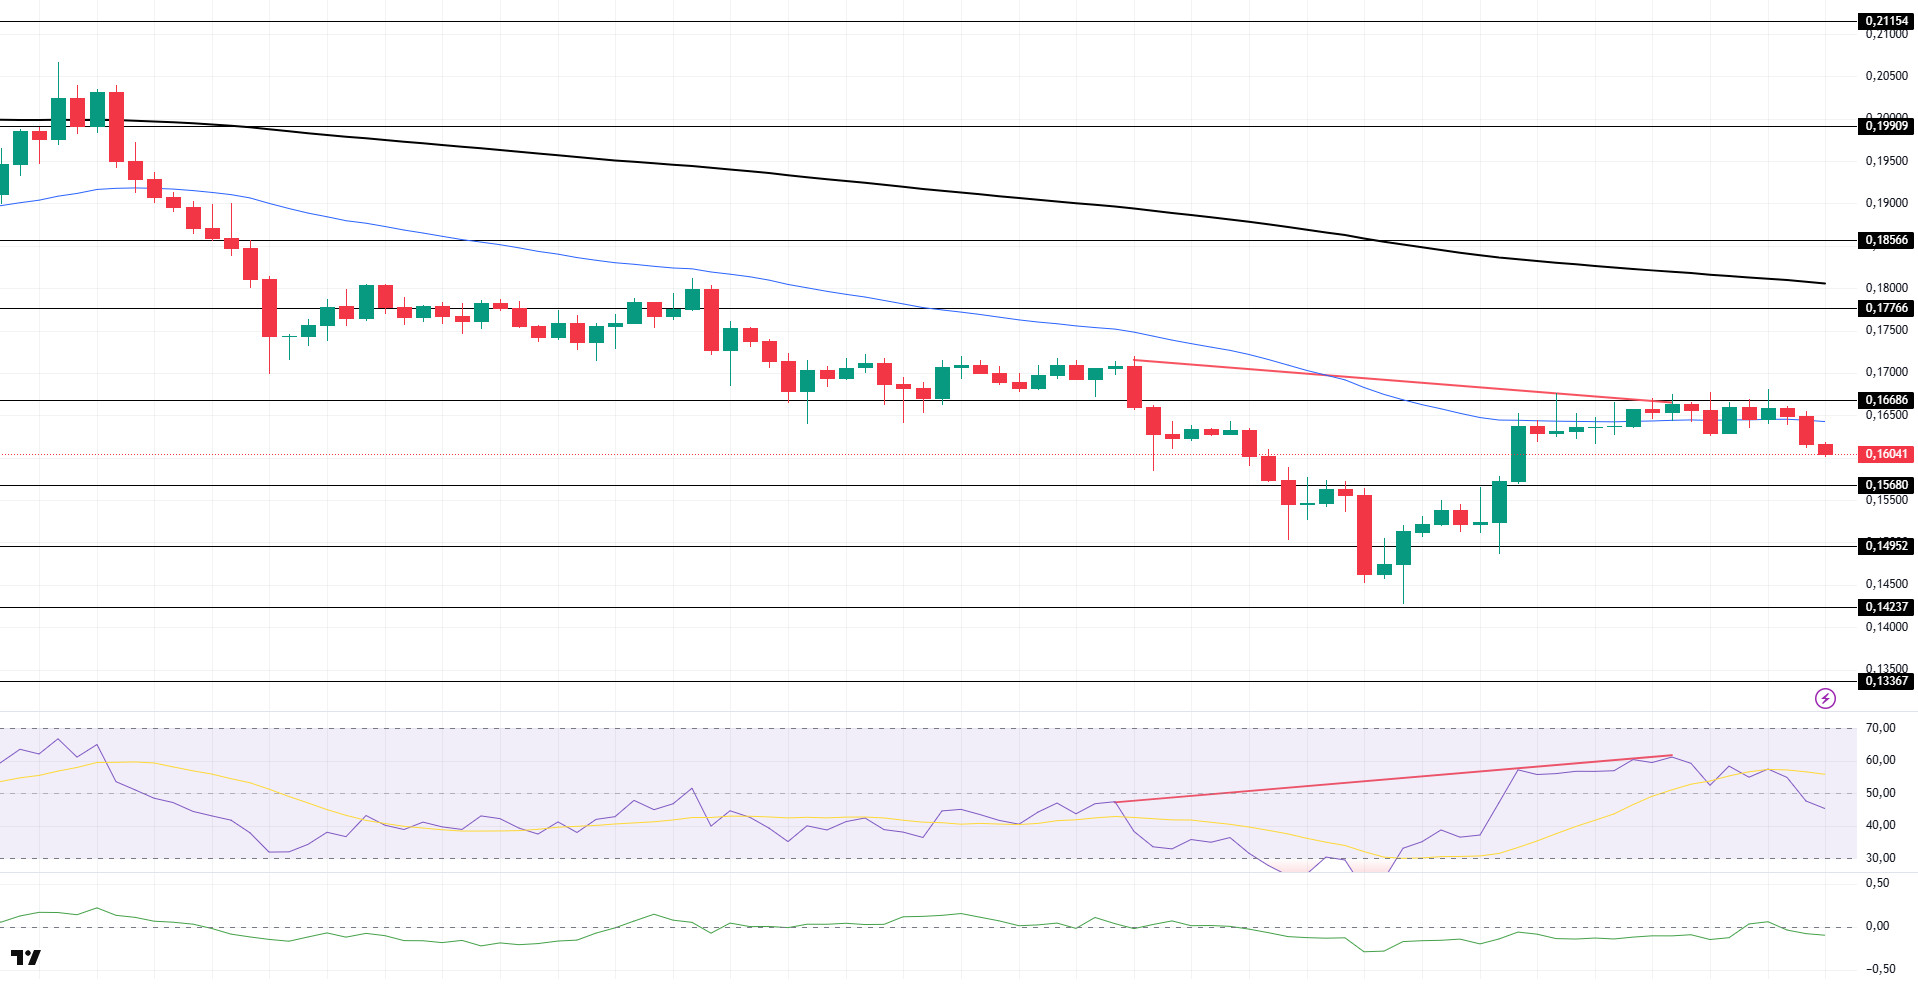
The DOGE price retreated during the day. The asset, which hit strong resistance at $0.16686, failed to break it and started to move below the 50 EMA (Blue Line) moving average. If the price continues to retreat, the $0.15680 level should be followed as a strong support.
On the 4-hour chart, the 50 EMA (Blue Line) continues to be below the 200 EMA (Black Line). This suggests that the asset is bearish in the medium term. The fact that the price is below the two moving averages suggests that the asset is negative in the short term. Chaikin Money Flow (CMF-20) remained in negative territory. In addition, negative inflows could push CMF deeper into the negative territory. Relative Strength Index (RSI-14) moved into negative territory. However, there is a bearish mismatch. These may deepen the decline. The $0.16686 level stands out as a strong resistance zone in the upside in line with political developments, macroeconomic data or positive news flow in the DOGE ecosystem. In the opposite case or possible negative news flow, the $0.15680 level may be triggered. In case of a decline to these levels, the momentum may increase and a new bullish wave may start.
Supports 0.15680 – 0.14952 – 0.14237
Resistances 0.16686 – 0.17766 – 0.18566
Legal Notice
The investment information, comments and recommendations contained herein do not constitute investment advice. Investment advisory services are provided individually by authorized institutions taking into account the risk and return preferences of individuals. The comments and recommendations contained herein are of a general nature. These recommendations may not be suitable for your financial situation and risk and return preferences. Therefore, making an investment decision based solely on the information contained herein may not produce results in line with your expectations.