
Technical Analysis
BTC/USDT
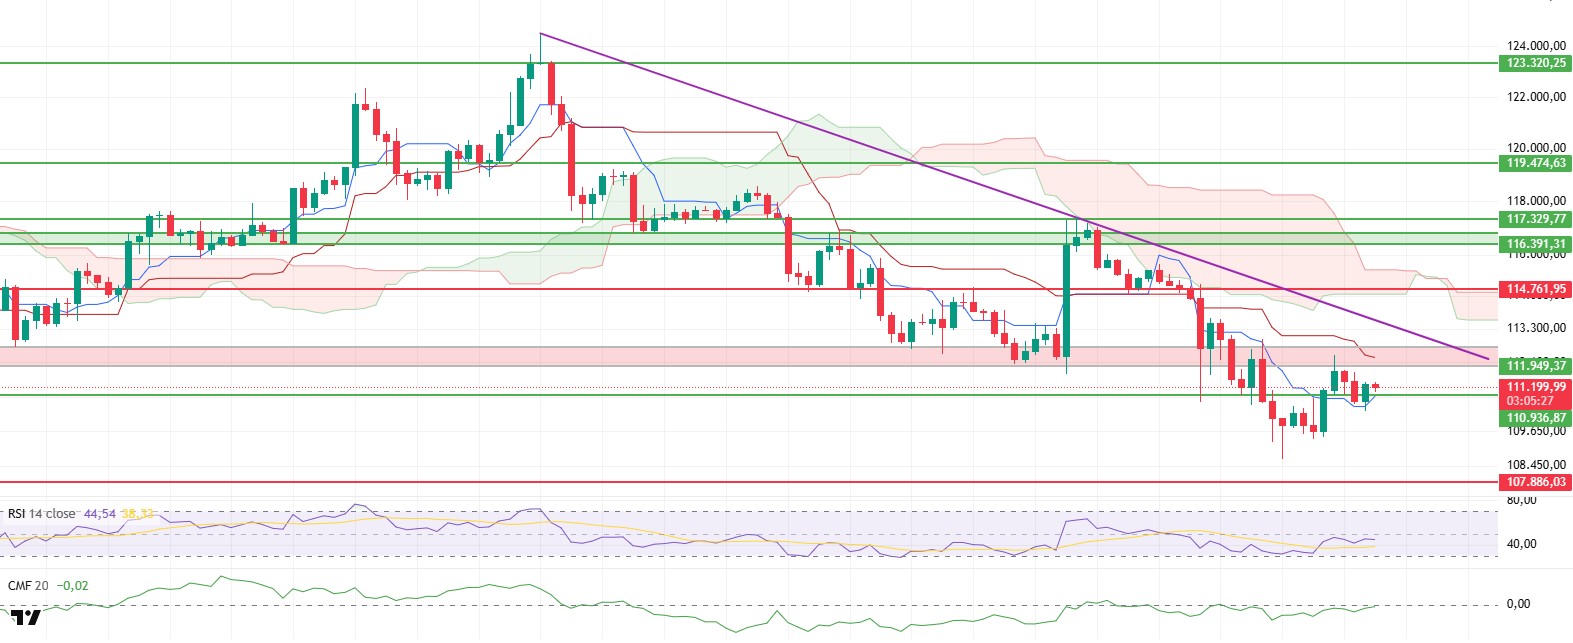
Although the BTC price fell below the $110,936 level with a limited pullback during the day, losses were quickly offset by strong buyers entering the market in this region, and the price managed to rise above the critical level again. This movement shows that the market is still resilient in protecting its strong support zones and that investors view short-term pullbacks as buying opportunities. Although the decline in trading volume throughout the day and the weakening of buying appetite create a cautiously optimistic short-term outlook, the price holding above support signals that the upward trend remains intact.
The Chaikin Money Flow (CMF) indicator rising to the zero line indicates an increase in liquidity entering the market. The CMF value moving from negative territory to the zero line generally indicates that buyers are gaining strength and that fund flows are returning to the market. This is an important signal that selling pressure is weakening and demand is increasing. Especially when approaching critical resistance levels, the increase in liquidity stands out as an important factor supporting the upward movement of the price.
The fact that the price is still moving below the lower band of the Ichimoku cloud indicates that the market has not yet entered a fully strong uptrend. However, the re-crossing of the Tenkan level and the upward momentum gained by the Tenkan line can be considered an important development supporting the short-term positive outlook. This structure reveals that, despite the weak outlook below the cloud, there is a strong desire for recovery in the short term. In particular, the sharp upward movements of the tenkan line confirm that buyers have regained momentum.
The Relative Strength Index (RSI) indicator continuing its upward movement above its moving average indicates that price momentum is beginning to recover. If the RSI manages to remain above the 50 level, the uptrend is more likely to gain momentum, and the probability of the price advancing toward upward targets will increase.
When evaluating the overall outlook, if BTC manages to hold above the $110,936 level in the evening hours, buyers are expected to gain strength and push the price to the $112,670 level. If this level is broken, the trend could gain momentum towards higher bands and market confidence could increase. However, if the support level is lost, the price could retreat to $107,886 as selling pressure accelerates. Therefore, it is crucial to closely monitor trading volume and momentum indicators as well as price movements.
Support levels: 110,936 – 107,886 – 105,213
Resistance levels: 111,949 – 114,761 – 116,391
ETH/USDT
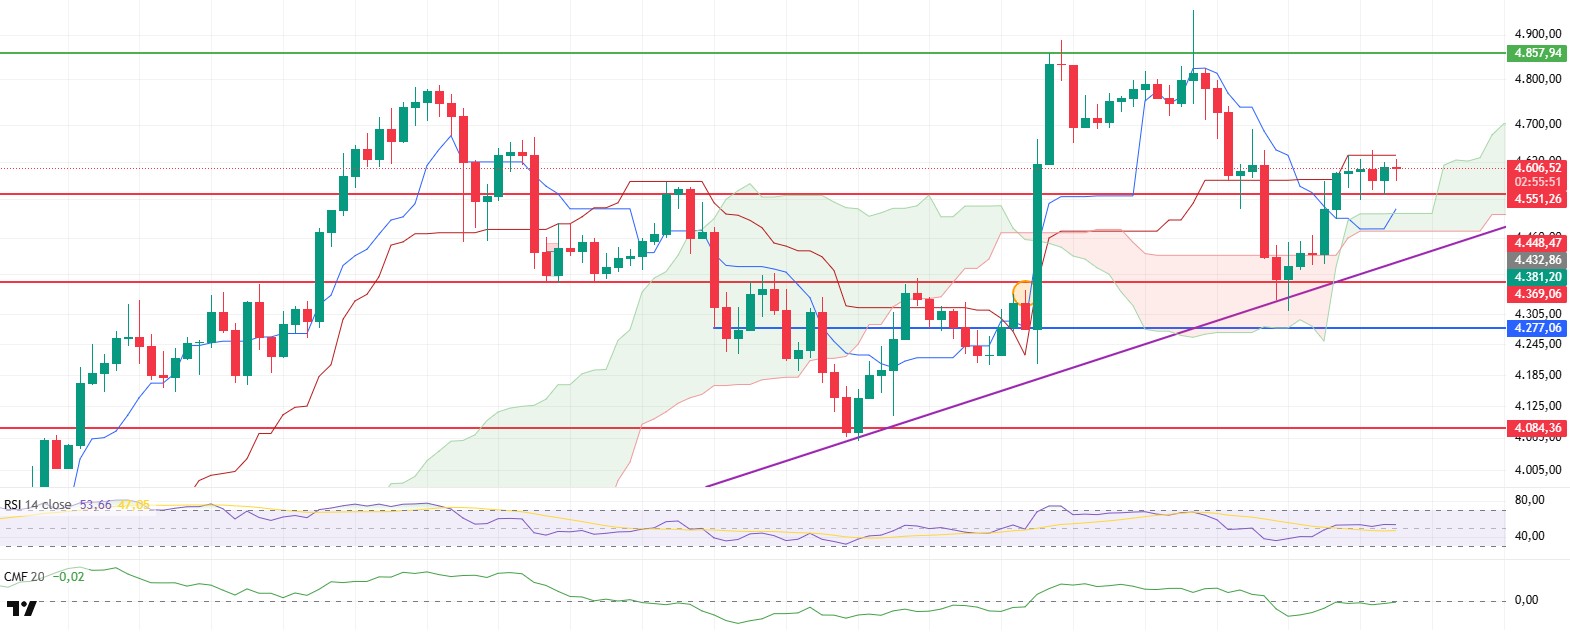
The ETH price experienced a horizontal consolidation process during the day between the kijun line at $4,634 and the main support zone at $4,551. The price being stuck in this narrow range indicates that investors are searching for direction and that upcoming breakouts in the short term will play a decisive role in determining the continuation of the trend. While most technical indicators maintaining a positive outlook signals strong upward potential, price reactions at critical support and resistance levels stand out as the key factors that will clarify the market’s direction.
The Relative Strength Index (RSI) indicator being above both its moving average and the 50 level confirms that price momentum is strengthening. This rise in the RSI indicates that buyers are regaining dominance in the market and that the upward movement is based on sound fundamentals. In particular, the RSI’s progress towards the 60 level may cause the short-term upward momentum to accelerate further. This strengthening of momentum is an important indicator that increases the likelihood of an upward breakout from the price range.
In the Ichimoku indicator, the price moving above the kumo cloud and the tenkan line remaining above it further improves the technical outlook. The tenkan line maintaining its upward trend is a strong signal confirming that the short-term trend is progressing in favor of buyers. In particular, the price remaining above the cloud indicates that the market has moved into a safer upward zone and that support levels have strengthened. This picture reveals that the upward scenario is technically supported.
The Chaikin Money Flow (CMF) indicator moving into positive territory signals a renewed strong liquidity inflow into the market. This development confirms that investor appetite for buying is increasing and selling pressure is gradually decreasing. If the CMF maintains its upward trend, it is likely that the price will find the necessary capital inflow for an upward breakout. Such volume-supported liquidity increases typically bring about sustained upward movements.
When evaluating the overall outlook, if ETH manages to maintain its position above the $4,634 kijun line, the upward trend is expected to continue. An increase in closes above this level could support a gradual rise in price towards the $4,750 and then $4,900 levels. However, losing the main support at the $4,551 level could increase selling pressure and pave the way for the price to retreat towards the trend line marked in purple on the chart.
Support levels: 4,551 – 4,369 – 4,277
Resistance levels: 4,857 – 5,000 – 5,346
XRP/USDT
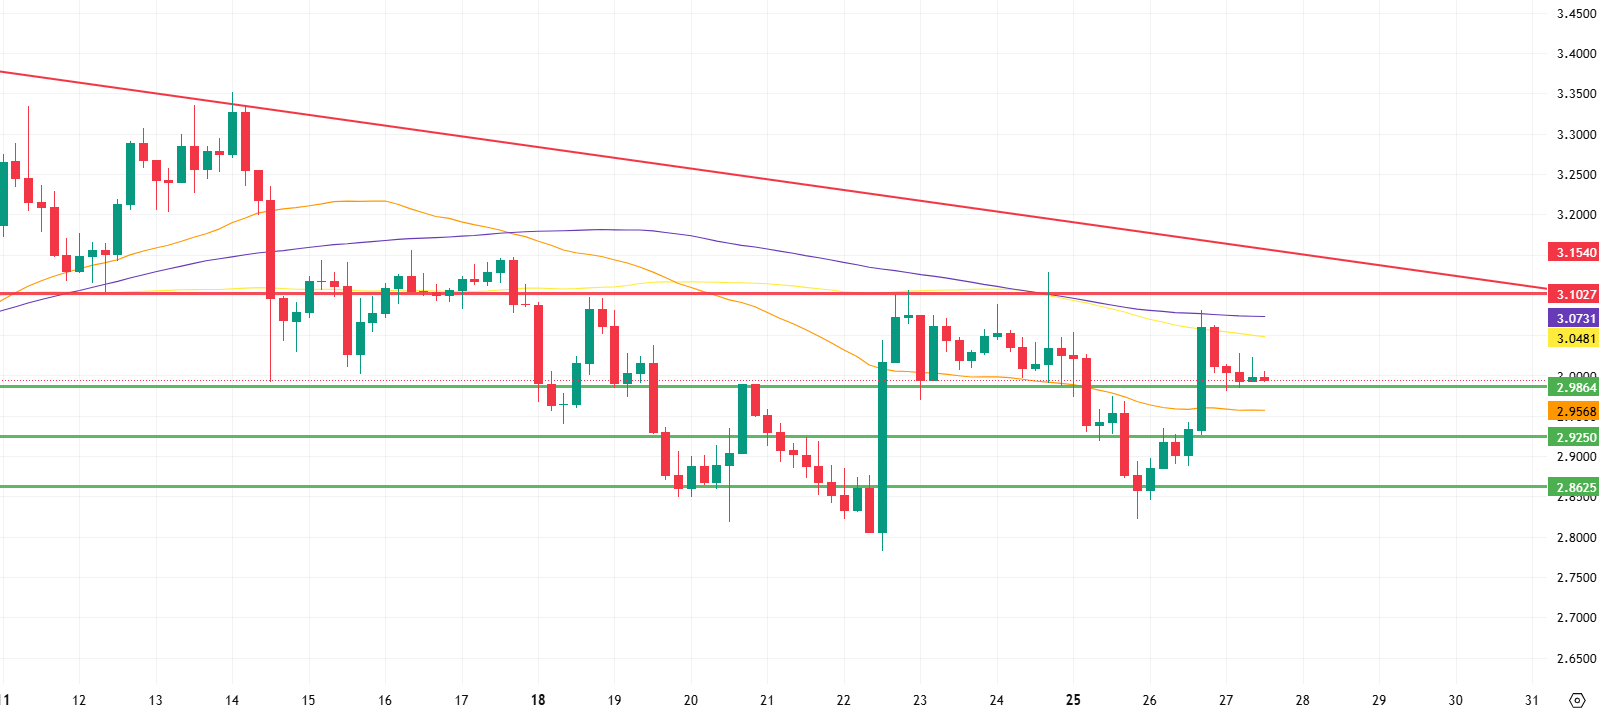
The XRP/USDT pair retreated by 0.57% during the day. Compared to Bitcoin, it saw a 0.11% increase in value. After pulling back to its first support level twice during the day, it is maintaining its current position with small rebound purchases. The price, which is trading above the 50-period moving average (orange line), continues to be suppressed below the 100 and 200-period moving averages (yellow and purple lines).
The 200-period moving average, which retreated to 3.0731, continues its downward movement over time, increasing its pressure on the price. This situation brings downward scenarios to the forefront in the current outlook. Firstly, the 2.9864 level is an important support position where the selling pressure in the market could be balanced by reactions, as it did during the day, and buyers could re-enter the market. However, a break below this level with high volume could pave the way for a strengthening of the downward trend and a pullback to the 2.9250 level. If there is insufficient reaction at the 2.9250 level and the price remains below the 50-period moving average, selling pressure is expected to accelerate, causing the pair to show a weak performance. In intraday pricing, the 2.8625 level stands out as the strongest support. As long as a very negative scenario does not emerge in the market, the price is likely to hold in this region and recover with rebound buying. Therefore, the breakout of the 2.9864 and 2.9250 levels should be closely monitored; 2.8625 can be tracked as the strongest support point where potential pullbacks could trigger a sharp rebound in the short term.
In an uptrend scenario, once the 200-period moving average crosses the 3.0731 level, an initial acceleration towards the 3.1027 level can be expected. The 3.1027 level stands out as a strong major resistance, and the selling pressure encountered in this region is likely to be more intense compared to previous resistance levels. Therefore, the price reaction at this level will be a critical stage in determining whether the short-term upward trend will be maintained. If buyers can absorb the selling pressure at 3.1027 and sustain upward momentum, the price is likely to extend the range and advance to the 3.1702 level. The 3.1702 level is an important short-term threshold and also represents the point where the current downtrend is passing. The probability of this level being permanently exceeded during the day should be considered relatively low. Therefore, while the 3.1702 level is seen more as a potential profit-taking zone, any developments at this level will directly impact the short-term upward trend.
Supports 2.9864 – 2.9250 – 2.8625
Resistances 3.0731 – 3.1027 – 3.1540
SOL/USDT
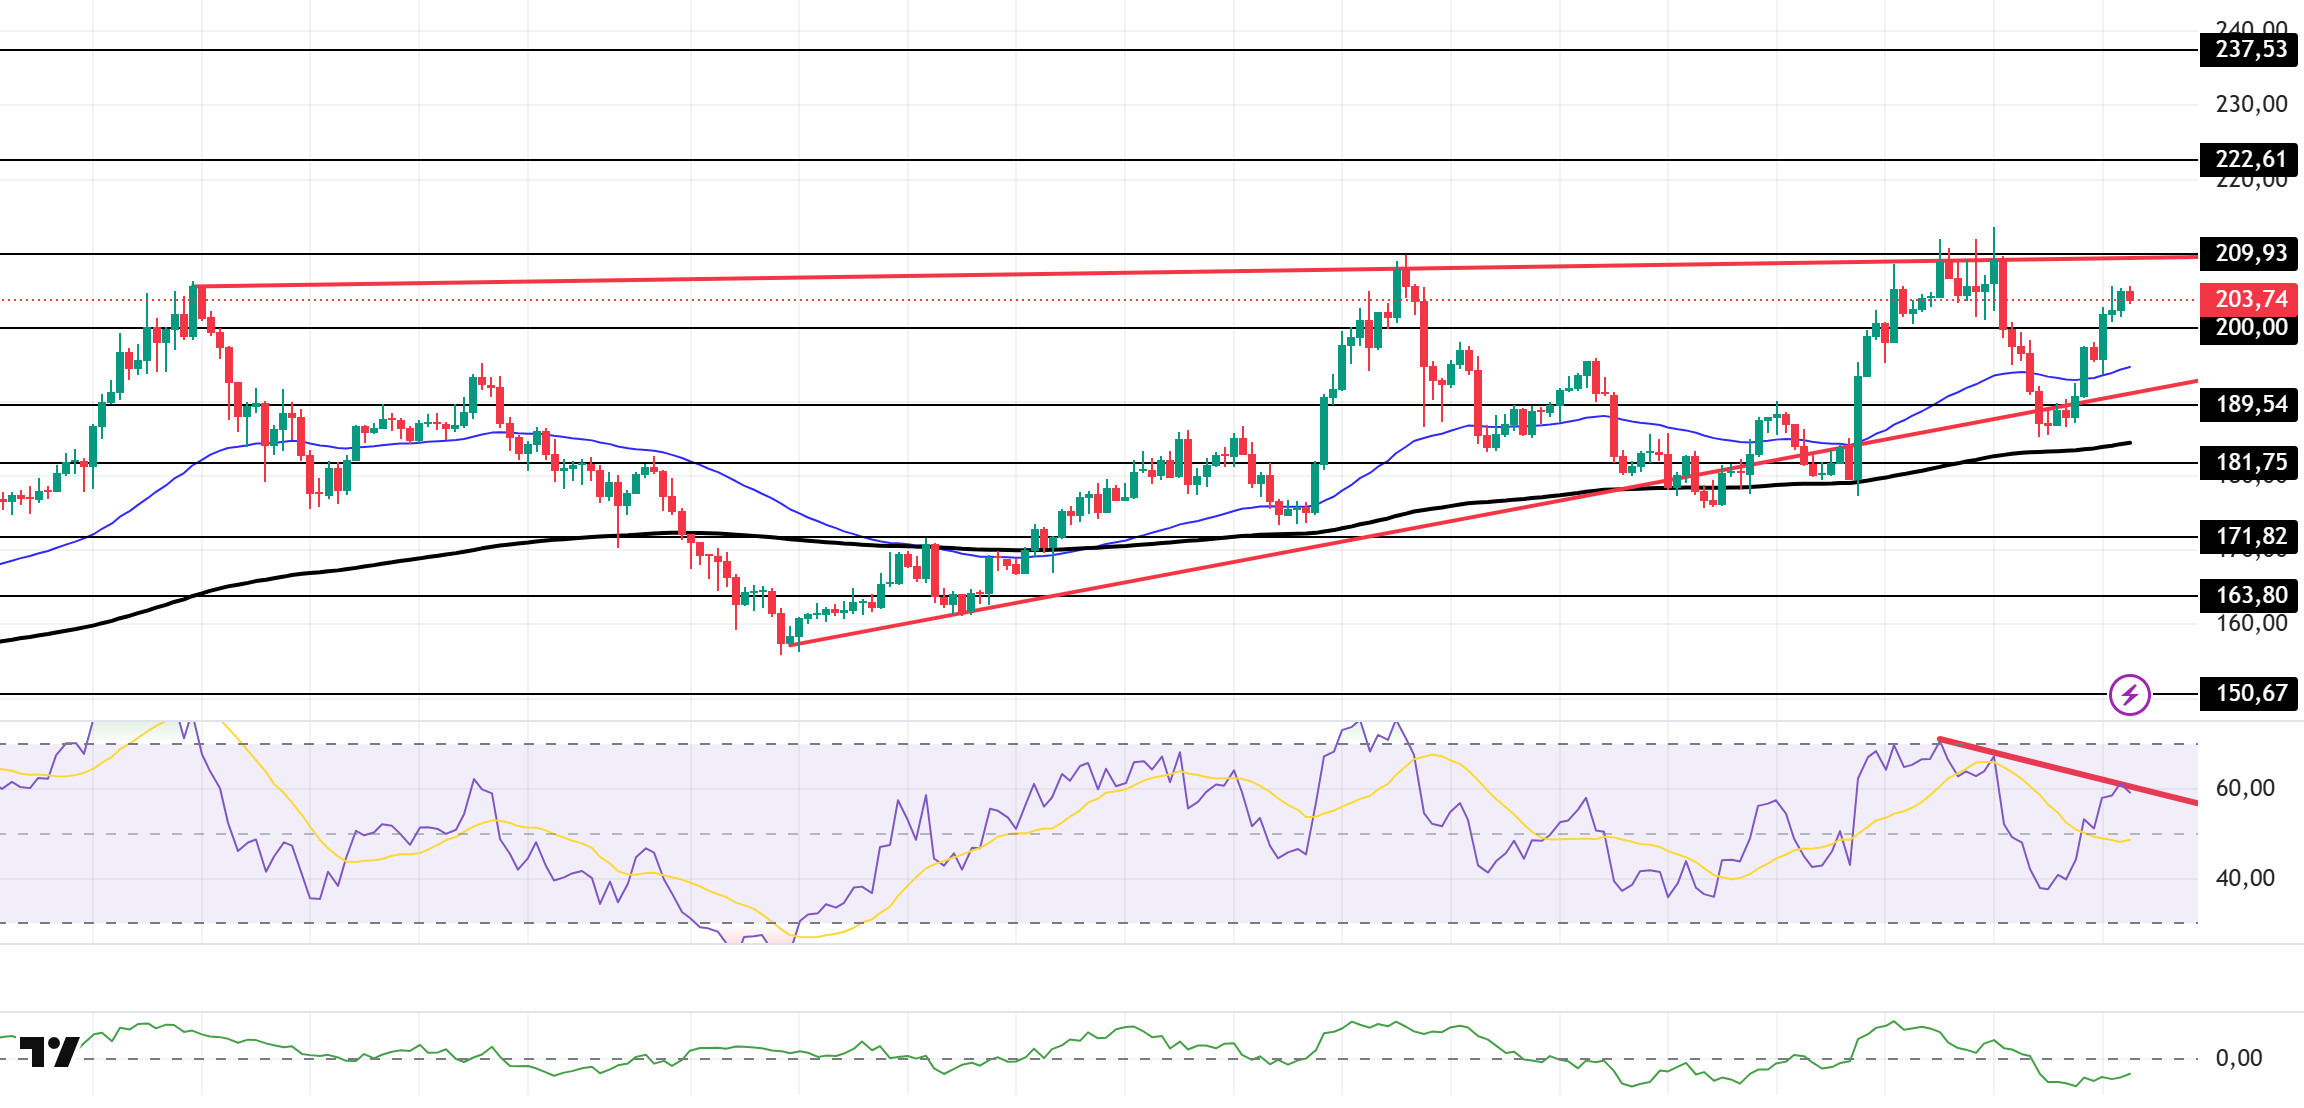
The SOL price rose slightly during the day. The asset continued to trade within the rising wedge formation that began on August 2. If the uptrend continues, it may test the ceiling level of the rising wedge formation. If a pullback begins, it may retest the $200.00 level as support.
On the 4-hour chart, the 50 EMA (Exponential Moving Average – Blue Line) remained above the 200 EMA (Black Line). This indicates that the medium-term upward trend may continue. At the same time, the price being above both moving averages shows us that the market is trending upward in the short term. The Chaikin Money Flow (CMF-20) remains in negative territory. However, an increase in money inflows could push the CMF into positive territory. The Relative Strength Index (RSI-14) is currently testing the resistance level of the downtrend that began on August 24. If it breaks through, the uptrend could continue. In the event of an uptrend driven by macroeconomic data or positive news related to the Solana ecosystem, the $209.93 level stands out as a strong resistance point. If this level is broken upwards, the uptrend is expected to continue. In the event of pullbacks due to developments in the opposite direction or profit-taking, the $189.54 level could be tested. A decline to these support levels could increase buying momentum, presenting a potential opportunity for an uptrend.
Supports: 200.00 – 189.54 – 181.75
Resistances: 209.93 – 222.61 – 237.53
DOGE/USDT
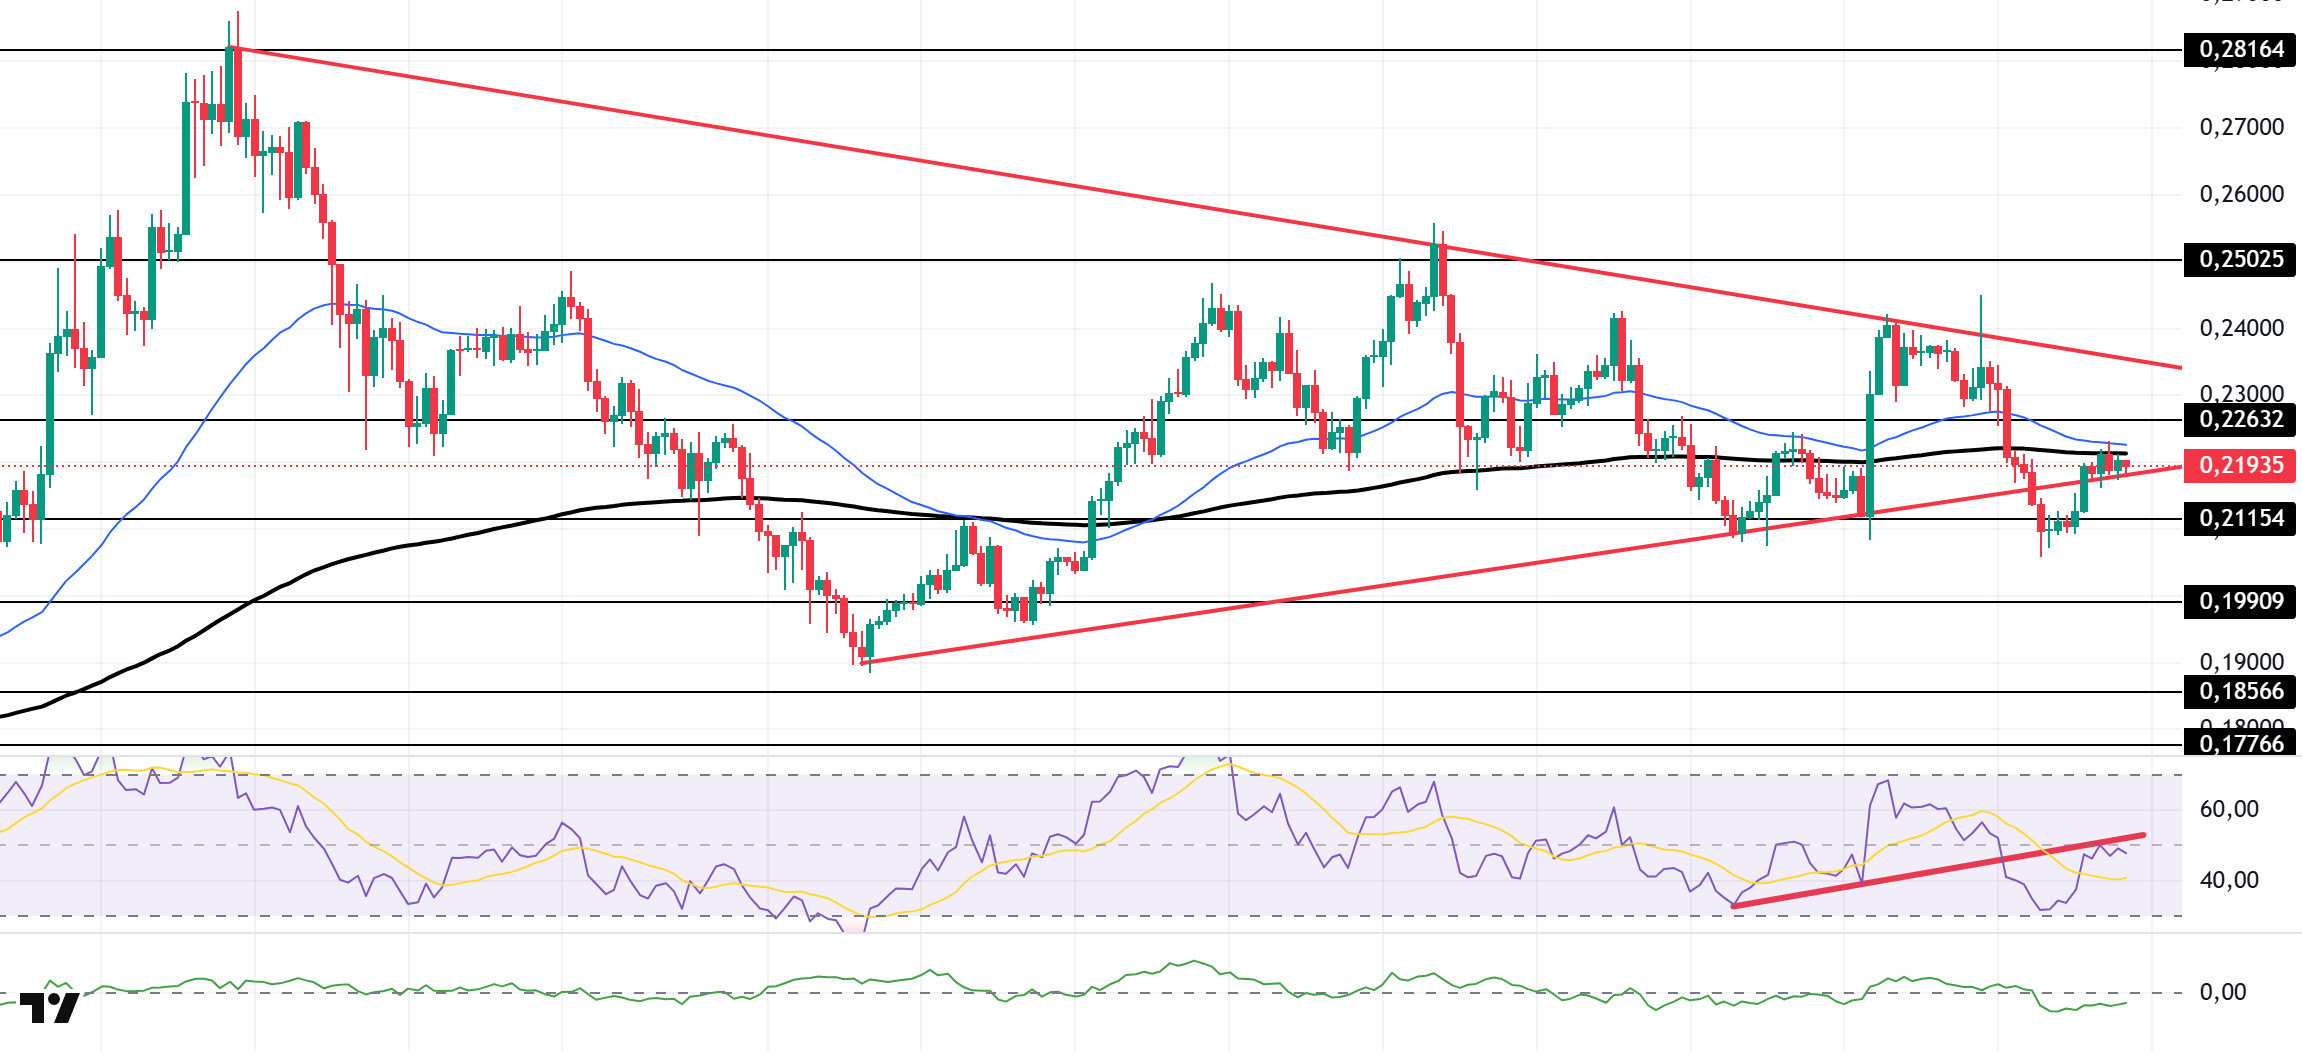
The DOGE price remained flat during the day. The asset continued to trade within the symmetrical triangle formation that began on August 2. The price tested the 50 EMA (Exponential Moving Average – Blue Line) moving average as resistance, found resistance there, and is currently testing the base level of the formation as support. If the pullback continues, the $0.21154 level should be monitored. If the uptrend continues, the $0.22632 level should be monitored.
On the 4-hour chart, the 50 EMA (Blue Line) continues to remain above the 200 EMA (Black Line). This indicates that the asset is in an upward trend in the medium term. The price being below both moving averages indicates that the asset is also trending downward in the short term. The Chaikin Money Flow (CMF-20) remained in negative territory. Additionally, a decrease in money inflows could push the CMF deeper into negative territory. The Relative Strength Index (RSI-14) has fallen into negative territory. At the same time, it is currently testing the resistance level of the upward trend that began on August 19. If it breaks through, upward pressure may increase. In the event of an upward movement driven by political developments, macroeconomic data, or positive news flow in the DOGE ecosystem, the $0.22632 level stands out as a strong resistance zone. Conversely, in the event of negative news flow, the $0.21154 level could be triggered. A decline to these levels could increase momentum and potentially initiate a new upward wave.
Supports: $0.21154 – $0.19909 – $0.18566
Resistances: 0.22632 – 0.25025 – 0.28164
TRX/USDT
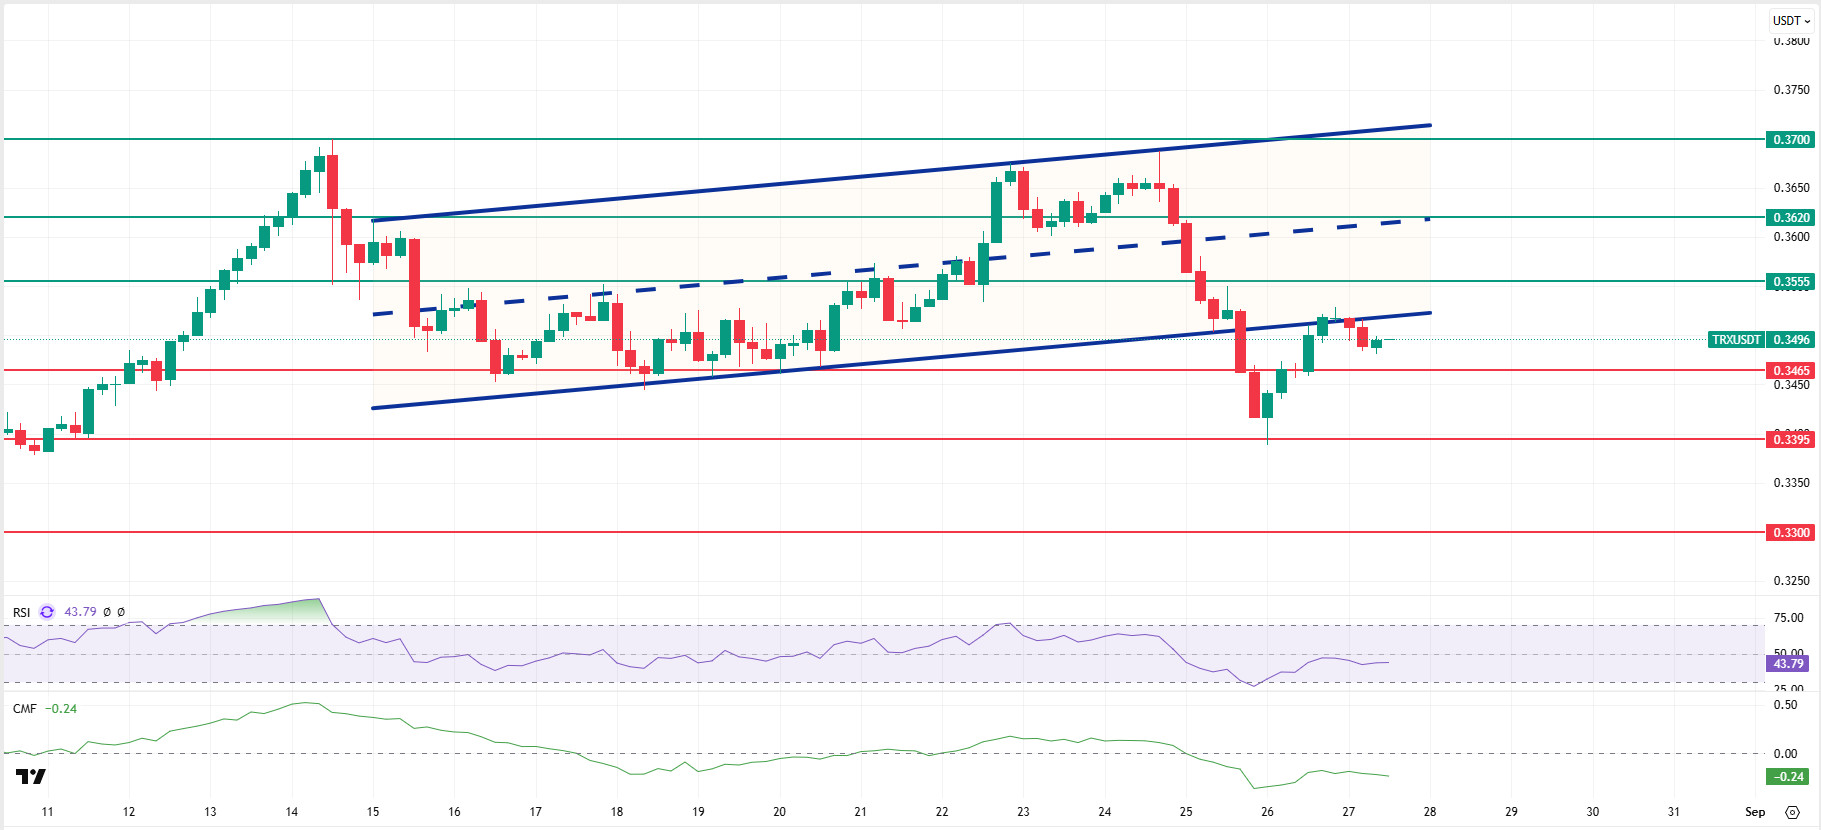
As mentioned in this morning’s analysis, despite the decline, TRX managed to stay above the 0.3465 support level and is currently trading at 0.3496 due to selling pressure from the lower band of the bullish channel. Currently below the bullish channel, TRX is hovering near the 0.3465 support level on the 4-hour chart. The Relative Strength Index (RSI) value of 43 indicates that it is in the sell zone. In addition, the Chaikin Money Flow (CMF) indicator continues to remain below zero with a value of -0.24, indicating a decrease in cash inflows. The CMF being in negative territory shows that buyers are weak and that selling pressure may continue to affect the price.
In light of all these indicators, TRX may test the 0.3465 support level with a slight decline in the second half of the day. After that, it may gather strength with the buying reaction coming from this support and move towards the bullish channel to test the 0.3555 resistance level. If it fails to close above the 0.3465 support level, it may continue to decline due to the continuation of capital outflows that could occur as the CMF remains in negative territory. As a result, it may test the 0.3395 and 0.3300 support levels in sequence.
On the 4-hour chart, 0.3300 is an important support level, and as long as it remains above this level, the upward momentum is expected to continue. If this support level is broken, selling pressure is expected to increase.
Supports: 0.3465 – 0.3395 – 0.3300
Resistances: 0.3555 – 0.3620 – 0.3700
LTC/USDT
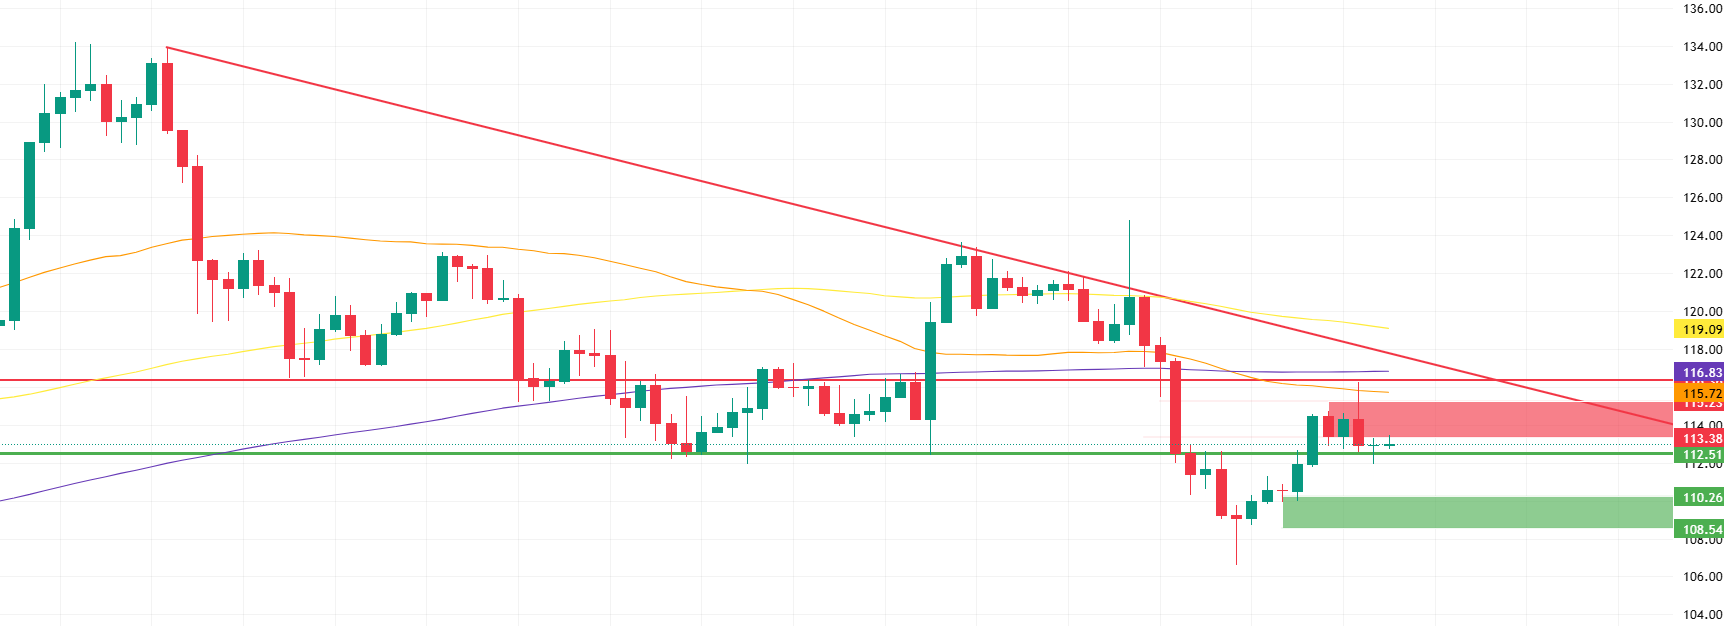
A limited 0.18% pullback against USDT during the day and a 0.39% positive divergence in the Bitcoin pair are noteworthy. LTC’s current situation presents a classic squeeze formation. As time narrows within the horizontal support-resistance range, the price paints a picture of being “stuck between two walls.” In such situations, volume typically decreases, and the direction of the price breakout becomes critical. In short, LTC is currently in an indecisive zone. To determine the direction, we need to watch for a breakout from this narrow band.
Along with buying at the support level, the price needs to achieve sustained closes above the major resistance band of 113.38–115.23 (red zone on the chart). Breaking above this band stands out as the first important threshold for whether buyers will gain strength in the short term and is a critical indicator for the continuity of the uptrend. If the price manages to break through this resistance band with high trading volume, the next target will be the horizontal resistance at the 116.36 level. This area should be monitored as a focal point where new selling pressure could emerge. In particular, the price reaction at the 116.36 level will be a critical stage that will determine whether the upward momentum will continue.
If the 110.26 level is broken downwards, the likelihood of selling pressure retreating slowly to the next support area at 108.54 will increase. The important point to note here is that the 110.26 and 108.54 levels are not separate support points, but actually form a support band. Since this band is formed by Fibonacci retracement levels, it serves as a technically strong reference zone. Therefore, the price reaction within this band will play a critical role in determining the short-term market direction. Especially if there is a sustained break below the band, the technical outlook will shift to a much weaker picture, and the likelihood of deeper sell-offs will increase.
Supports: 112.51 – 110.26 – 108.54
Resistances: 113.38 – 115.23 – 116.36
SUI/USDT
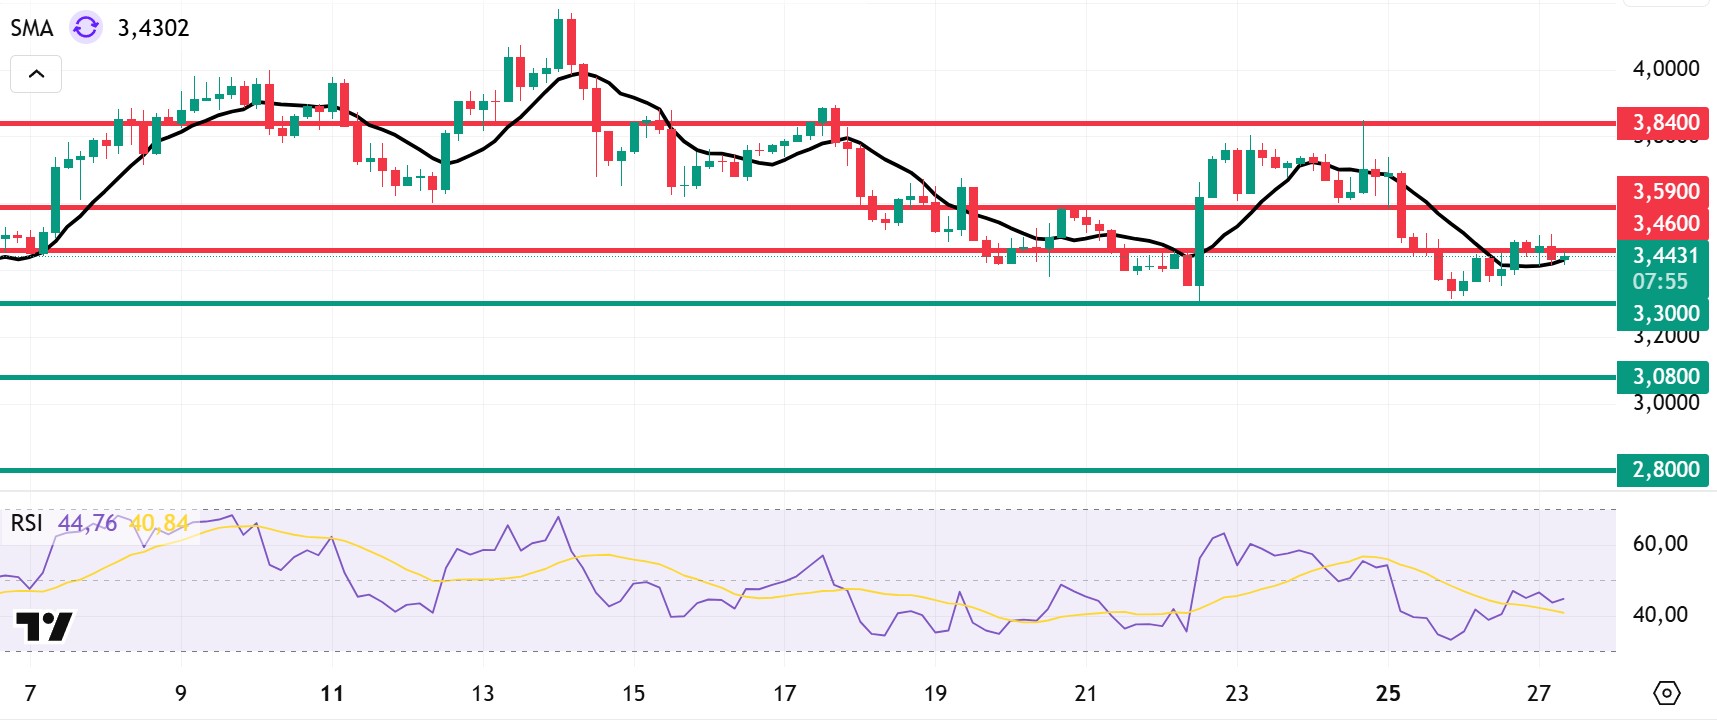
Looking at Sui’s technical outlook, we see that the price has declined on a weekly basis to around $3.44, influenced by fundamental developments. The Relative Strength Index (RSI) is currently in the range of 44.76 – 40.84. This range indicates that the market is trading close to the sell zone; however, if the RSI weakens and falls to the 30.00 – 35.00 range, it could signal a potential buying point. If the price moves upward, the $3.46, $3.59, and $3.84 levels can be monitored as resistance points. However, if the price retreats to new lows, it could indicate that selling pressure may deepen. In this case, the $3.30 and $3.08 levels stand out as strong support zones. In particular, in the event of a sharp sell-off, a pullback to $2.80 appears technically possible.
According to Simple Moving Averages (SMA) data, Sui’s average price is currently at $3.43. The price remaining below this level indicates that the current downtrend could technically continue. The downward trend of the SMA also supports this situation.
Supports: 2.80 – 3.08 – 3.30
Resistances: 3.46 – 3.59 – 3.84
Legal Notice
The investment information, comments, and recommendations contained herein do not constitute investment advice. Investment advisory services are provided individually by authorized institutions taking into account the risk and return preferences of individuals. The comments and recommendations contained herein are of a general nature. These recommendations may not be suitable for your financial situation and risk and return preferences. Therefore, making an investment decision based solely on the information contained herein may not produce results in line with your expectations.

