
Technical Analysis
BTC/USDT
Fed Chair Jerome Powell stated that the shutdown could force the December meeting and that the lack of data could slow interest rate moves; following this statement, the probability of an interest rate cut fell from 66.9% to 55.9%. As US Treasury yields remained flat, investors focused on the upcoming data flow. President Trump announced that the 43-day shutdown caused $1.5 trillion in economic losses and emphasized that the government should not shut down again. On-chain data showed that long-term Bitcoin holders are turning to profit-taking, indicating that the market may enter a more volatile period in the short term.
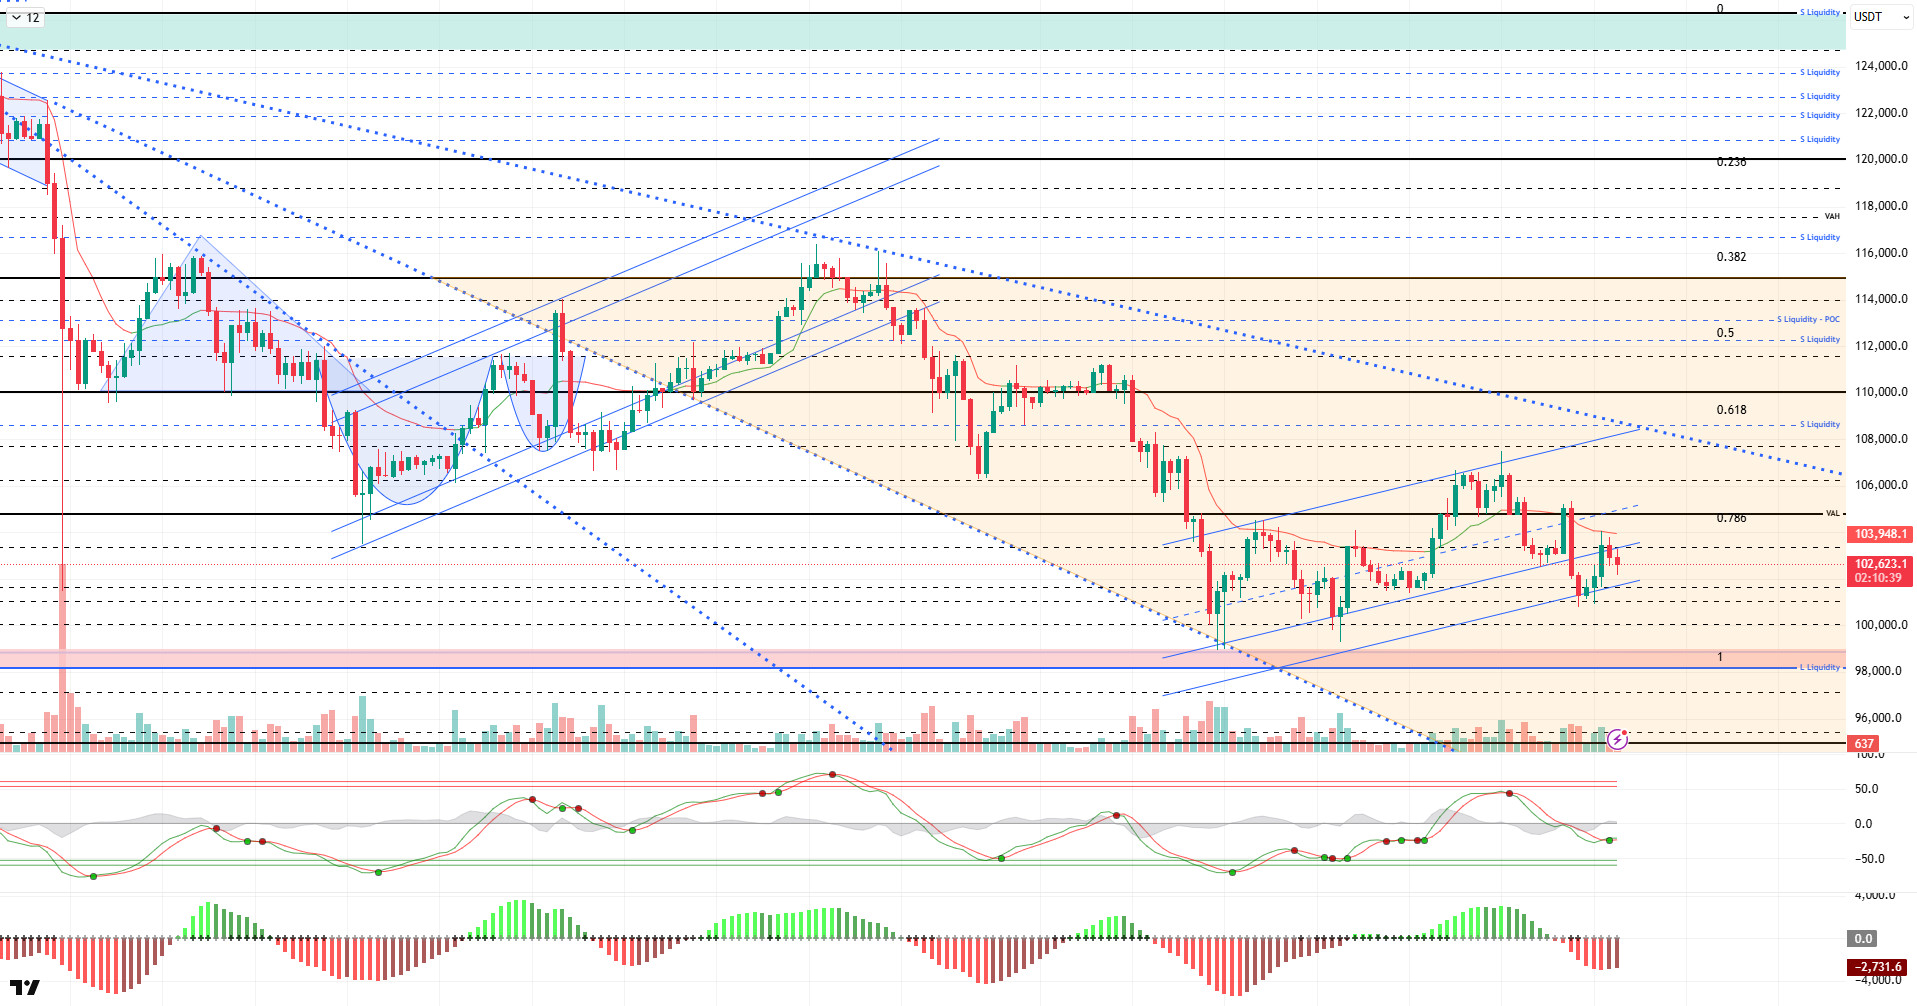
From a technical perspective, the price, which tested the 103,300 resistance level in the previous analysis, has not yet broken through and has retreated to the 102,300 level within the trend extension. Struggling to gain momentum on the upside, BTC continues its sideways-upward movement, while low volume is noteworthy. BTC, which continues its downward trend from its ATH level, still lacks a catalyst.
Technical indicators have withdrawn the buy signal given in the middle band of the parallel channel, parallel to the sell signal given by Wave Trend (WT) in the overbought zone, and have given a new buy signal just above the oversold zone. The Momentum (SM) indicator’s histogram continues its momentum within the negative zone. The Kaufman Moving Average (KAMA) is currently at $103,900, positioned above the price.
According to liquidation data, trading clusters at the 100,000 – 102,000 level were liquidated with the recent decline. In a broader time frame, the buying level maintains its accumulation at the $98,000 level. Selling levels are gaining intensity in the short term at the $105,000 level, while accumulation has formed at the $107,500 level in a broader time frame.
In summary, the 49-day shutdown officially ended following the US Senate vote. While Fed members remain divided on interest rate cuts, Fed Chair Powell highlighted the lack of data and maintained his cautious stance. Trump emphasized the heavy toll of the government shutdown and argued that it should not happen again. In liquidity data, the selling pressure continues to prevail. Technically, the price is currently moving within a minor upward channel and continues to test the 103,300 resistance level. The price’s potential to regain the 105,000 area with a new catalyst will continue to be monitored as a top priority, and if it breaks through, the 107,400 resistance will be watched. On the other hand, in the event of a possible selling pressure, the first support level is 101,800, and if it breaks, the 100,000 reference point comes into play.
Supports: 101,800 – 100,000 – 98,000
Resistances: 103,300 – 105,000 – 106,600
ETH/USDT
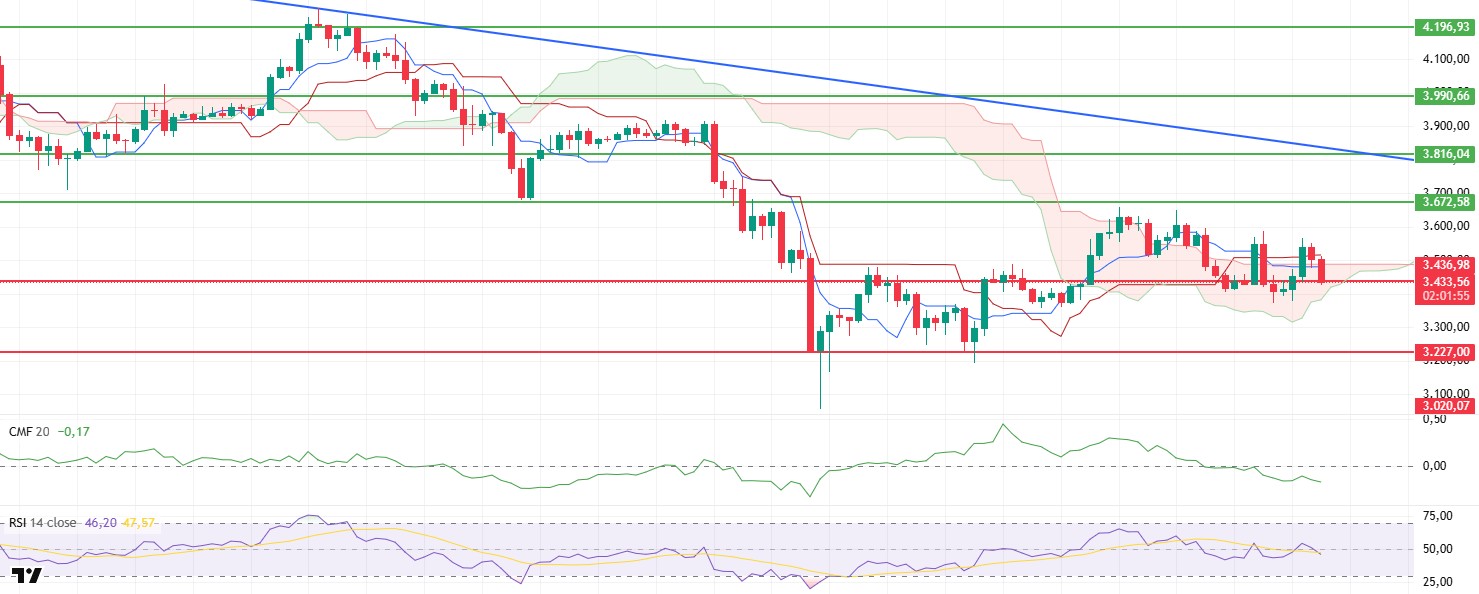
The Ethereum price rose to $3,567 in the morning hours but then reversed course amid increasing selling pressure during the day, retreating to the $3,436 intermediate support zone. The weak outlook seen throughout the day indicates that the market is struggling to find the strength to sustain upward momentum.
The decline in the Chaikin Money Flow (CMF) indicator continues. The weak liquidity flow reveals that buyers are unable to provide sufficient support to the market and that the upward movements are not sustainable. The CMF’s deepening in the negative zone signals that selling pressure could regain strength in the short term.
The Relative Strength Index (RSI) indicator fell below the 50 level, confirming a loss of momentum. This chart shows that the market has lost its short-term momentum and that a downward trend is beginning to emerge.
In the Ichimoku indicator, the price losing not only the upper band of the kumo cloud but also the Tenkan and Kijun levels has produced a short-term sell signal from a technical perspective. This structure indicates that the market has re-entered negative territory and buyers are losing strength.
Technically, the $3,436 level stands out as the critical support level for the day. If the negative indicators persist, losing this level could accelerate selling pressure and cause the price to fall to the $3,300 level. However, if the $3,436 level is maintained, limited rebound buying could be seen, and the price could initiate a recovery movement back towards the $3,510 level.
Supports: 3,436 – 3,227 – 3,020
Resistances: 3,672 – 3,816 – 3,990
XRP/USDT
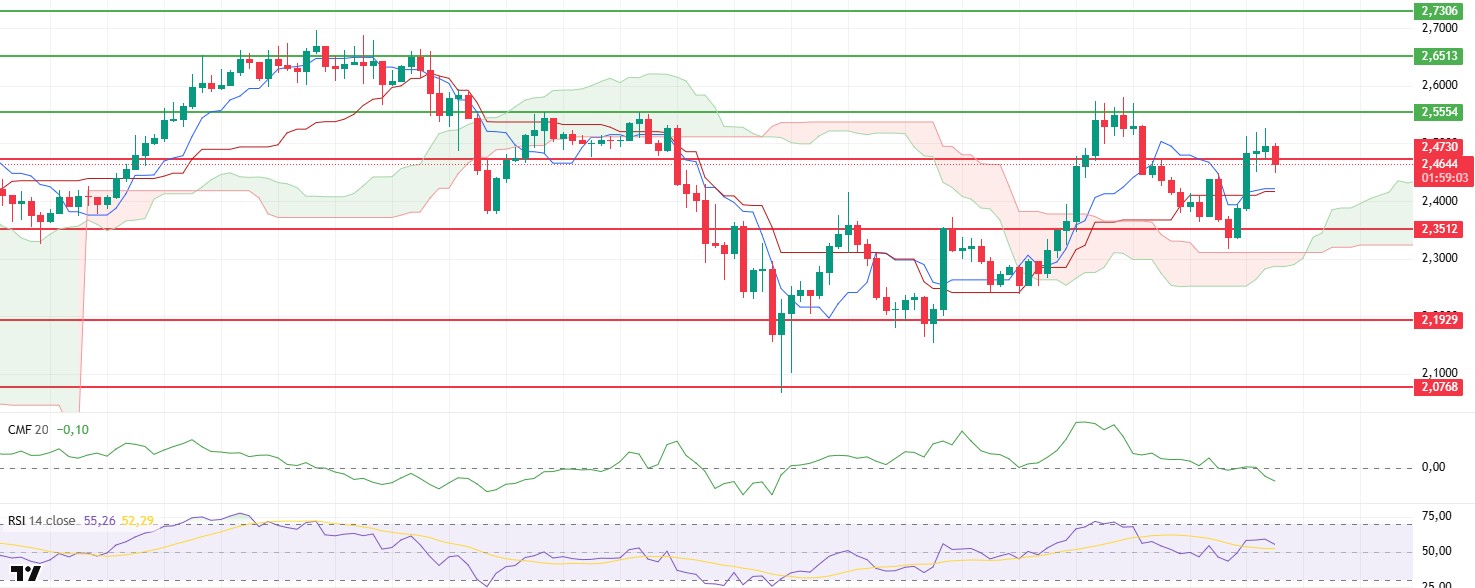
The XRP price experienced a slight pullback during the day due to selling pressure following its morning rally and has fallen below the $2.47 level. This intraday weakness indicates that buyers have lost momentum in the short term and profit-taking has begun to take effect in the market.
The Chaikin Money Flow (CMF) indicator continues its downward movement, signaling that liquidity inflows into the market remain weak. This decrease in buying volume reveals that there is a lack of support for price increases and that the movement has become fragile.
The Relative Strength Index (RSI) indicator is still managing to remain in positive territory despite showing a downward trend. This outlook reflects that, despite some weakening in momentum, buyers have not completely withdrawn from the market and the potential for recovery remains.
In the Ichimoku indicator, the price still trading above the kumo cloud and the Tenkan and Kijun lines maintaining their positive positions indicate that the overall technical structure remains intact. This structure suggests that short-term pullbacks may be limited.
Technically, the $2.47 level is once again a critical threshold. If the price regains this level, it could sustain positive momentum and initiate a recovery toward the $2.55 level. However, if the price remains below $2.47, selling pressure could increase, and the likelihood of a pullback to the $2.35 level could strengthen.
Supports: 2.3512 – 2.1929 – 2.0768
Resistances: 2.4730 – 2.5554 – 2.6513
SOL/USDT
The SOL price traded sideways during the day. The asset remained in the lower region of the downtrend that began on October 6. It also broke below the 50 EMA (Blue Line) moving average and continued to trade below this level. Currently trading above the strong support level of $150.67, the price could test the 50 EMA moving average if the uptrend continues. If the pullback deepens, the $144.35 level could act as support.
The price remained below the 50 EMA (Exponential Moving Average – Blue Line) and 200 EMA (Black Line) on the 4-hour chart. This indicates a possible downtrend in the medium term. At the same time, the price being below both moving averages shows us that the asset is trending downward in the short term. The Chaikin Money Flow (CMF-20) is in negative territory. However, the decrease in money inflows could push the CMF deeper into negative territory. The Relative Strength Index (RSI-14) is in the middle of the negative zone. It also remained below the upward trend that began on November 4. This signaled increased selling pressure. If there is an upturn due to macroeconomic data or positive news related to the Solana ecosystem, the $171.82 level stands out as a strong resistance point. If this level is broken upwards, the uptrend is expected to continue. If pullbacks occur due to developments in the opposite direction or profit-taking, the $138.73 level could be tested. A decline to these support levels could increase buying momentum, presenting a potential upside opportunity.
Supports: 150.67 – 144.35 – 138.73
Resistances: 163.80 – 171.82 – 181.75

DOGE/USDT
The DOGE price traded sideways during the day. The asset remained in the upper region of the upward trend that began on November 4. Currently experiencing a slight pullback, the price is testing the 50 EMA moving average as support. If the candle closes below this level, it may retest the upward trend as support. If the uptrend continues, it may test the 200 EMA (Black Line) moving average and the $0.18566 level as resistance.
On the 4-hour chart, the 50 EMA (Exponential Moving Average – Blue Line) remained below the 200 EMA (Black Line). This indicates that a downtrend may begin in the medium term. The price being between the two moving averages shows that the price is in a decision phase in the short term. The Chaikin Money Flow (CMF-20) remained in the negative zone, close to the neutral zone. Additionally, a decrease in money inflows could push the CMF deeper into the negative zone. The Relative Strength Index (RSI-14) rose to a neutral level. At the same time, it remained below the upward trend that began on November 3, indicating that selling pressure continues. In the event of a rise driven by political developments, macroeconomic data, or positive news flow in the DOGE ecosystem, the $0.18566 level stands out as a strong resistance zone. Conversely, in the event of negative news flow, the $0.15680 level could be triggered. A decline to these levels could increase momentum and initiate a new wave of growth.
Supports: 0.16686 – 0.15680 – 0.14952
Resistances: 0.17766 – 0.18566 – 0.19909

LTC/USDT
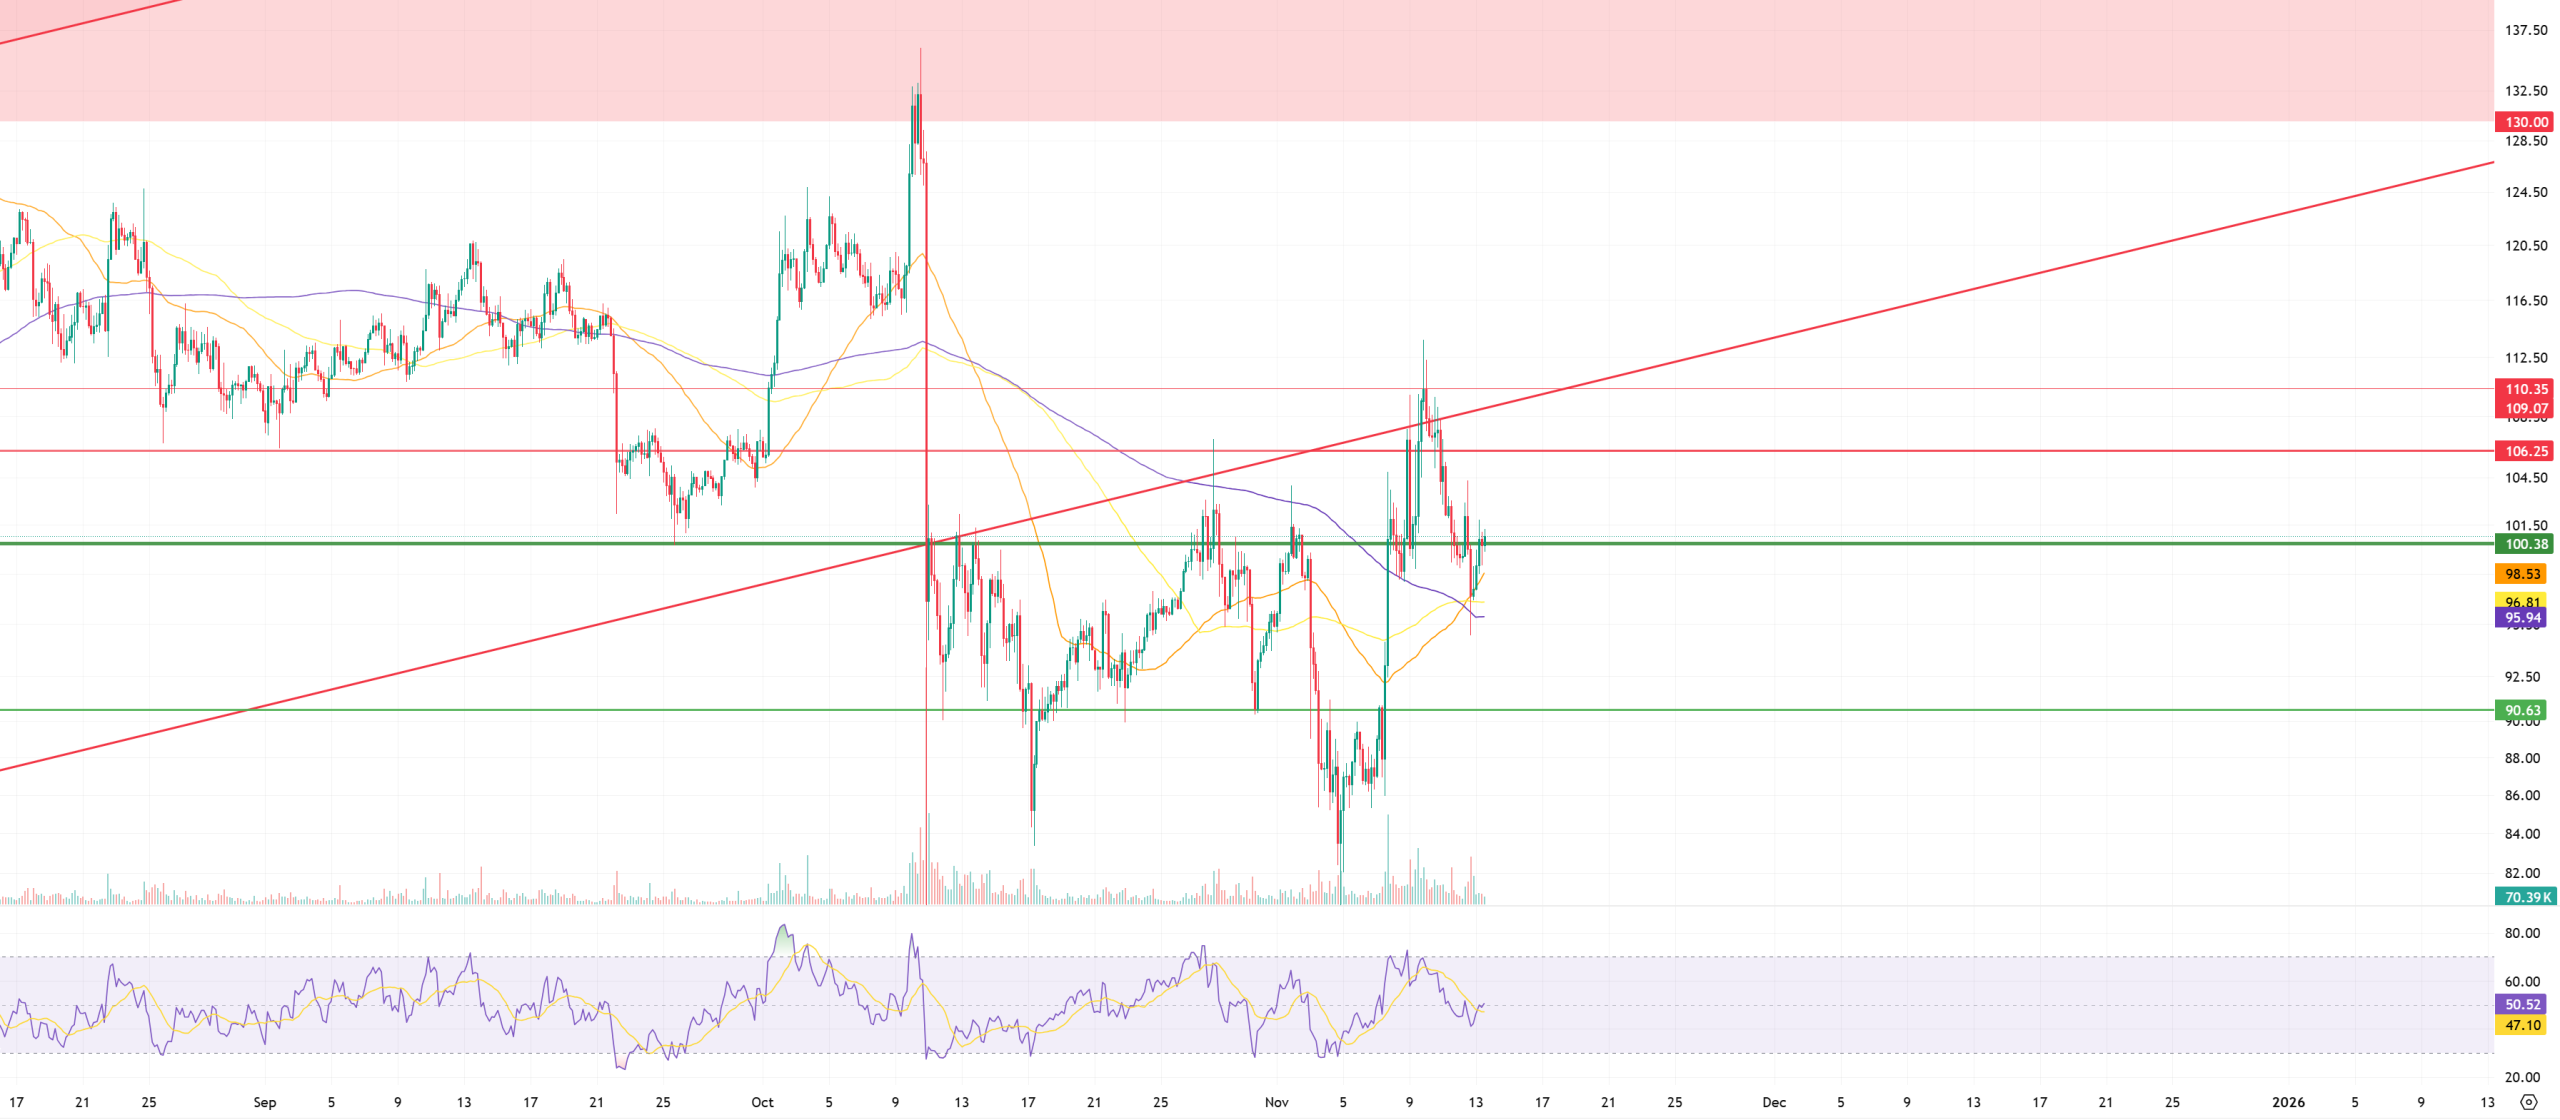
Litecoin (LTC) gained 3.4% against USDT and 2.29% against Bitcoin in the first half of the day, drawing attention. On the futures side, the long/short position ratio opened in the last 24 hours standing at 0.9623 indicates that derivatives market participants generally maintained their bearish expectations despite the morning’s rise. Although the update of funding rates to a neutral to positive range signals that buyers have gained some strength in the short term, the overall picture reveals that a downward movement in the derivatives markets is still predominantly expected for the remainder of the day.
Technically, looking at Litecoin’s (LTC) 4-hour USDT chart, we see that the price continues to trade above all moving averages but below the rising trend. While this situation, combined with the partial weight of short positions in the derivatives market, strengthens expectations of a decline, it should not be forgotten that upward movements are also possible during the day, contrary to general expectations. In this context, if an upward movement occurs, the first strong resistance level will be the horizontal resistance point at the current level of $106.25. Breaking through this level could be an important signal for further price increases. The next significant resistance point will be the rising trend lower band at $109.07. This level stands out as another critical zone where Litecoin’s price movement could stall. If breached, a potential rise to $110.35 could be expected, and this movement could also be interpreted as a signal of change, indicating a retest for short-heavy market conditions. However, at this point, it seems more likely that the price will encounter selling pressure and be rejected.
If a decline in line with expectations occurs, the 100.38 level stands out as an area where the price could initially find support and short positions could be partially closed. If the price remains below this level, the 200, 100, and 50-period moving averages (purple, yellow, and orange), which are quite close to each other on the chart, could provide short-term support for the price. However, if we had to specify a single level, the 95.94 level, where the 200-period average passes, is a critical support level. Below this, the threshold support level of 90.63 could potentially pave the way for more severe price movements. Nevertheless, a break below all these moving averages ( ) and a pullback to the last support level would only become more likely if a strong downward trend develops across the market.
Supports: 100.38 – 95.94 – 90.63
Resistances: 106.25 – 109.07 – 110.35
BNB/USDT
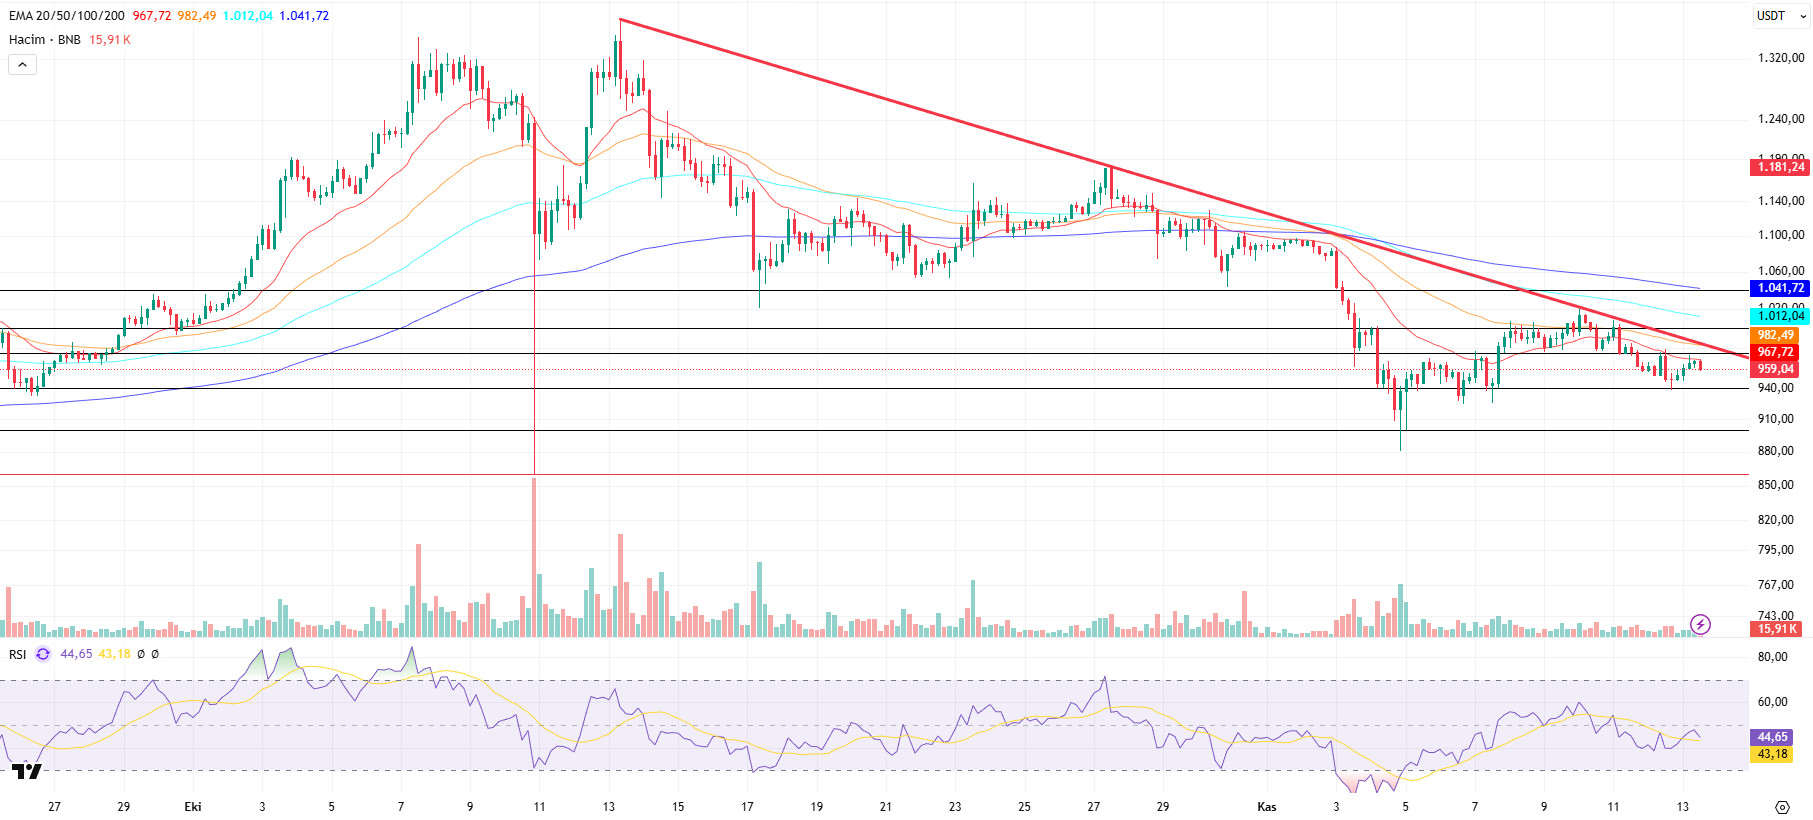
From a technical perspective, the pullback movement in the BNB/USDT pair, which continues within a downward trend, has eased the downward pressure and gradually shifted its direction upward. However, the pair continues to trade below the downward trend line.
Given the current outlook, BNB/USDT presents a positive picture in the short term, but it continues to search for direction due to selling reactions below the downward trend line.
Technical indicators for BNB, currently trading in the $940–975 range, show that the low trading volume in recent periods has limited the positive outlook. However, it is observed that the current volume levels do not have sufficient strength to break the downward trend. Furthermore, although the Relative Strength Index (RSI) indicator briefly rose above the 50 level due to recent purchases, it has resumed a downward trend due to weak momentum.
Based on the current technical picture, if selling pressure increases, the price is expected to test the $940 support level. If this level is broken downward, there is a possibility that the price will retreat to the $900 and $860 support zones, respectively.
On the other hand, if buying appetite is maintained and market momentum recovers, BNB is likely to retest the $975 resistance level in the first stage. If this level is exceeded, the price is expected to rise above the downtrend line. If the downward trend breaks upward and stability is achieved at this level, it is technically possible for the price to rise towards the $1,000 and $1,040 levels.
Supports: 940 – 900 – 860
Resistances: 975 – 1,000 – 1,040
Legal Notice
The investment information, comments, and recommendations contained herein do not constitute investment advice. Investment advisory services are provided individually by authorized institutions taking into account the risk and return preferences of individuals. The comments and recommendations contained herein are of a general nature. These recommendations may not be suitable for your financial situation and risk and return preferences. Therefore, making an investment decision based solely on the information contained herein may not produce results in line with your expectations.


