Technical Analysis
BTC/USDT
US President Donald Trump announced that he is considering negotiating with Democrats on healthcare to end the government shutdown. While the White House reported that the shutdown is costing the economy $150 billion per week, the Trump administration imposed a 25% tariff on large truck imports. Kansas City Fed President Jeff Schmid opposed interest rate cuts, noting that inflation remains high. The People’s Bank of China increased its gold reserves for the 11th consecutive month, while Alameda Research transferred 500 BTC to a BitGo wallet.
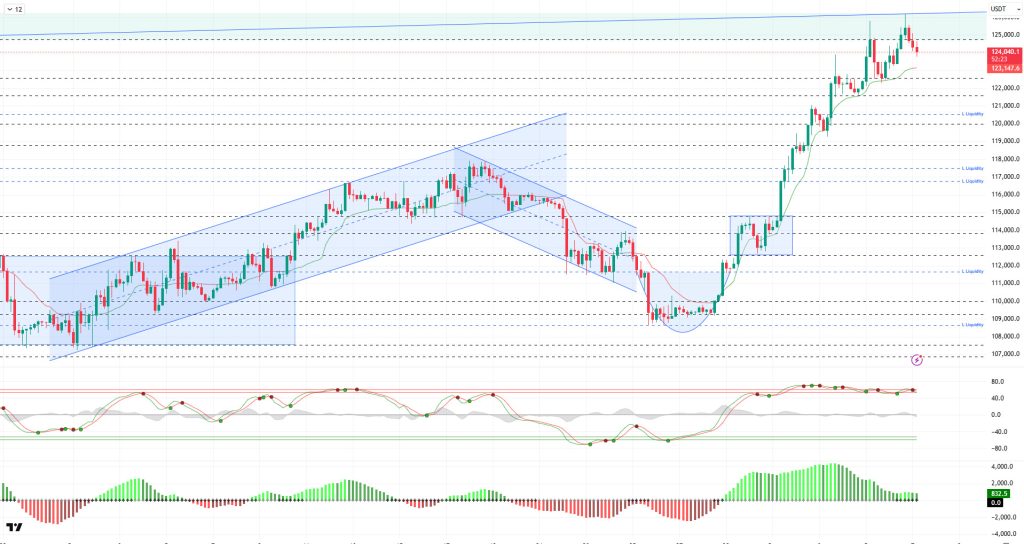
Looking at the technical picture, BTC continued the rally it started in the last week of September, adding another attempt to reach a new peak. Yesterday, BTC reached an ATH of $126,198, where it faced selling pressure. Having achieved price stability near the peak, BTC is currently trading at around $124,000.
Technical indicators show indecisive movements, with the Wave Trend oscillator (WT) producing consecutive buy-sell signals in the overbought zone. The Squeeze Momentum (SM) indicator continues its momentum within the positive area of the histogram while showing negative divergence. The Kaufman moving average is currently trading below the price at the 123,140 level.
Looking at liquidation data, the selling tier has started to re-emerge with the recent upward movement, and a heavy accumulation was recorded at the 126,400 level. In contrast, the buying tier maintained its intensity at the 120,000 level. Additionally, buying intensity continued at the 117,800 and 116,600 levels. The liquidation amount of buy-side transactions in the last 24 hours was $15 million, while sell-side transactions were recorded at $48 million. The total market liquidation amount reached $353 million.
In summary, while the US government shutdown had no significant impact on the markets, the differing views of Fed members on interest rate cuts and the return of tariffs to the agenda were among the prominent developments. The negative outlook for short-term interest rate cuts regained strength with interest rate cut expectations rising to 98%. On the BTC side, it recorded an 8.24% increase in October, a month in which double-digit averages were achieved in terms of cyclical movements, making a strong entry and testing a new ATH level. The technical outlook reached saturation point with the price testing the 125,750 ATH level, while liquidity data set a precedent by rising and resisting the cycle. From this point on, in the event of a possible correction, the minor support level will be 122,700, while 120,500 will be monitored as a critical reference area. If the rise continues, we will follow the ATH level and then the psychological resistance areas.
Supports: 122,700 – 121,400 – 120,500
Resistances: 124,300 – 125,700 – 129,000
ETH/USDT
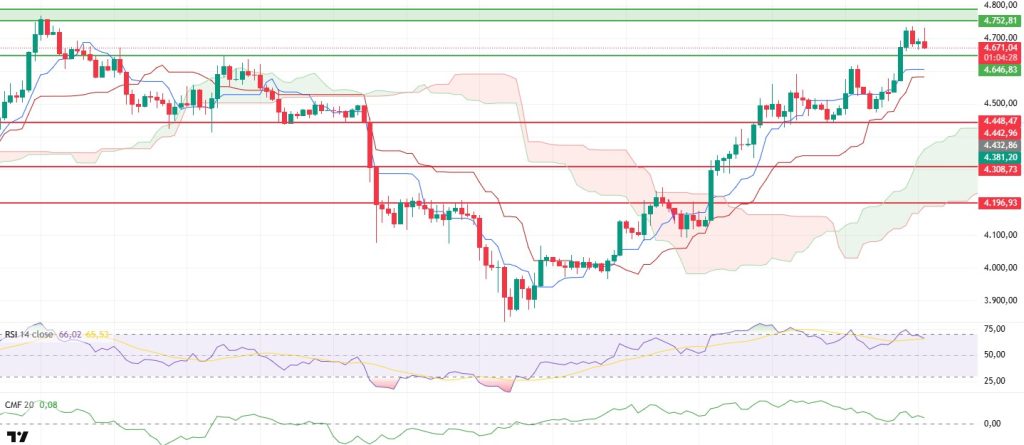
The ETH price rose above the $4,641 resistance level yesterday as expected, reaching $4,735. The overall structure of the movement shows that the market still maintains its upward trend, but buyers have started to act cautiously in the high ranges.
The Relative Strength Index (RSI) indicator signaled a reversal after reaching the overbought zone. The indicator’s downward movement from this zone suggests that the price may enter a short-term correction phase. This slowdown in the RSI indicates that although the upward momentum is weakening, there is no clear trend reversal in the overall market structure yet.
The Chaikin Money Flow (CMF) indicator, however, failed to gain upward momentum despite the price increase. The CMF hovering near the zero line indicates that liquidity entering the market remains limited and the rise is not supported by strong capital inflows. This scenario could create short-term pressure on the price’s upward movement, especially in an environment where institutional buying remains weak.
The overall outlook of the Ichimoku indicator remains positive. The price still trading above the kumo cloud confirms that the main trend is upward. The Tenkan and Kijun lines moving close to each other suggests that the short-term directional search continues and that a possible breakout could result in sharp movements.
The overall outlook indicates that a slight pullback may continue in the short term due to the weakness in technical indicators. The $4,646 level retains its importance as an intermediate support. If the price falls below this level, it could drop to $4,441. On the upside, the $4,752 level is a critical resistance point. Sustained closes above this resistance could enable the market to regain strong upward momentum.
Supports: 4,646 – 4,441 – 4,308
Resistances: 4,646 – 4,752 – 4,857
XRP/USDT
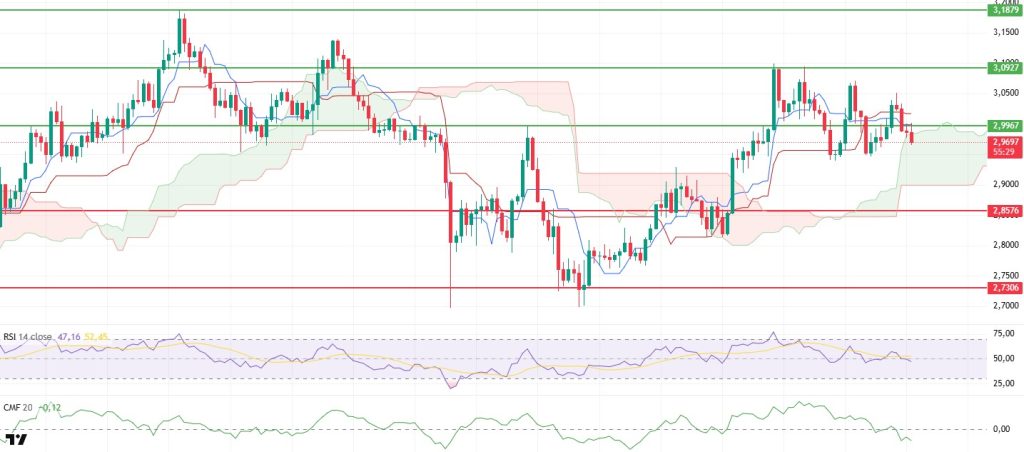
The XRP price failed to hold above the $2.99 level yesterday evening, facing selling pressure and falling to $2.96. While the daily outlook remains weak, buyers’ influence in the market appears to be waning. Each time the price fails to break above the $3.00 threshold, selling accelerates, indicating that the market is turning downward in the short term.
The Chaikin Money Flow (CMF) indicator continues its downward movement in negative territory, revealing an intensification of liquidity outflows. This trend in the CMF confirms that capital continues to flow out of the market and that sellers have taken control. The weakness in liquidity flow makes it difficult for upward attempts to be sustained and causes the price to remain under downward pressure.
The Relative Strength Index (RSI) indicator has fallen below the 50 level, clearly showing a loss of momentum. The RSI’s horizontal movement in this region indicates that buyers have not regained control of the market and that the price is likely to test lower levels.
In the Ichimoku indicator, the price falling below both the Tenkan and Kijun levels and retreating into the kumo cloud confirms the strengthening of the downward trend. Entering the cloud signals that the market has entered a directionless zone in the short term and that the trend has begun to turn negative.
Overall, XRP’s failure to hold above the $2.99 level could lead to continued selling pressure. In the short term, $2.85 is the most critical support level. If this level is broken, selling could accelerate, and the price could pull back to around $2.80. On the other hand, if the price closes above $2.99 again, it could be seen as the first sign of a short-term recovery.
Supports: 2.8576 – 2.7306 – 2.6513
Resistances: 2.9967 – 3.0927 – 3.1879
SOL/USDT
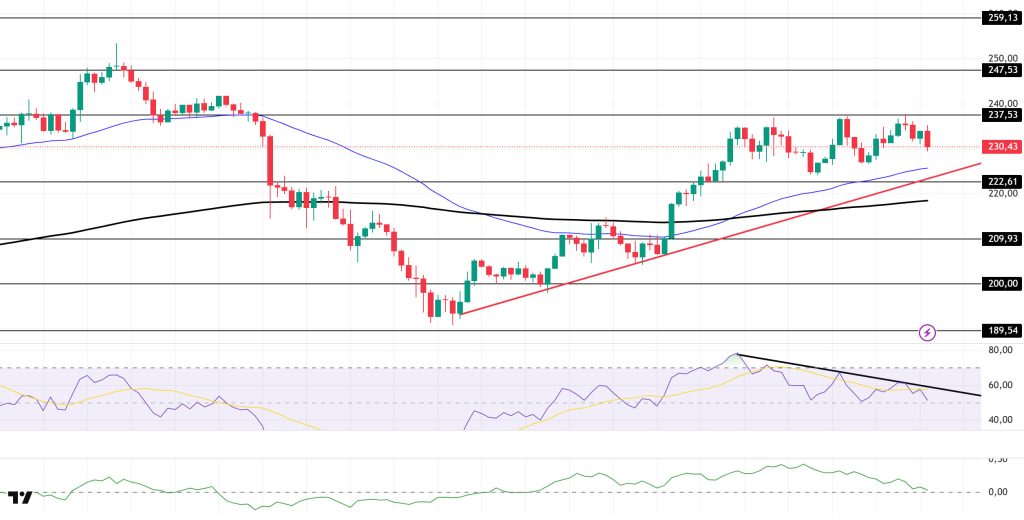
The SOL price traded sideways. The asset continues to trade in the upper region of the upward trend that began on September 26. The price, which continues to trade above the 50 EMA (Blue Line) and 200 EMA (Black Line) moving averages, tested the strong resistance level of $237.53 but failed to break through and retreated. As of now, it continues to stay above the strong support level of $222.61, maintaining its momentum. If the upward movement continues, it may retest the $237.53 level. In case of pullbacks, the $209.93 level can be monitored.
On the 4-hour chart, it remained above the 50 EMA (Exponential Moving Average – Blue Line) and 200 EMA (Black Line). This indicates a possible medium-term uptrend. At the same time, the price being above both moving averages shows us that the asset is trending upward in the short term. The Chaikin Money Flow (CMF-20) remained in positive territory. However, a decrease in money inflows could push the CMF into negative territory. The Relative Strength Index (RSI-14) continues to remain in the positive zone. At the same time, it continued to remain in the lower zone of the downward trend that began on October 2. This signaled that the downward pressure continues. In the event of an upturn due to macroeconomic data or positive news related to the Solana ecosystem, the $237.53 level stands out as a strong resistance point. If this level is broken upwards, the uptrend is expected to continue. If pullbacks occur due to developments in the opposite direction or profit-taking, the $222.61 level could be tested. A decline to these support levels could increase buying momentum, presenting a potential upside opportunity.
Supports: 222.61 – 209.93 – 200.00
Resistances: 237.53 – 247.53 – 259.13
DOGE/USDT
Bitwise filed an updated version of its Dogecoin ETF.
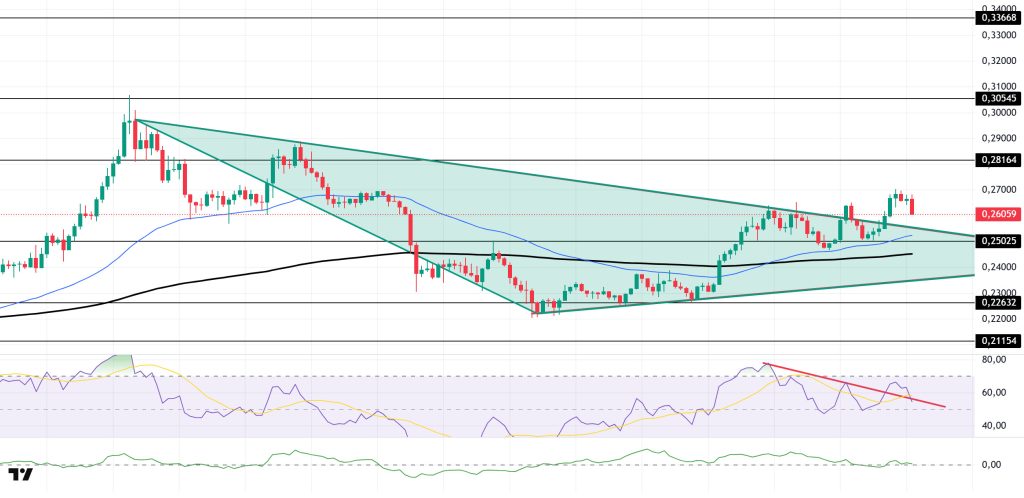
The DOGE price traded sideways. The asset broke above the ceiling level of the symmetrical triangle formation that began on September 14, signaling increased buying pressure. Currently managing to stay above the symmetrical triangle formation, the asset could test the $0.28164 level as resistance if the uptrend continues. In case of a pullback, it could test the $0.22632 level as support on candle closes below the moving average.
On the 4-hour chart, the 50 EMA (Exponential Moving Average – Blue Line) remained above the 200 EMA (Black Line). This indicates that an uptrend may begin in the medium term. The price being above both moving averages shows that the price is trending upward in the short term. The Chaikin Money Flow (CMF-20) experienced a slight rise towards the positive zone. Additionally, a decrease in money inflows could push the CMF into negative territory. The Relative Strength Index (RSI-14) broke above the downward trend that began on October 2. This could increase buying pressure. However, it is currently testing this trend as support. In the event of an uptrend driven by political developments, macroeconomic data, or positive news flow in the DOGE ecosystem, the $0.28164 level stands out as a strong resistance zone. Conversely, in the event of negative news flow, the $0.22632 level could be triggered. A decline to these levels could increase momentum and potentially initiate a new upward wave.
Supports: 0.25025 – 0.22632 – 0.21154
Resistances: 0.28164 – 0.30545 – 0.33668
LTC/USDT
Over the past 24 hours, the price movements observed in the Litecoin (LTC) / USDT pair closed the previous day with a 0.45% loss in value. LTC’s 1.25% pullback compared to Bitcoin shows Litecoin’s weakness against Bitcoin. This indicates that LTC is performing less well in the cryptocurrency market and should be monitored carefully in trading. On the futures side, the ratio of long and short positions opened in the last 24 hours being at 0.9135 shows that derivatives market participants have a downward expectation. This ratio reveals that the majority of investors are more inclined to take a sell-based position and points to the market’s short-term downward expectation. Furthermore, although funding rates are trending positively, their proximity to neutral levels indicates uncertainty about the market’s overall direction, yet still suggests that the downward expectation is predominant.
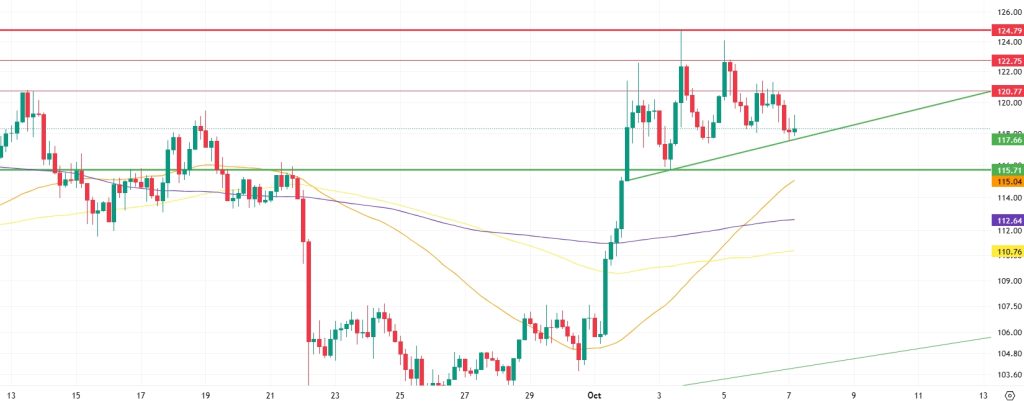
From a technical perspective, LTC’s short-term price movements are shaped by significant resistance and support levels. First, the horizontal resistance level at 120.77 stands out as the first major hurdle it may encounter when attempting to rise above the current price. Breaking above this level could drive LTC’s price upward. However, this would also require more buying pressure. Next, the horizontal resistance at the 122.75 level is another hurdle that could be encountered if the price rises further. A squeeze or profit-taking at this level could trigger short-term pullbacks. However, in a stronger bullish scenario, the major resistance at the 124.79 level will be the most critical barrier for LTC’s price.
In the event of a potential pullback, the first support level the price could find would be the 117.66 level, which is the support of the current uptrend. A drop below this level could cause declines to accelerate. If the trend support is broken, a more serious pullback could occur. In this case, the strong major support at the 115.71 level emerges as an important level where the decline could be halted. If LTC’s price falls below 115.71, the 112.64 level, where the 200-period moving average (purple line) crosses ( ), appears to be an area where buying interest could emerge and the trend could potentially reshape.
Supports: 117.66 – 115.71 – 112.64
Resistances: 120.77 – 122.75 – 124.79
SUI/USDT
Sui announced yesterday that it will expand its DeFi ecosystem with an important update. TVL (total value locked) reached $2.46 billion. Along with this growth, a local decentralized exchange (DEX) called SuiDEX was announced on the network. SuiDEX will offer cross-chain support and use a hybrid structure combining AMM and order book systems. The goal is to make liquidity more efficient and increase user participation. The $SUIX token will be used for governance. SuiDEX will launch in the last quarter of 2025, and the token will be released in the first quarter of 2026.
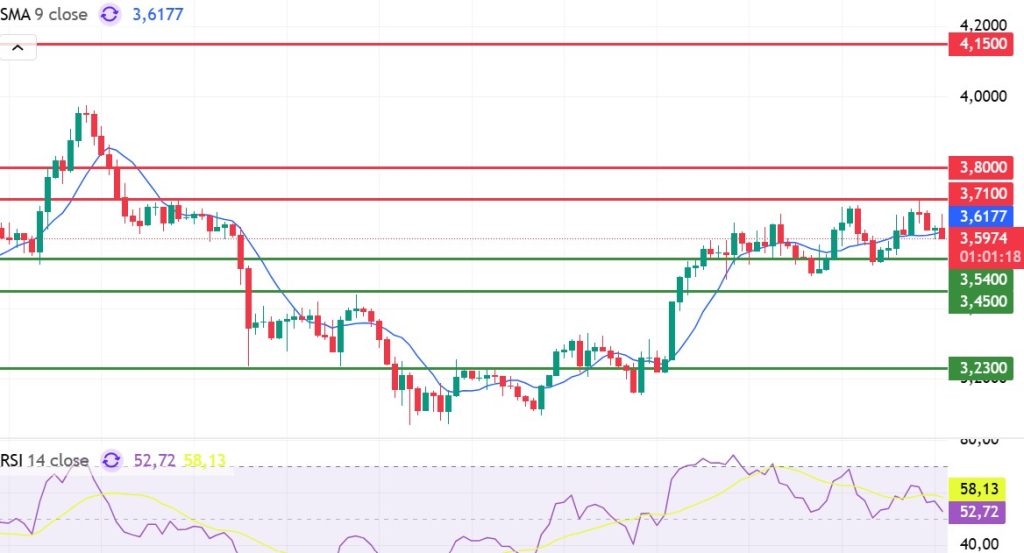
Looking at Sui’s technical outlook, we see that the price has fallen to around $3.59 on the 4-hour chart, influenced by fundamental developments. The Relative Strength Index (RSI) is currently in the 52.72 – 58.13 range. This range indicates that the market is trading close to the sell zone; however, if the RSI weakens and falls to the 35.00 – 40.00 range, it could signal a potential buying point. If the price moves upward, the resistance levels of $3.71, $3.80, and $4.15 can be monitored. However, if the price falls to new lows, it could indicate that selling pressure is intensifying. In this case, the $3.54 and $3.45 levels stand out as strong support zones. In particular, in the event of a sharp sell-off, a pullback to $3.23 appears technically possible.
According to Simple Moving Averages (SMA) data, Sui’s average price is currently at the $3.61 level. The price remaining below this level indicates that the current downtrend could technically continue.
Supports: 3.23 – 3.45 – 3.54
Resistances: 3.71 – 3.80 – 4.15
Legal Notice
The investment information, comments, and recommendations contained herein do not constitute investment advice. Investment advisory services are provided individually by authorized institutions taking into account the risk and return preferences of individuals. The comments and recommendations contained herein are of a general nature. These recommendations may not be suitable for your financial situation and risk and return preferences. Therefore, making an investment decision based solely on the information contained herein may not produce results in line with your expectations.


