
BTC/USDT
After meeting with Republican representatives in the Oval Office for the GENIUS Act, President Trump announced that the bill will be voted on in the House today. The Chairman of the House Financial Services Committee also stated that they have enough votes to pass the three major crypto bills. On the economic front, June PPI data remained stable on a monthly basis, while the annual increase remained below expectations, indicating that inflationary pressures weakened.
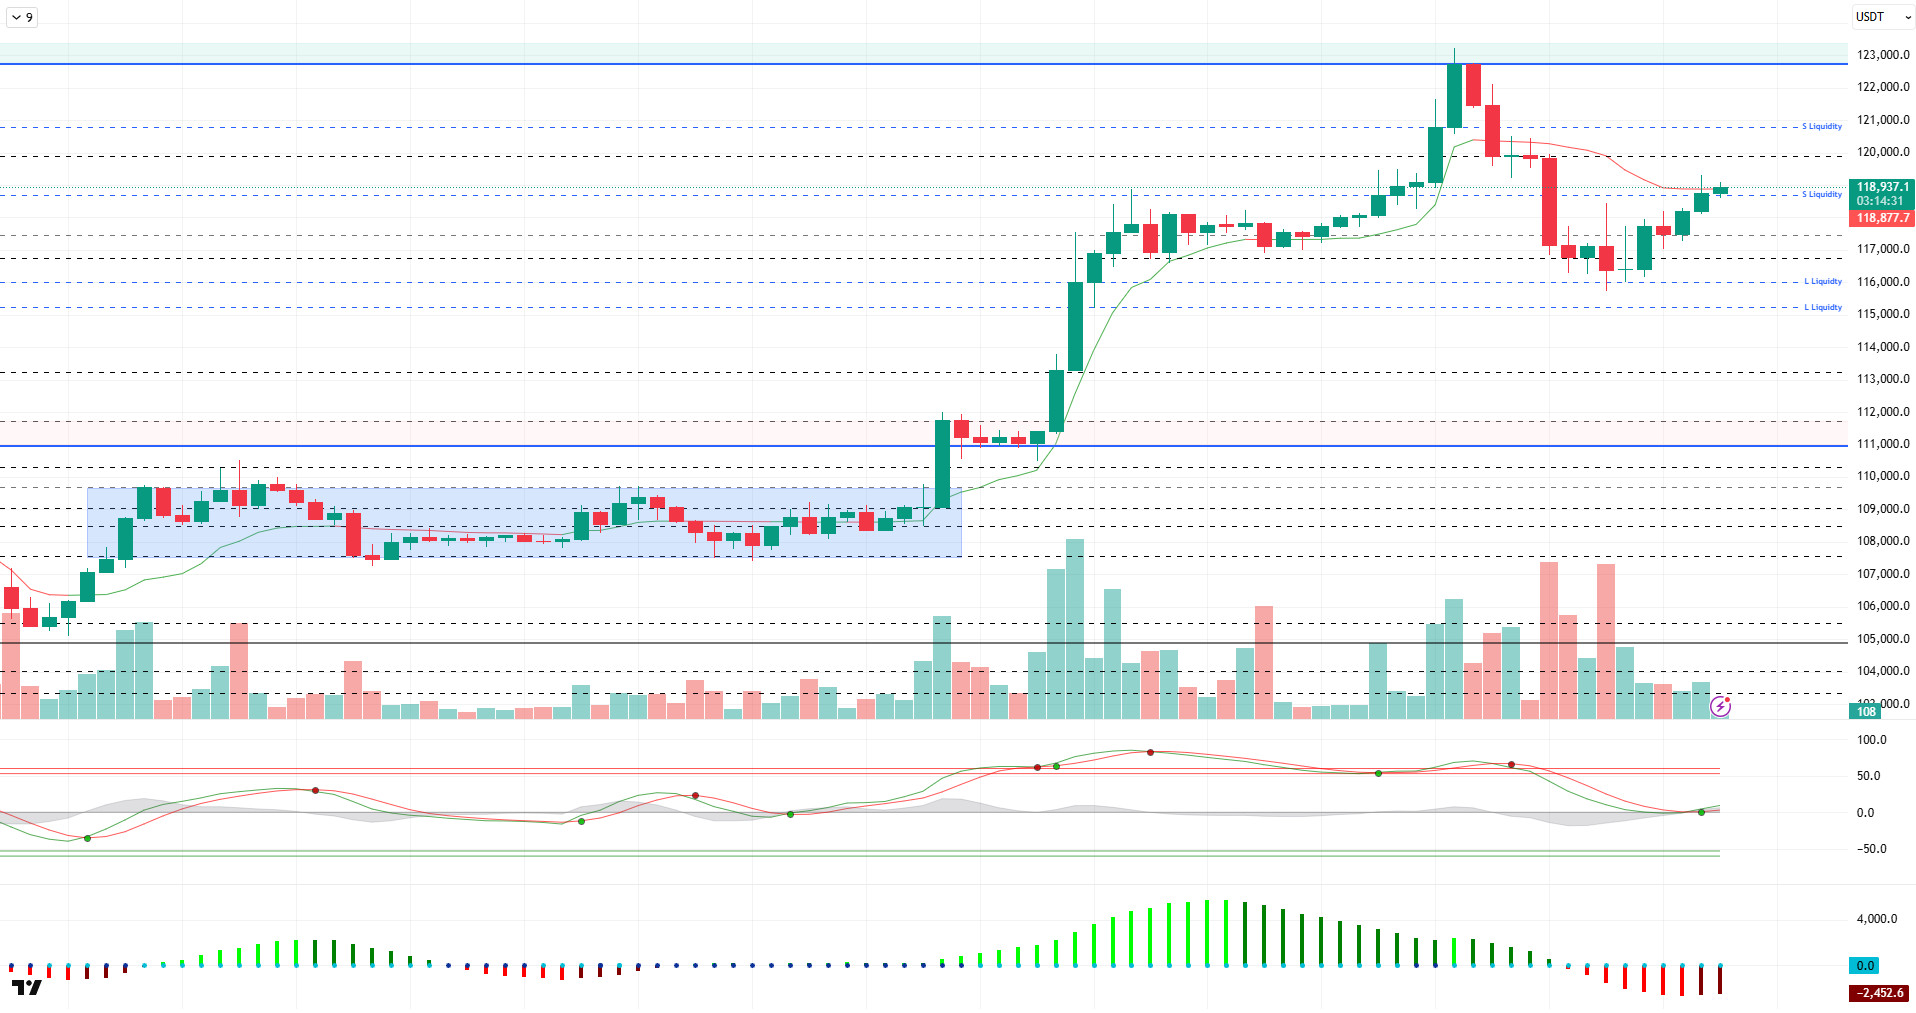
When we look at the technical outlook, after the ATH level in BTC price reached 123,200, it realized the correction of the rise and fell to 115,800. The rebounding price continues to trade near the 119,000 level at the time of writing.
Looking at the technical indicators, the Wave Trend (WT) oscillator is preparing for a trend reversal by retreating to the mid-channel band with the recent decline. The histogram on the Squeeze momentum (SM) indicator is in the negative territory and out of sync with the trend. The Kaufman moving average is just above the price at 118,800.
Analysing the liquidity data, with the recent decline, buy positions were liquidated at 120,000, 118,500 and 116,800, respectively. While the closest liquidity area stood out as the 115,000 level, the price turned its direction upwards without touching this zone. Although not intensive, the sales level has been accumulated in a wide band range of 118,500 – 125,000.
In sum, the price reached the new ATH level as fundamental developments continued to contribute positively to pricing. While the technical outlook continues to move in line with the trend reversal in the middle band of the channel in the short term, liquidity data reflects that buying positions are dominant. In the continuation of the rise, 120,000 is followed as a minor resistance point, while in a possible selling pressure, we will follow the 117,500 support level.
Supports 117,500 – 116,800 – 116,000
Resistances 118,600 – 120,000 – 121,000
ETH/USDT
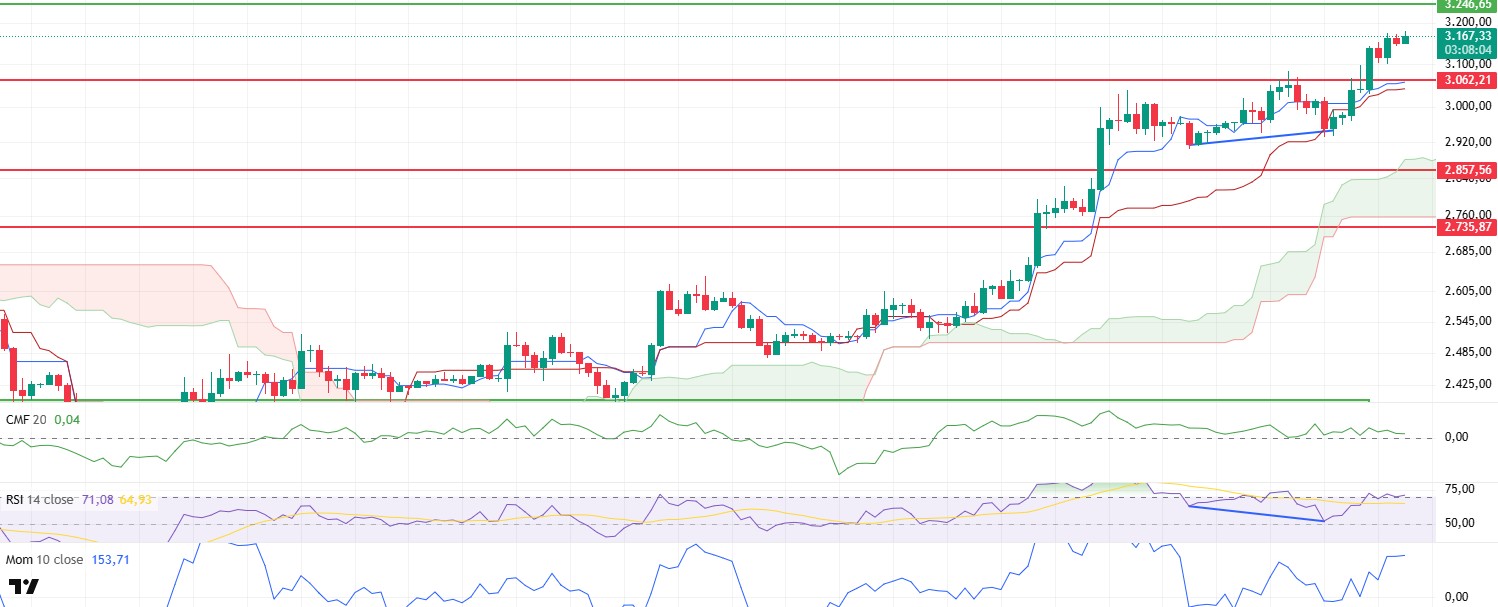
ETH price continued its upward movement during the day, rising as high as $3,170. This rise is supported by both signals from technical indicators and volumetric data. It is noteworthy that the price has maintained the upward momentum in its recent movements and the market continues its buying trend.
When the Ichimoku cloud is analyzed, it is seen that ETH price has broken both kijun and tenkan levels to the upside, providing persistence above these lines. While this outlook indicates that the trend is positive in the short term, the continued expansion of the kumo cloud shows that the current structure is not just a temporary uptrend, but continues with strong underlying structural support.
On the momentum side, the horizontal movement of the Relative Strength Index (RSI) indicator near the overbought level reveals that although the market has entered the overbought zone, selling pressure remains limited and buyers remain strong. The fact that the RSI remains stable at these levels means that the price may find support against possible profit realizations. In parallel with this situation, the momentum in momentum indicators still remains strong, indicating that the price may continue its upward movement.
An analysis of the Cumulative Volume Delta (CVD) data shows that the ongoing interest in the spot market continues to be more dominant than in the futures market. This suggests that the price action is being supported by direct buying rather than futures and that the uptrend is more organic. Chaikin Money Flow (CMF) indicator remains in positive territory, confirming that liquidity inflows to the market continue and capital flows are still strong.
In light of this data, the price is likely to head towards the important resistance zone at $3,246 in the short term. If a move towards this level is realized, the upward momentum may be further strengthened and new peaks may be attempted. However, in order for this scenario to remain valid , it is critical to maintain the short-term support area at $3,062. In case of a decline below this level, the possibility of the price losing momentum and entering a deeper correction process may increase.
Supports 3,062 – 2,857 – 2,735
Resistances 3.246 – 3.455 – 3.739
XRP/USDT
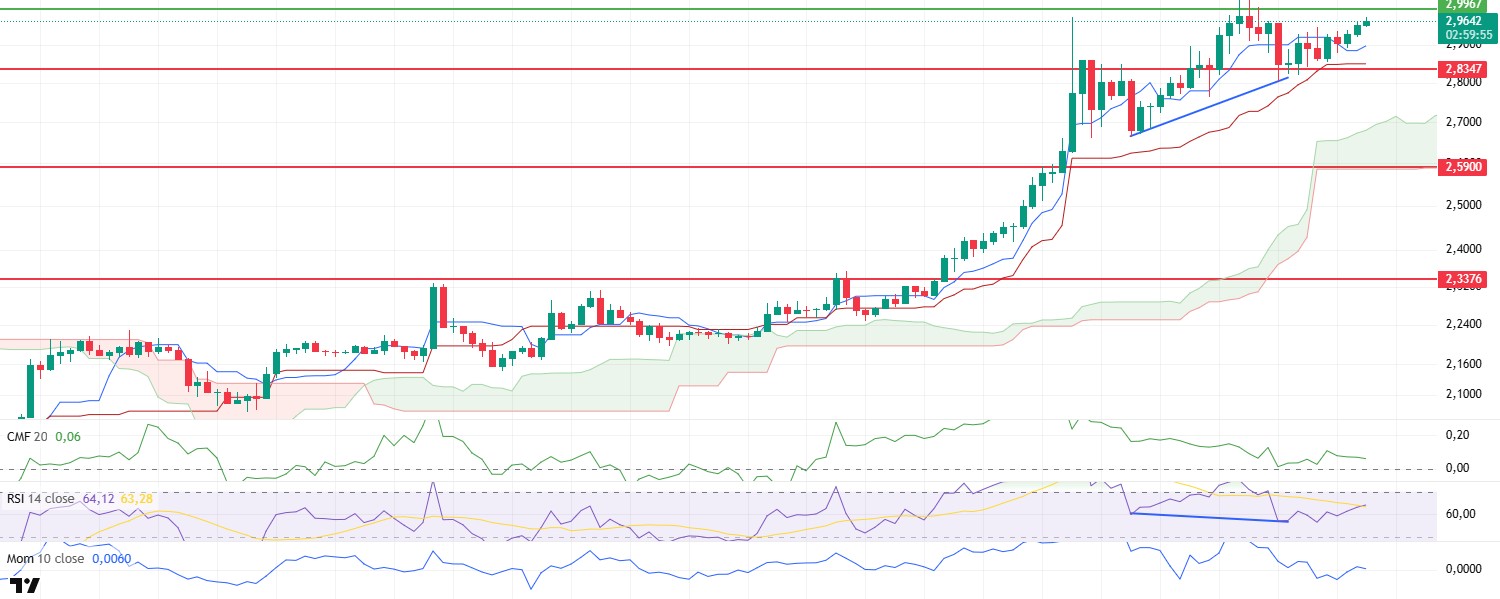
XRP price continued its upward trend during the day and advanced to the level of $2.97. Although the price movement was generally limited, the positive signals in technical indicators were among the factors supporting this rise. Especially during the day, buyers are seen to be effective in the market in a controlled but determined manner.
The Chaikin Money Flow (CMF) indicator remains in positive territory, indicating that liquidity inflows to the market continue, albeit limited.
The Relative Strength Index (RSI) indicator, on the other hand, made a remarkable technical development, rising above the based MA line and reaching as high as 64 levels. The fact that the RSI crossed this threshold clearly shows that the market is trending upwards in the short term. However, it is noteworthy that there is no clear increase in momentum yet. Although momentum indicators remain relatively weak, the fact that the overall structure remains positive reveals that the price is moving on a supported ground.
In this technical framework, it seems likely that the price will test the $2.99 level towards the evening hours. If this level is broken upwards, an area may open up where the price can continue its rise with more aggressive movements. However, downside risks should not be ignored. The $2.83 level stands out as a key support point in terms of maintaining the current positive structure. A downside break of this level could weaken the price structurally, setting the stage for a deeper and sharper pullback.
Supports 2.8347 – 2.5900 – 2.3376
Resistances 2.9967 – 3.1497 – 3.4014
SOL/USDT
Solana achieved a remarkable success in terms of network performance, with its TPS (Transaction Per Second) value exceeding 1,400 and breaking a new record.
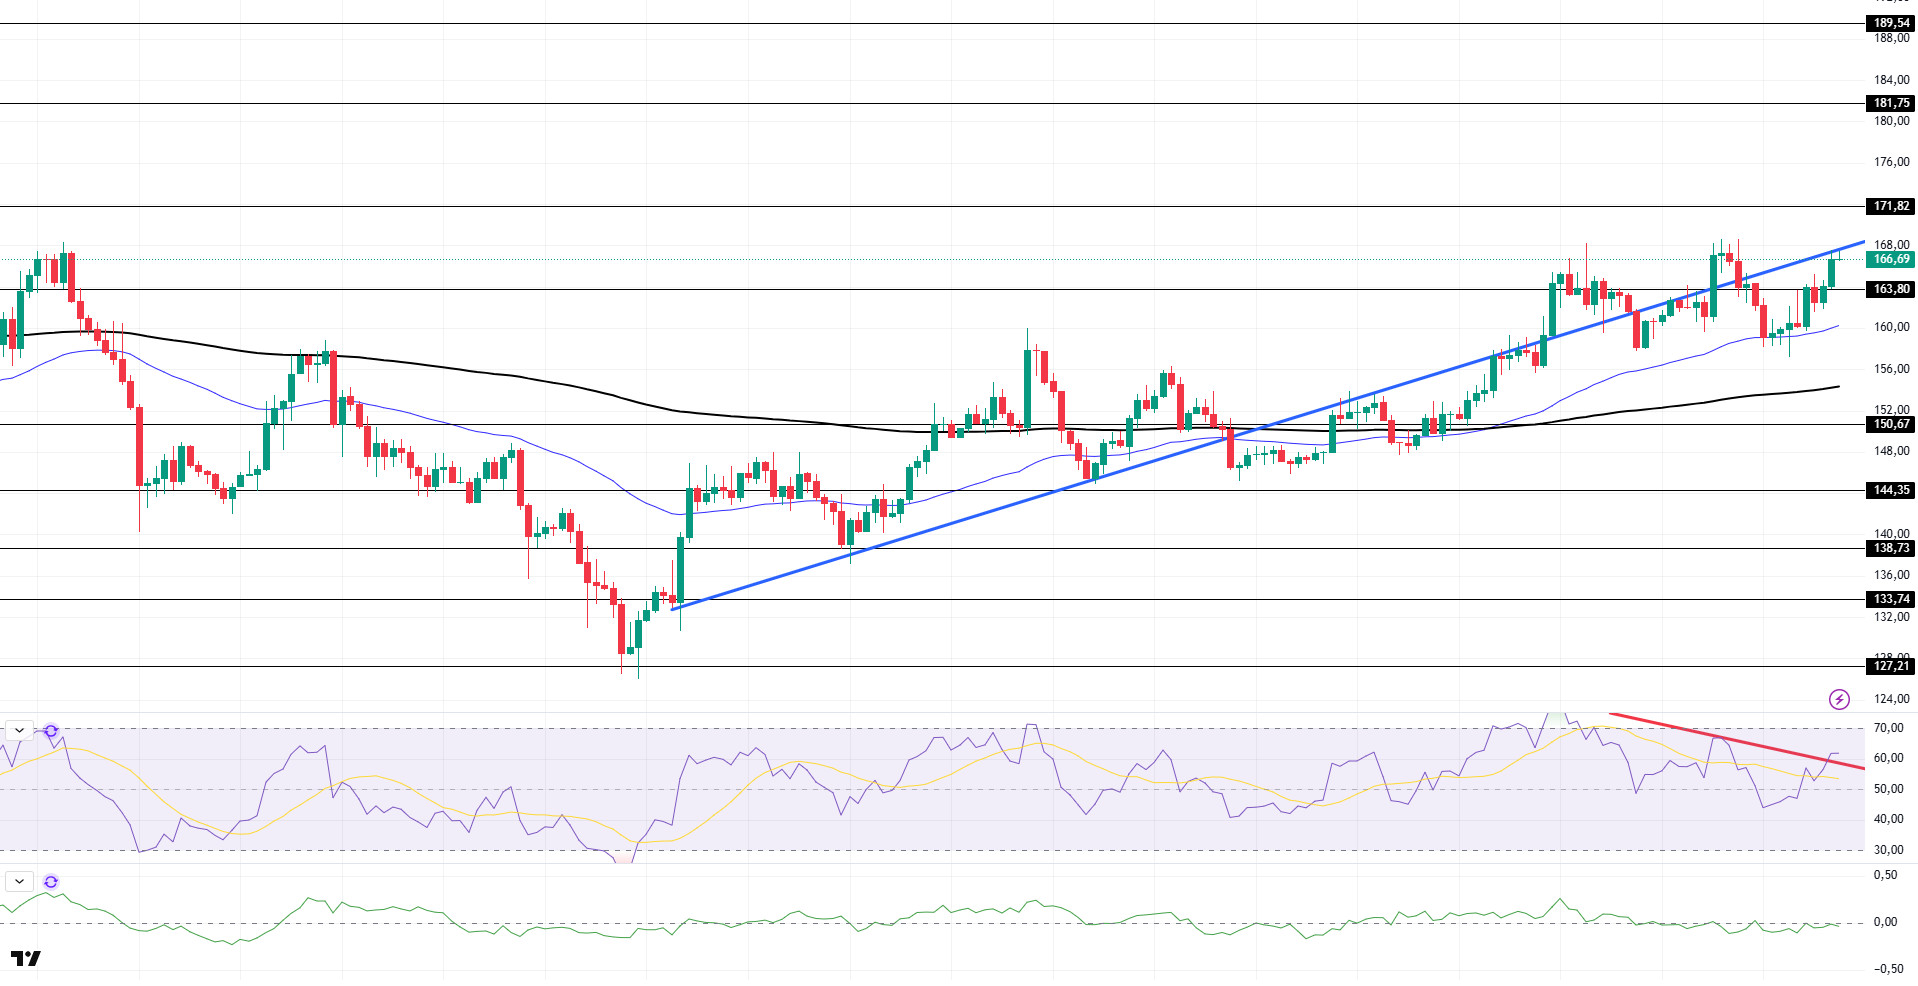
SOL price was bullish during the day. The asset remains below the uptrend that started on June 23rd. The price, which accelerated upwards with support from the 50 EMA (Blue Line) moving average, which is a strong support, broke the strong resistance level of $163.80 upwards and is currently testing the uptrend as resistance. If the upward momentum continues, it may test the $ 171.82 level. In case of a pullback, the 50 EMA (Blue Line) moving average should be followed.
On the 4-hour chart, the 50 EMA (Blue Line) continues to be above the 200 EMA (Black Line). This suggests that the uptrend may continue in the medium term. At the same time, the fact that the price is above both moving averages suggests that the market is currently in a bullish trend in the short term. Chaikin Money Flow (CMF-20) continues to be in negative territory; however, a decline in inflows could take CMF deeper into negative territory. Relative Strength Index (RSI-14), on the other hand, broke the selling pressure by moving into positive territory. In addition, it broke the downtrend that started on July 11 to the upside and gave a bullish signal. The $171.82 level stands out as a strong resistance point in case of an uptrend due to macroeconomic data or positive news on the Solana ecosystem. If this level is broken upwards, the rise can be expected to continue. If there are pullbacks due to contrary developments or profit realizations, the $ 163.80 level can be tested. In case of a decline to these support levels, the increase in buying momentum may offer a potential bullish opportunity.
Supports 163.80 – 150.67 – 144.35
Resistances 171.82 – 181.75 – 189.54
DOGE/USDT
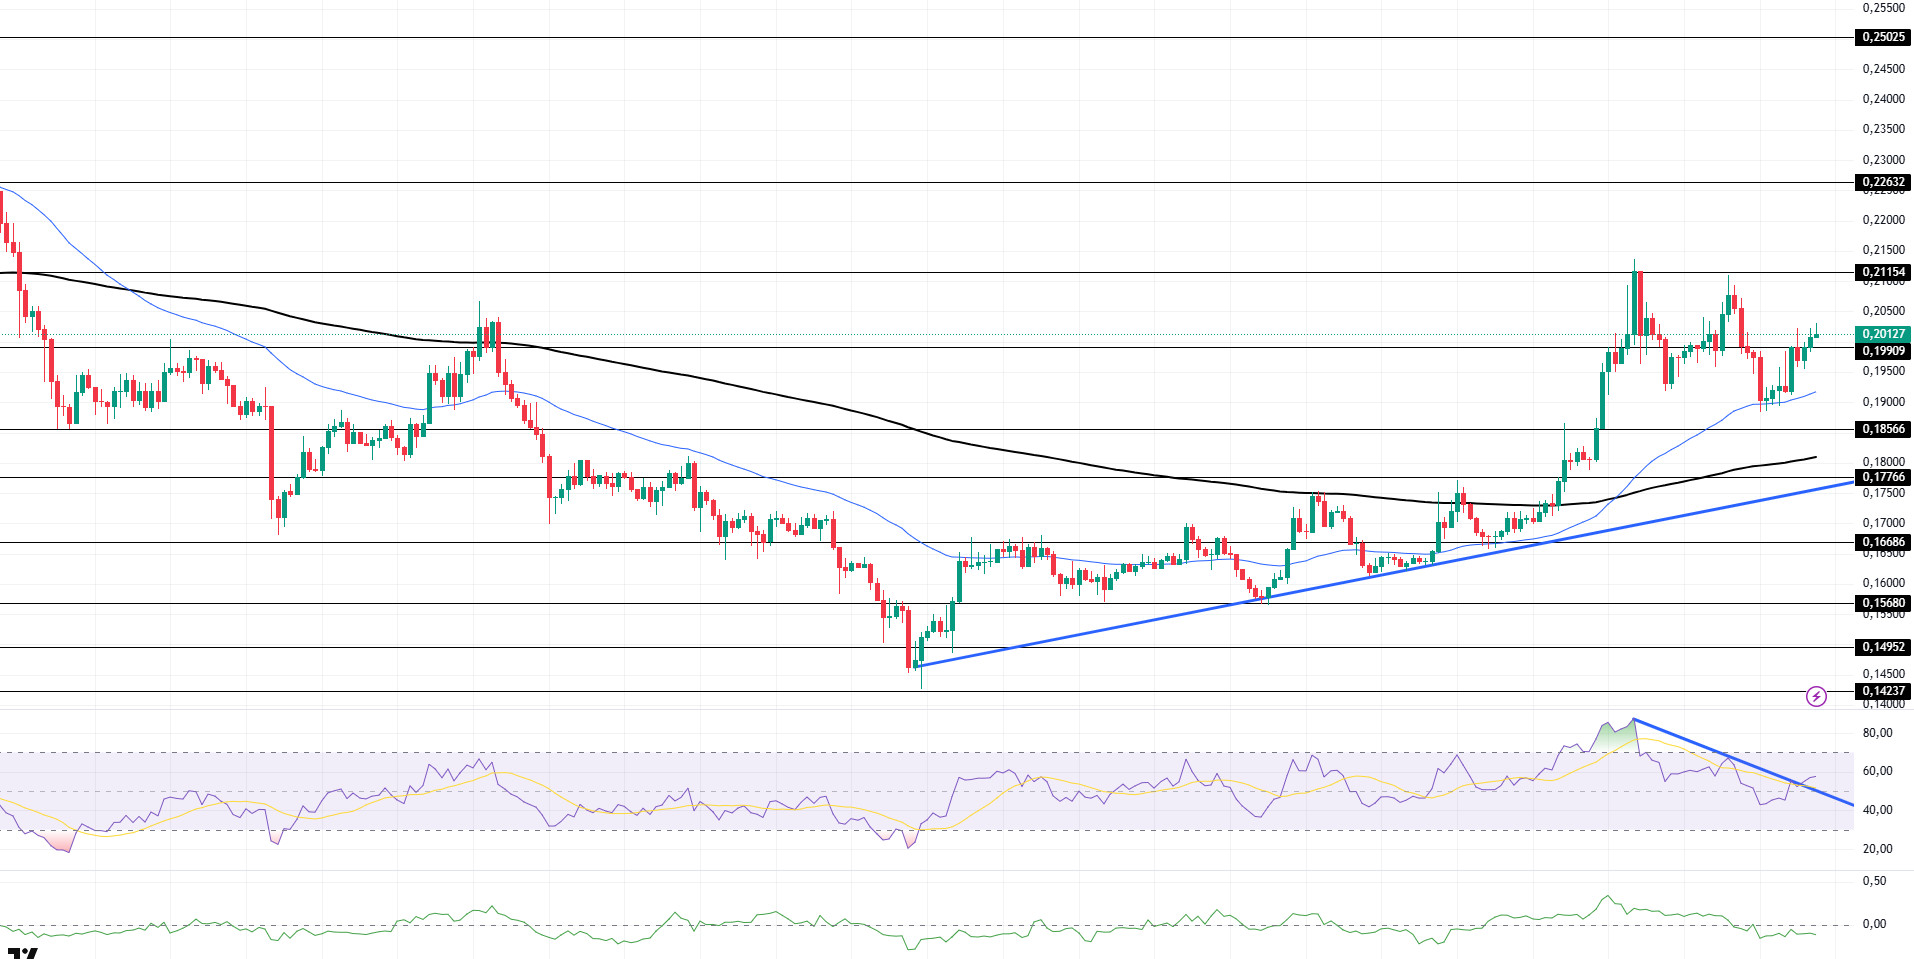
The DOGE price was bullish during the day. The asset, which managed to stay above the 200 EMA (Black Line) and 50 EMA moving averages with the uptrend that started on June 22, continues its acceleration by breaking the strong resistance level of $ 0.19909. In case of a pullback, the 50 EMA (Blue Line) moving average and the $ 0.18566 level can be followed as support.
On the 4-hour chart, the 50 EMA (Blue Line) continues to be above the 200 EMA (Black Line). This suggests that the asset is bullish in the medium term. The fact that the price is above both moving averages suggests that the asset is bullish in the short term. Chaikin Money Flow (CMF-20) started to be in the negative territory. In addition, positive inflows may move CMF into positive territory. Relative Strength Index (RSI-14) remained in positive territory. In addition, the downtrend that started on July 11th has now broken to the upside and strengthened its momentum. The $0.21154 level stands out as a strong resistance zone in case of possible rises in line with political developments, macroeconomic data or positive news flow in the DOGE ecosystem. In the opposite case or possible negative news flow, the $0.18566 level may be triggered. In case of a decline to these levels, the momentum may increase and a new bullish wave may start.
Supports 0.19909 – 0.18566 – 0.17766
Resistances 0.21154 – 0.22632 – 0.25025
LEGAL NOTICE
The investment information, comments and recommendations contained herein do not constitute investment advice. Investment advisory services are provided individually by authorized institutions taking into account the risk and return preferences of individuals. The comments and recommendations contained herein are of a general nature. These recommendations may not be suitable for your financial situation and risk and return preferences. Therefore, making an investment decision based solely on the information contained herein may not produce results in line with your expectations.