
Technical Analysis
BTC/USDT
A 15% common tariff agreement between the US and the European Union entered into force. Trade talks between China and the US are extended for 90 days. The US will announce the results of its national security investigation into imported semiconductor products in two weeks. While the Ukraine crisis is back on the agenda in US-Russia relations, US energy and defense cooperation with Europe is being increased. Trump Media & Technology Group invested $300 million in Bitcoin derivatives. Japan-based Metaplanet’s total Bitcoin holdings reached 17,132 units. H100 Group AB raised $114 million in funding as part of its Bitcoin strategy. Capital B bought another 58 BTC, bringing its total holdings to 2,013 BTC. UK-based Coinsilium raised 12 BTC, bringing its total holdings to 124 BTC. The Smarter Web Company announced that it continued its Bitcoin investments by raising £19.68 million in funding. On the other hand, Michael Saylor is expected to share data on Strategy’s Bitcoin purchases today.
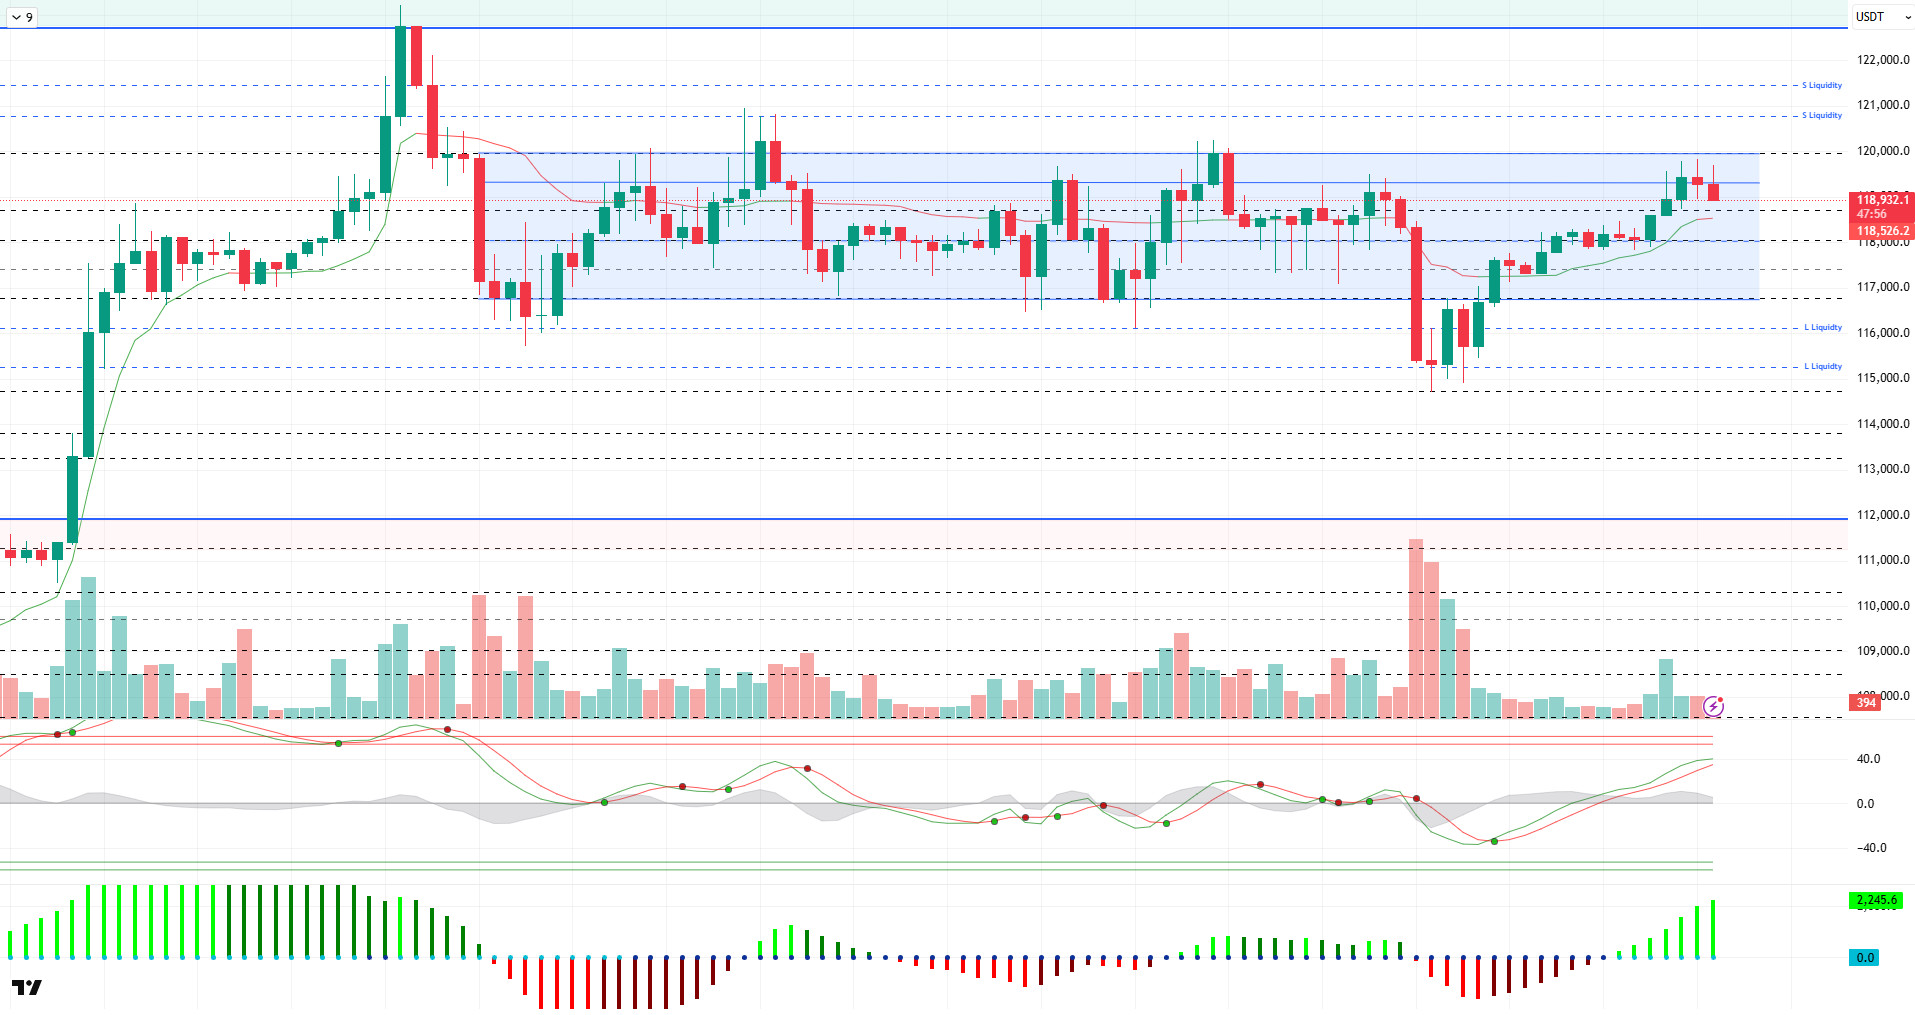
When we look at the technical outlook, BTC, which tested the 115,000 level last week, broke the horizontal band range it has been following for a while, but managed to recover again with the reaction it received from this region. Forming a minor bullish channel, the price came above 119,000 with a “V” type rise.
On the technical indicators front, the Wave Trend (WT) oscillator, while moving from the mid-channel band to the oversold zone with the decline, turned its direction upwards again and achieved a trend reversal. Squeeze Momentum (SM) indicator regained momentum in positive territory. The Kaufman moving average is just below the price at 118,600.
Looking at the liquidity data, it was seen that the buying levels in the 115,000 – 116,000 band were liquidated with the decline, while the selling transactions in the 118,000 – 119,000 band were liquidated with the rise. The 120,600 level stands out as the closest liquidity area.
To summarize, BTC, which once again gained momentum amid fundamental developments, came back to its consolidated bandwidth. The technical outlook is approaching overbought territory, while liquidity data continues to define price limits. While a further rise in the price seems likely from a technical and liquidity perspective, the breach of the 120,000 resistance point will be monitored in the first stage. If it breaks, it may face selling pressure from the 120,600 liquidity zone. In a possible new selling pressure, 118,600 stands out as a minor support point.
Supports 118,600 – 118,000 – 117,500
Resistances 120,000 – 120,600 – 121,500
ETH/USDT
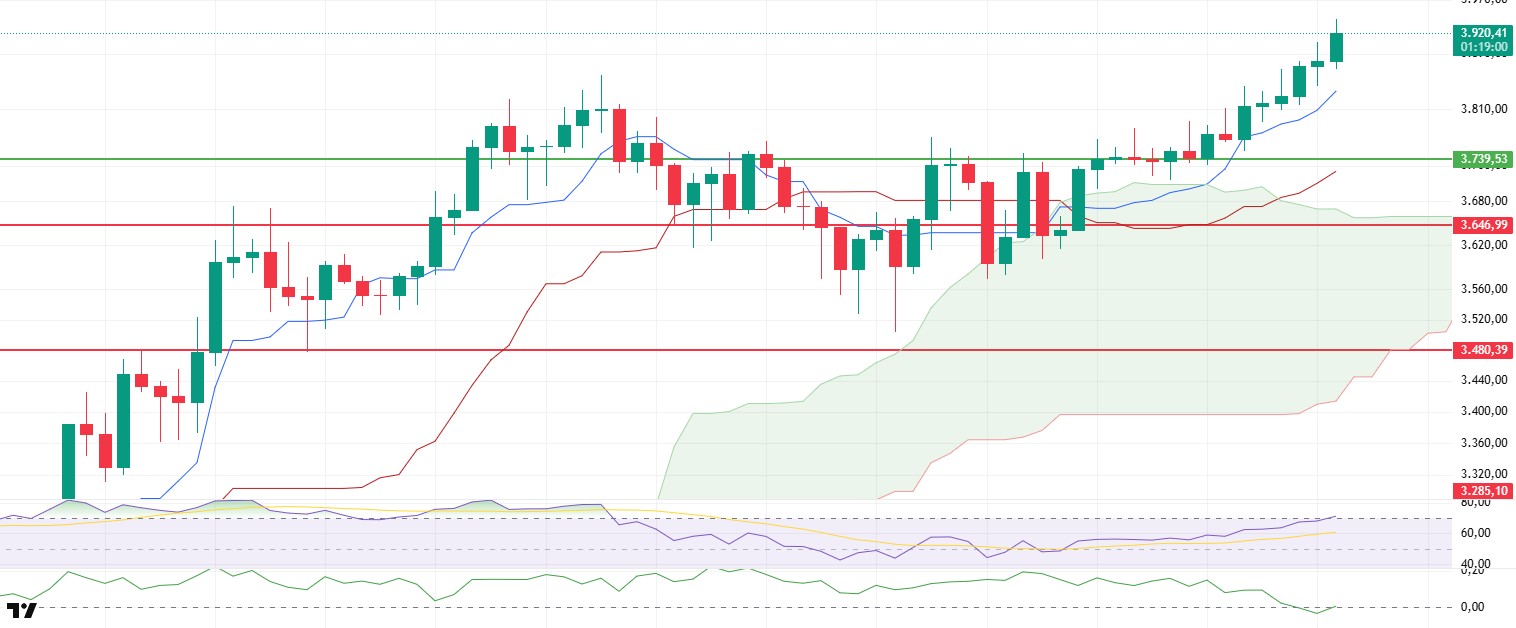
ETH gained bullish momentum in the evening hours of Friday with a reaction from the $3,646 support level and first climbed up to the intermediate resistance zone at $3,739. With the upside breakout of this level on Sunday, the buying pressure accelerated and the price moved sharply above $3,900, one of the strongest moves of the recent period.
When technical and on chain data are analyzed together, it is seen that the structure behind the rise is quite remarkable. In particular, the fact that the open interest data increased to $28.2 billion shows that there is a serious accumulation of positions in the futures markets. This increase reveals that investors are turning to leveraged transactions and that there is a strong demand. In the same period, the funding rate also increased significantly, confirming that the market is predominantly long. This outlook, despite the strong bullish sentiment, brings with it the risk of a possible correction in the short term.
The fact that the Chaikin Money Flow (CMF) indicator declined to negative territory instead of staying in positive territory in line with the price action suggests that capital inflows failed to support the price. While this raises doubts about the sustainability of the uptrend, it can also be considered as one of the first signals that buyers are starting to weaken.
The Relative Strength Index (RSI) has risen to overbought territory. Although this shows that technically positive momentum is still strong, the RSI reaching these levels indicates that the market has entered the overbought zone in the short term, which is another factor that increases the possibility of a correction.
The overall outlook suggests that the ETH price has reached a certain saturation at current levels and technical indicators point to the risk of a correction, especially in the short term. In a possible pullback, the $3,739 region can be followed as the first important support level. However, it should be noted that if strong volume and demand continue to sustain the upward momentum, the price may break the resistance line at $4,084 and continue its upward trend.
Top of Form
Below the Form
Supports 3,739 – 3,646 – 3,480
Resistances 4,084 – 4,381 – 4,857
XRP/USDT
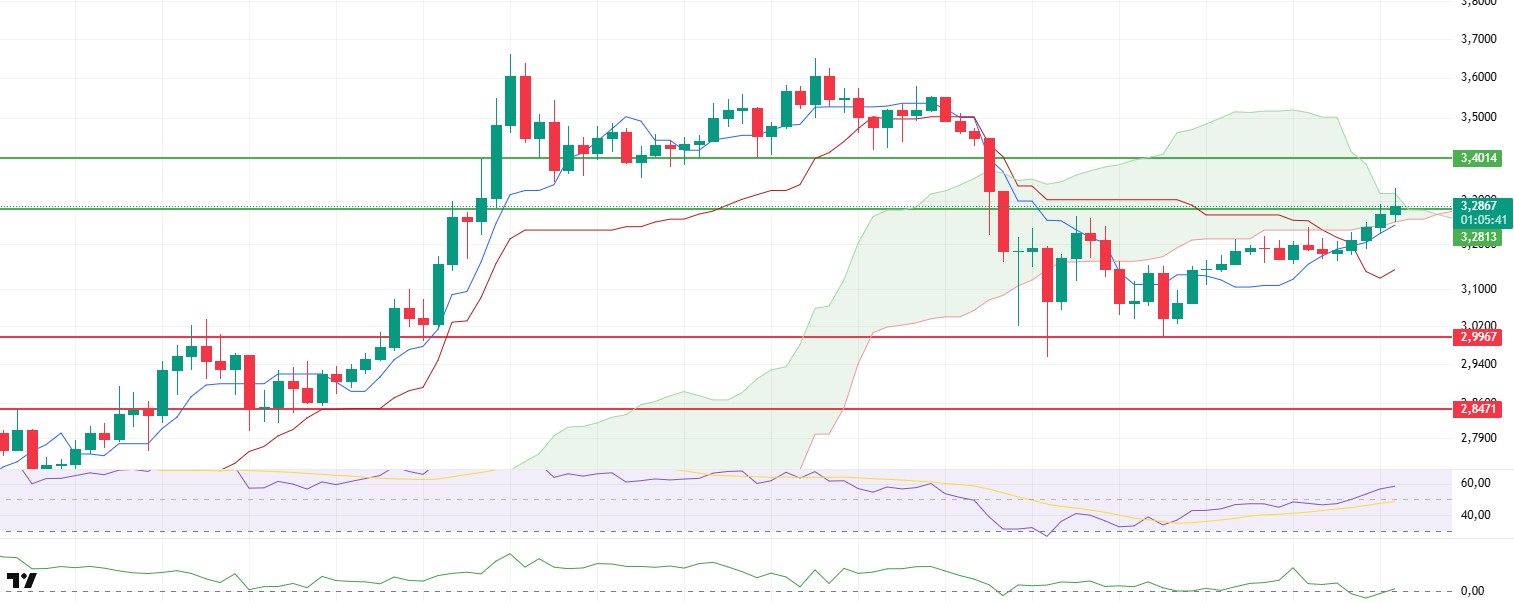
After retreating to the $2.99 support level on Friday, which was often emphasized as critical in previous analysis, XRP price recovered with the purchases from this region and entered an upward trend towards the end of the week and reached the resistance zone at $3.28. The price, which managed to stay above this level after the weekly close, is currently trying to gain the upper band of the kumo cloud on the ichimoku indicator, and price movements in this region may be decisive in determining the short-term direction.
Analyzing the technical indicators in detail, the Chaikin Money Flow (CMF) indicator shows a clear negative divergence from the price, trending towards the negative territory as the price moves upwards. Such divergences increase the likelihood of a possible correction in the short term and it is important for traders not to ignore such signals.
The Relative Strength Index (RSI) indicator continues to remain above the 50 reference level and continues to move in the positive zone. This suggests that the current uptrend is technically supported and momentum is positive. The RSI’s continued stay in this region can be considered as another technical confirmation that the price can maintain its upward momentum.
In terms of the Ichimoku indicator, the price breaking above both tenkan and kijun levels indicates a positive outlook in the short term. However, the price has not yet managed to break the entire kumo cloud upwards. A clear crossing of this region, which is the upper band of the cloud and corresponds to approximately $ 3.31, will be a technical confirmation that the rise is on a more solid ground. Otherwise, staying below the cloud may indicate that the current rise is proceeding on an unstable ground.
As a result, a close above the $3.3187 level could increase the upside pricing potential as the price gains the upper band of the sand cloud and pave the way for a new bullish wave in technical terms. On the other hand, daily closes below the $3.2813 support, coupled with the negative mismatch on the CMF, could trigger a downward correction. Therefore, the price’s movements and closes between these two levels will play a critical role in determining the direction of XRP in the coming days.
Supports 3.2813 – 2.9967 – 2.8471
Resistances 3.4014 – 3.8615 – 4.0055
SOL/USDT
Solana unveils 2027 roadmap to lead internet capital markets The Solana Foundation’s 2027 roadmap characterizes market microstructures as “Solana’s most important challenge today”. Asphere launches Solana-based blockchain networks for businesses.
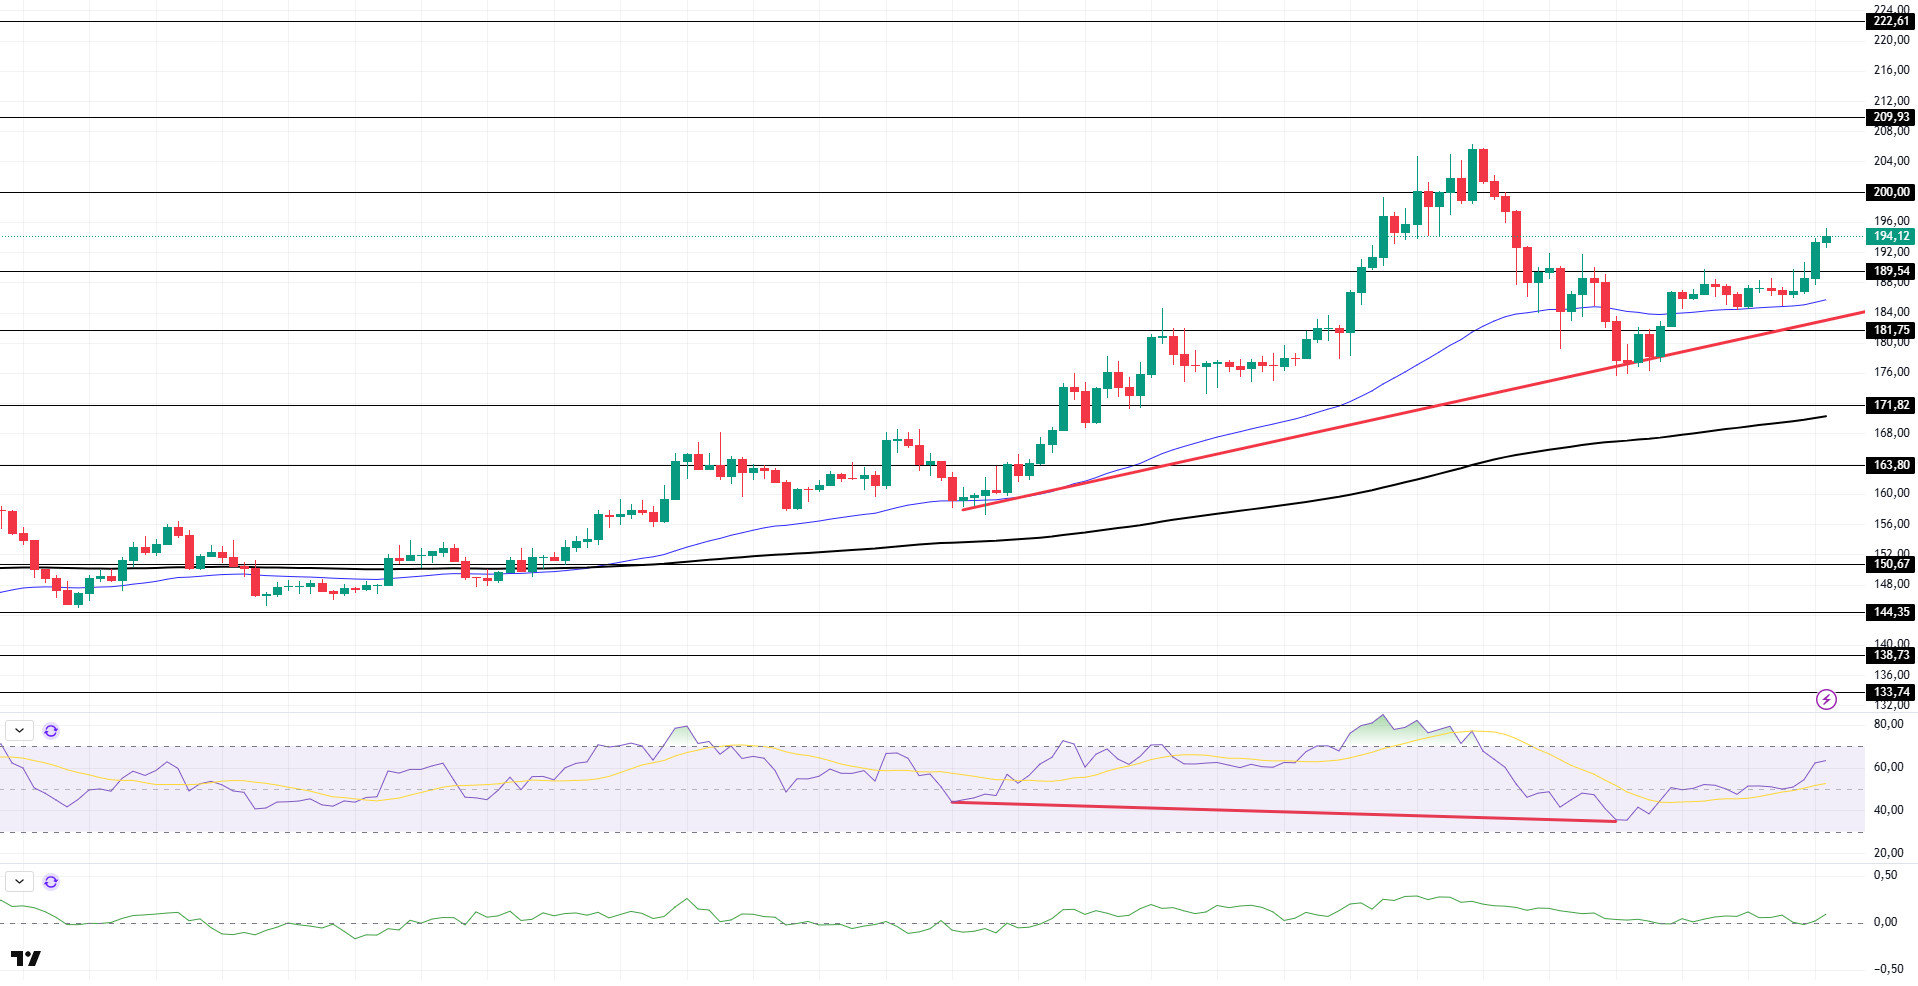
SOL price was bullish. After breaking the $181.75 level on the downside, the asset rebounded and broke the 50 EMA (Blue Line) moving average on the upside and then turned the moving average into support and rallied from there. As of now, it broke the $189.54 level. If the rises continue, the $ 200.00 level can be followed. If the retracement continues, the 50 EMA (Blue Line) moving average can be followed.
On the 4-hour chart, the 50 EMA (Blue Line) continues to be above the 200 EMA (Black Line). This suggests that the bullish trend may continue in the medium term. At the same time, the fact that the price is above both moving averages suggests that the market is currently in a bullish phase. On the other hand, a large difference between the two moving averages may trigger a bearish or sideways trend. Chaikin Money Flow (CMF-20) remained in positive territory. However, a decrease in money inflows may move CMF into negative territory. Relative Strength Index (RSI-14) rose to the mid levels of the positive zone. However, the positive divergence has worked. The $200.00 level stands out as a strong resistance point in the event of a rally on the back of macroeconomic data or positive news on the Solana ecosystem. If this level is broken upwards, the rise can be expected to continue. If there are pullbacks due to contrary developments or profit realizations, the $ 171.82 level can be tested. In case of a decline to these support levels, the increase in buying momentum may offer a potential bullish opportunity.
Supports 189.54 – 181.75 – 171.82
Resistances 200.00 – 209.93 – 222.61
DOGE/USDT
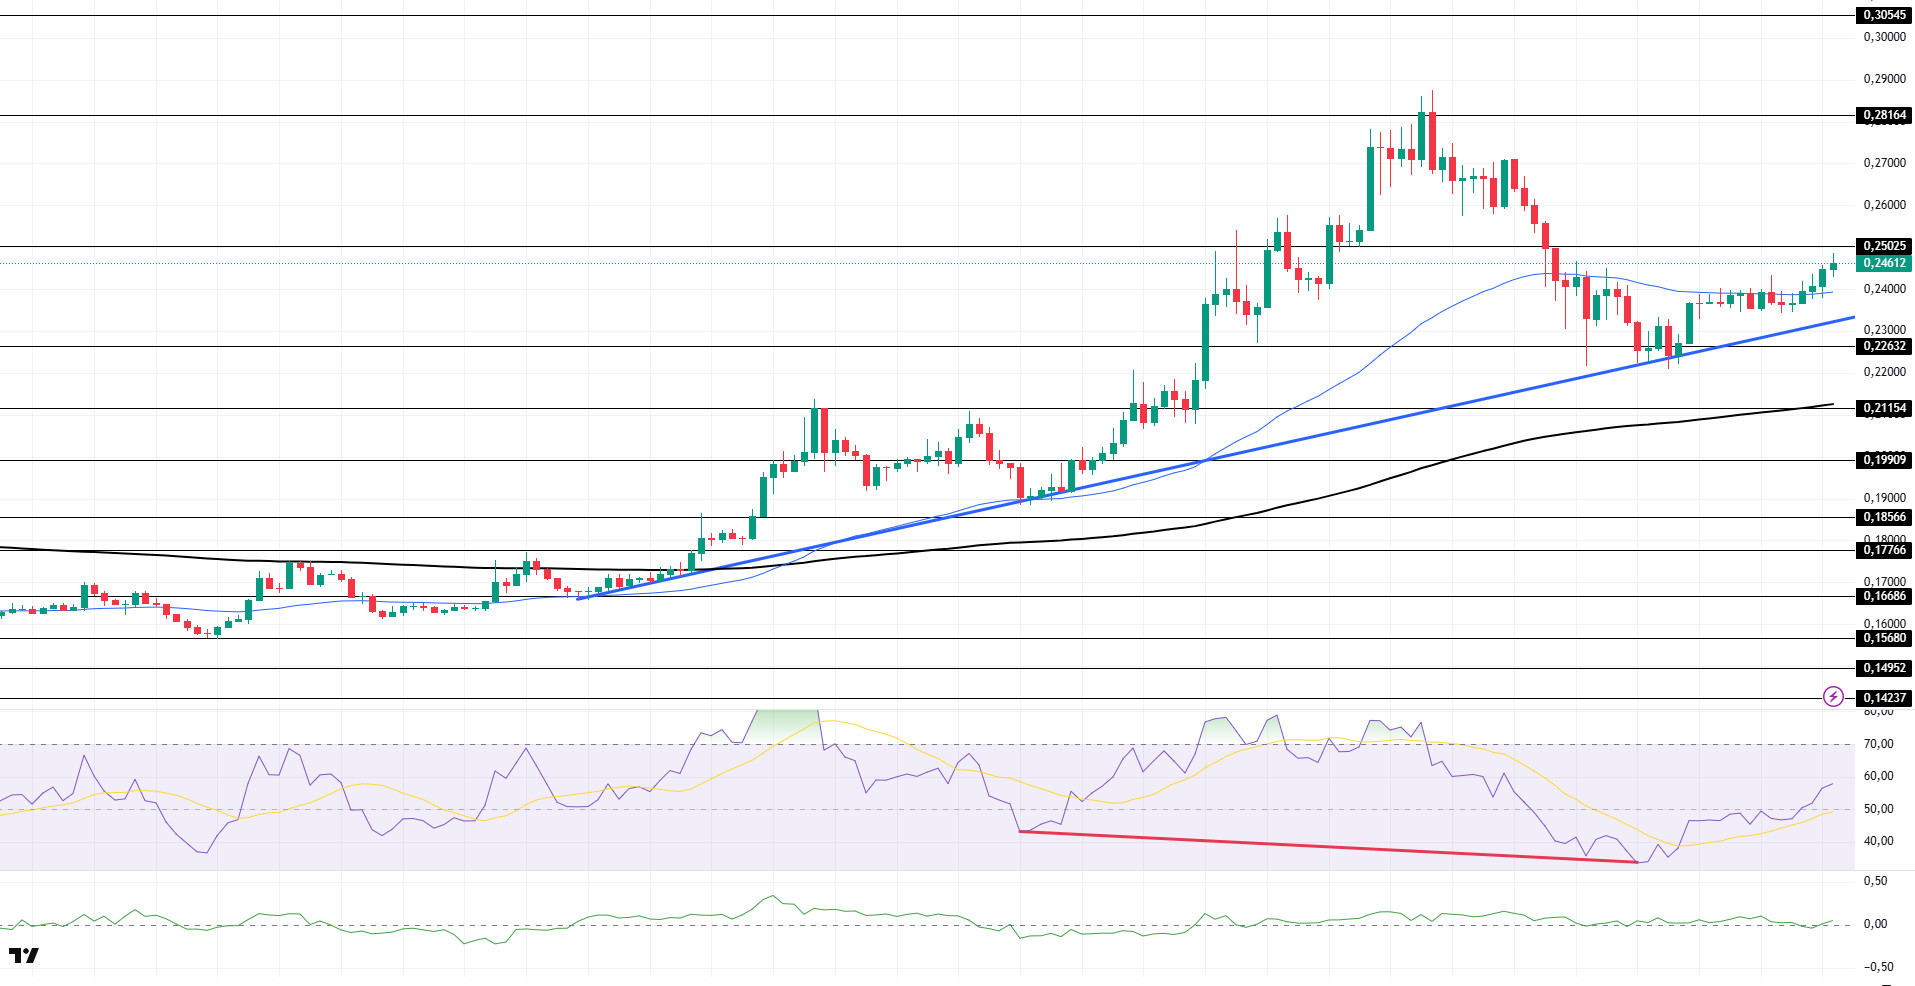
DOGE price has been bullish. The asset continued to stay above the 200 EMA (Black Line) moving average with the uptrend that started on July 7. Supported by the $0.22632 level and the uptrend, the price tested the 50 EMA (Blue Line) moving average as resistance and rose from there. The price, which is currently preparing to test the $0.25025 level, should follow the 200 EMA (Black Line) moving average as a support level if the retracement begins.
On the 4-hour chart, the 50 EMA (Blue Line) continues to be above the 200 EMA (Black Line). This suggests that the asset is bullish in the medium term. The fact that the price is above both moving averages indicates that the asset is in a bullish phase in the short term. A large difference between the two moving averages may cause the price to follow a bearish or sideways trend. Chaikin Money Flow (CMF-20) is neutral. In addition, positive money inflows may move CMF into positive territory. Relative Strength Index (RSI-14) started to be in the middle of the positive zone. In addition, the positive mismatch pattern has worked. The $0.25025 level stands out as a strong resistance zone in the case of possible rises in line with political developments, macroeconomic data or positive news flow in the DOGE ecosystem. In the opposite case or possible negative news flow, the $0.21154 level may be triggered. In case of a decline to these levels, the momentum may increase and a new bullish wave may start.
Supports 0.22632 – 0.21154 – 0.19909
Resistances 0.25025 – 0.28164 – 0.30545
Legal Notice
The investment information, comments and recommendations contained herein do not constitute investment advice. Investment advisory services are provided individually by authorized institutions taking into account the risk and return preferences of individuals. The comments and recommendations contained herein are of a general nature. These recommendations may not be suitable for your financial situation and risk and return preferences. Therefore, making an investment decision based solely on the information contained herein may not produce results in line with your expectations.

