
Technical Analysis
BTC/USDT
On the Fed front, Williams and Milan’s dovish messages regarding potential rate cuts have reignited expectations of a 25-basis-point easing at the December meeting, while Logan and Collins’ hawkish/cautious stance highlights the deepening divide within the FOMC. As Timiraos also emphasized, the likelihood of an “unusual” meeting where Powell could face at least three dissenting votes is growing. However, due to the data gap created by the government shutdown, the BLS canceled the October CPI and postponed the November report with incomplete content to December 18, which will force the Fed to make its decision without a full set of inflation and employment data. In geopolitics, the US increasing pressure on Kiev for a peace framework with tough conditions on the Russia-Ukraine front keeps risk perceptions alive, while the Trump administration preparing “Plan B” tariff authority against a possible tariff cancellation by the Supreme Court signals that trade uncertainty will continue.
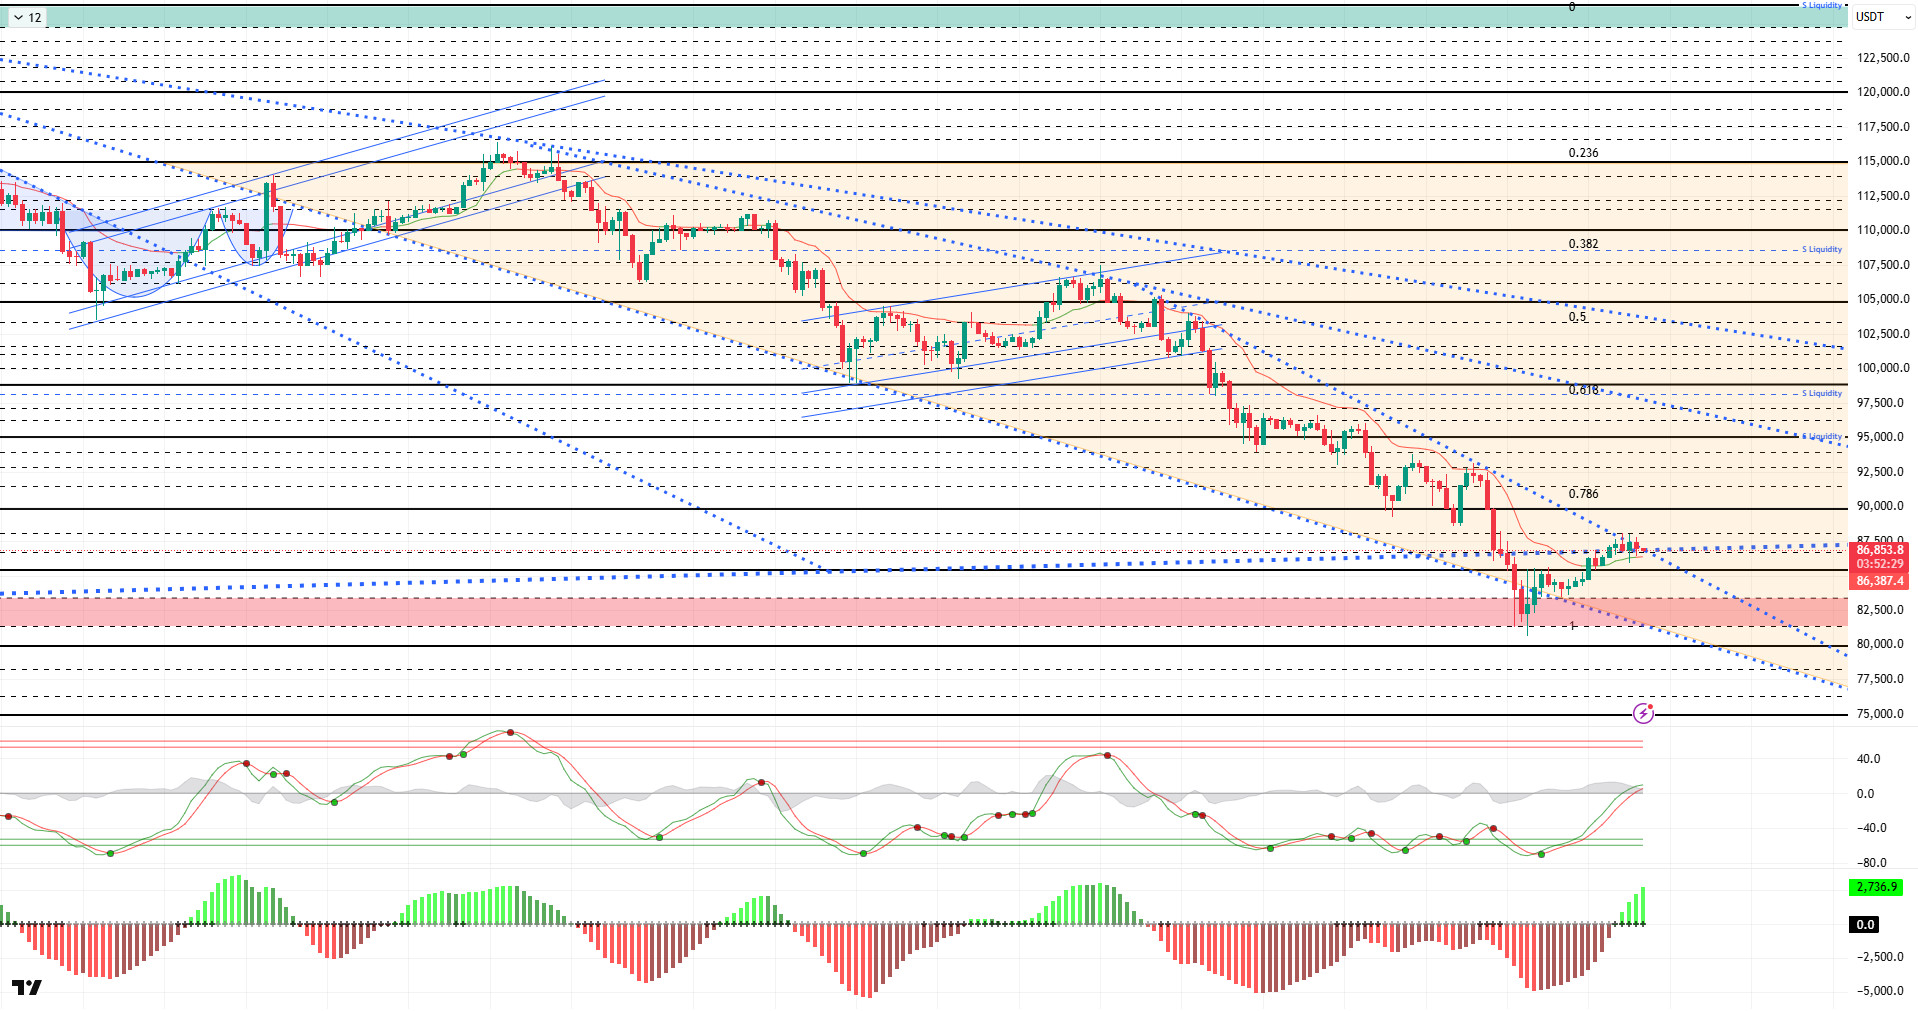
From a technical perspective, BTC fell relentlessly last week, retreating to around 80,500. The price managed to rebound from this level and tested the major uptrend line again over the weekend. At the time of writing, the price continues to trade around 87,000, sustaining its rebound.
Technical indicators show that the Wave Trend (WT) oscillator, after an indecisive buy/sell signal, reversed after giving a final buy signal in the oversold zone and reached the middle band of the channel. The histogram on the Momentum (SM) indicator, after reaching maximum weakness in the negative zone, made a successful attempt to regain strength. The Kaufman Moving Average (KAMA) is currently at $86,300, positioned below the price.
According to liquidation data, while trades opened last year in the buy zone were targeted, the entire 80,000 band resulted in liquidation. With the recent rise, investors are re-entering positions, with relatively higher concentration at the 84,000 level.In contrast, selling pressure remains concentrated at the 88,000-89,000 and 94,000 levels, while accumulation continues within the 97,000-98,000 range over a broader timeframe.
In summary, the pullback in BTC was driven by factors such as changing expectations for interest rate cuts, profit-taking by whales, the decline in technology stocks, retail outflows from ETFs, and the US government shutdown. The rebound gained momentum with Fed members expressing more optimistic views on further interest rate cuts. Technically, the price rebounded from a new low of 80,500. Liquidity data shows that sell-heavy positions continue to dominate. For the rally to be sustainable going forward, closes above 87,000, where the major uptrend line passes, will be critical. Otherwise, in the event of renewed selling pressure, the 85,000 level will be monitored as the new reference point.
Supports: 85,000 – 83,300 – 81,400
Resistances: 86,700 – 88,000 – 90,000
ETH/USDT
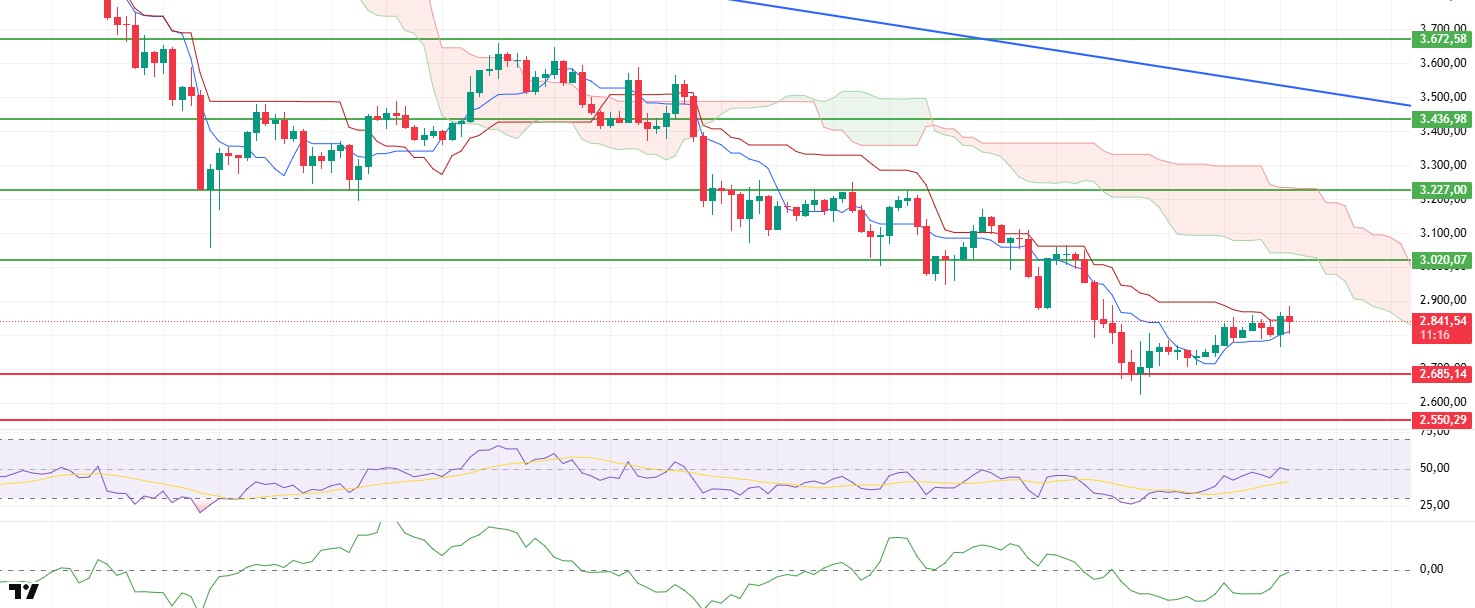
The ETH price fell below the $2,685 support level on Friday, dropping to $2,620. Buying activity from this region allowed the price to recover over the weekend, resulting in an upward movement to $2,885. Currently, the price appears to be stabilizing around the $2,835 level.
The Chaikin Money Flow (CMF) indicator has turned upward from negative territory following the recent rallies and is approaching the zero line, signaling that liquidity flow is beginning to turn positive again. This structure indicates increased market entries and reduced selling pressure.
The Relative Strength Index (RSI) reaching the 50 level and not showing negative divergence strengthens the positive outlook. The recovery in momentum indicates that the rebound is finding support.
In the Ichimoku indicator, the price rising above the Tenkan and Kijun levels stands out as an important development supporting the short-term positive outlook. The Tenkan level approaching the Kijun line also indicates that buyers are gaining strength. However, the price still being below the kumo cloud reminds us that the trend reversal is not complete and a cautious stance should be maintained.
In the overall assessment, as long as the ETH price remains above the Tenkan level of $2,808, upward movements are expected to continue. If it falls below this level, however, sharp sell-offs are likely to resume, and a downward breakout appears probable.
Below the Form
Supports: 2,685 – 2,550 – 2,331
Resistances: 3,020 – 3,227 – 3,436
XRP/USDT
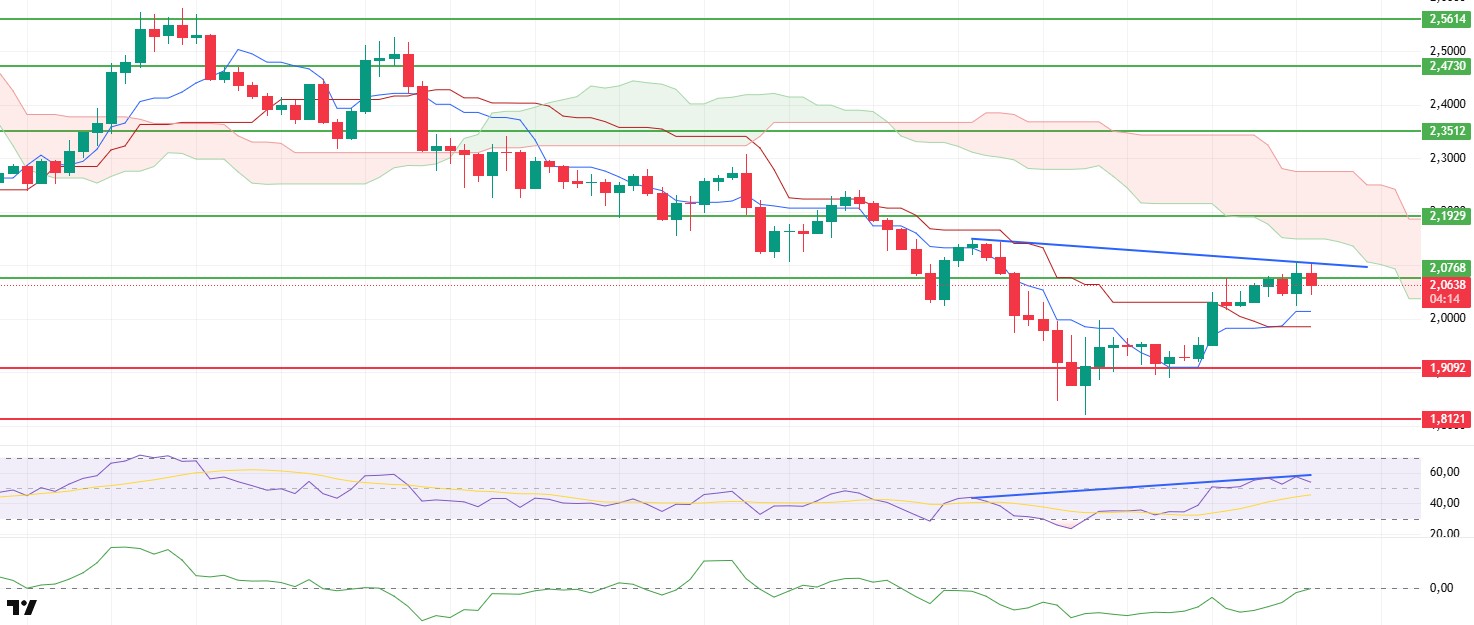
The XRP price fell below the $1.90 level on Friday, retreating to the $1.81 support level, but strong buying from this area allowed the price to recover over the weekend. With this recovery, the price rose to the $2.07 resistance level and is currently attempting to break through this level. It is clear that buyers are regaining strength in the short term.
The Chaikin Money Flow (CMF) indicator has risen to the zero line, signaling that the recent heavy liquidity outflows have stopped and that a stabilization process has begun in the market. The approach of liquidity to the neutral zone indicates that buyers are gradually returning to the market.
The Relative Strength Index (RSI) rising above the 50 level reflects gaining momentum. However, the negative divergence forming in the indicator serves as a warning that the price may correct somewhat during the day. Although the upward trend continues, the possibility of interim pullbacks remains on the table.
In the Ichimoku indicator, the price rising above the Tenkan and Kijun levels and the Tenkan line crossing the Kijun upwards is a significant development supporting the short-term positive outlook. However, the price remaining below the kumo cloud indicates that the main trend has not yet fully turned positive.
The strengthening of CMF and Ichimoku in the overall outlook increases the likelihood of the uptrend continuing if the $2.07 resistance level is broken. However, the negative divergence in the RSI suggests that a rejection from this level could trigger minor pullbacks. Sustained movement above $2.07 could strengthen the uptrend.
Supports: 2.0768 – 1.9092 – 1.7729
Resistances: 2.1929 – 2.3512 – 2.4730
SOL/USDT
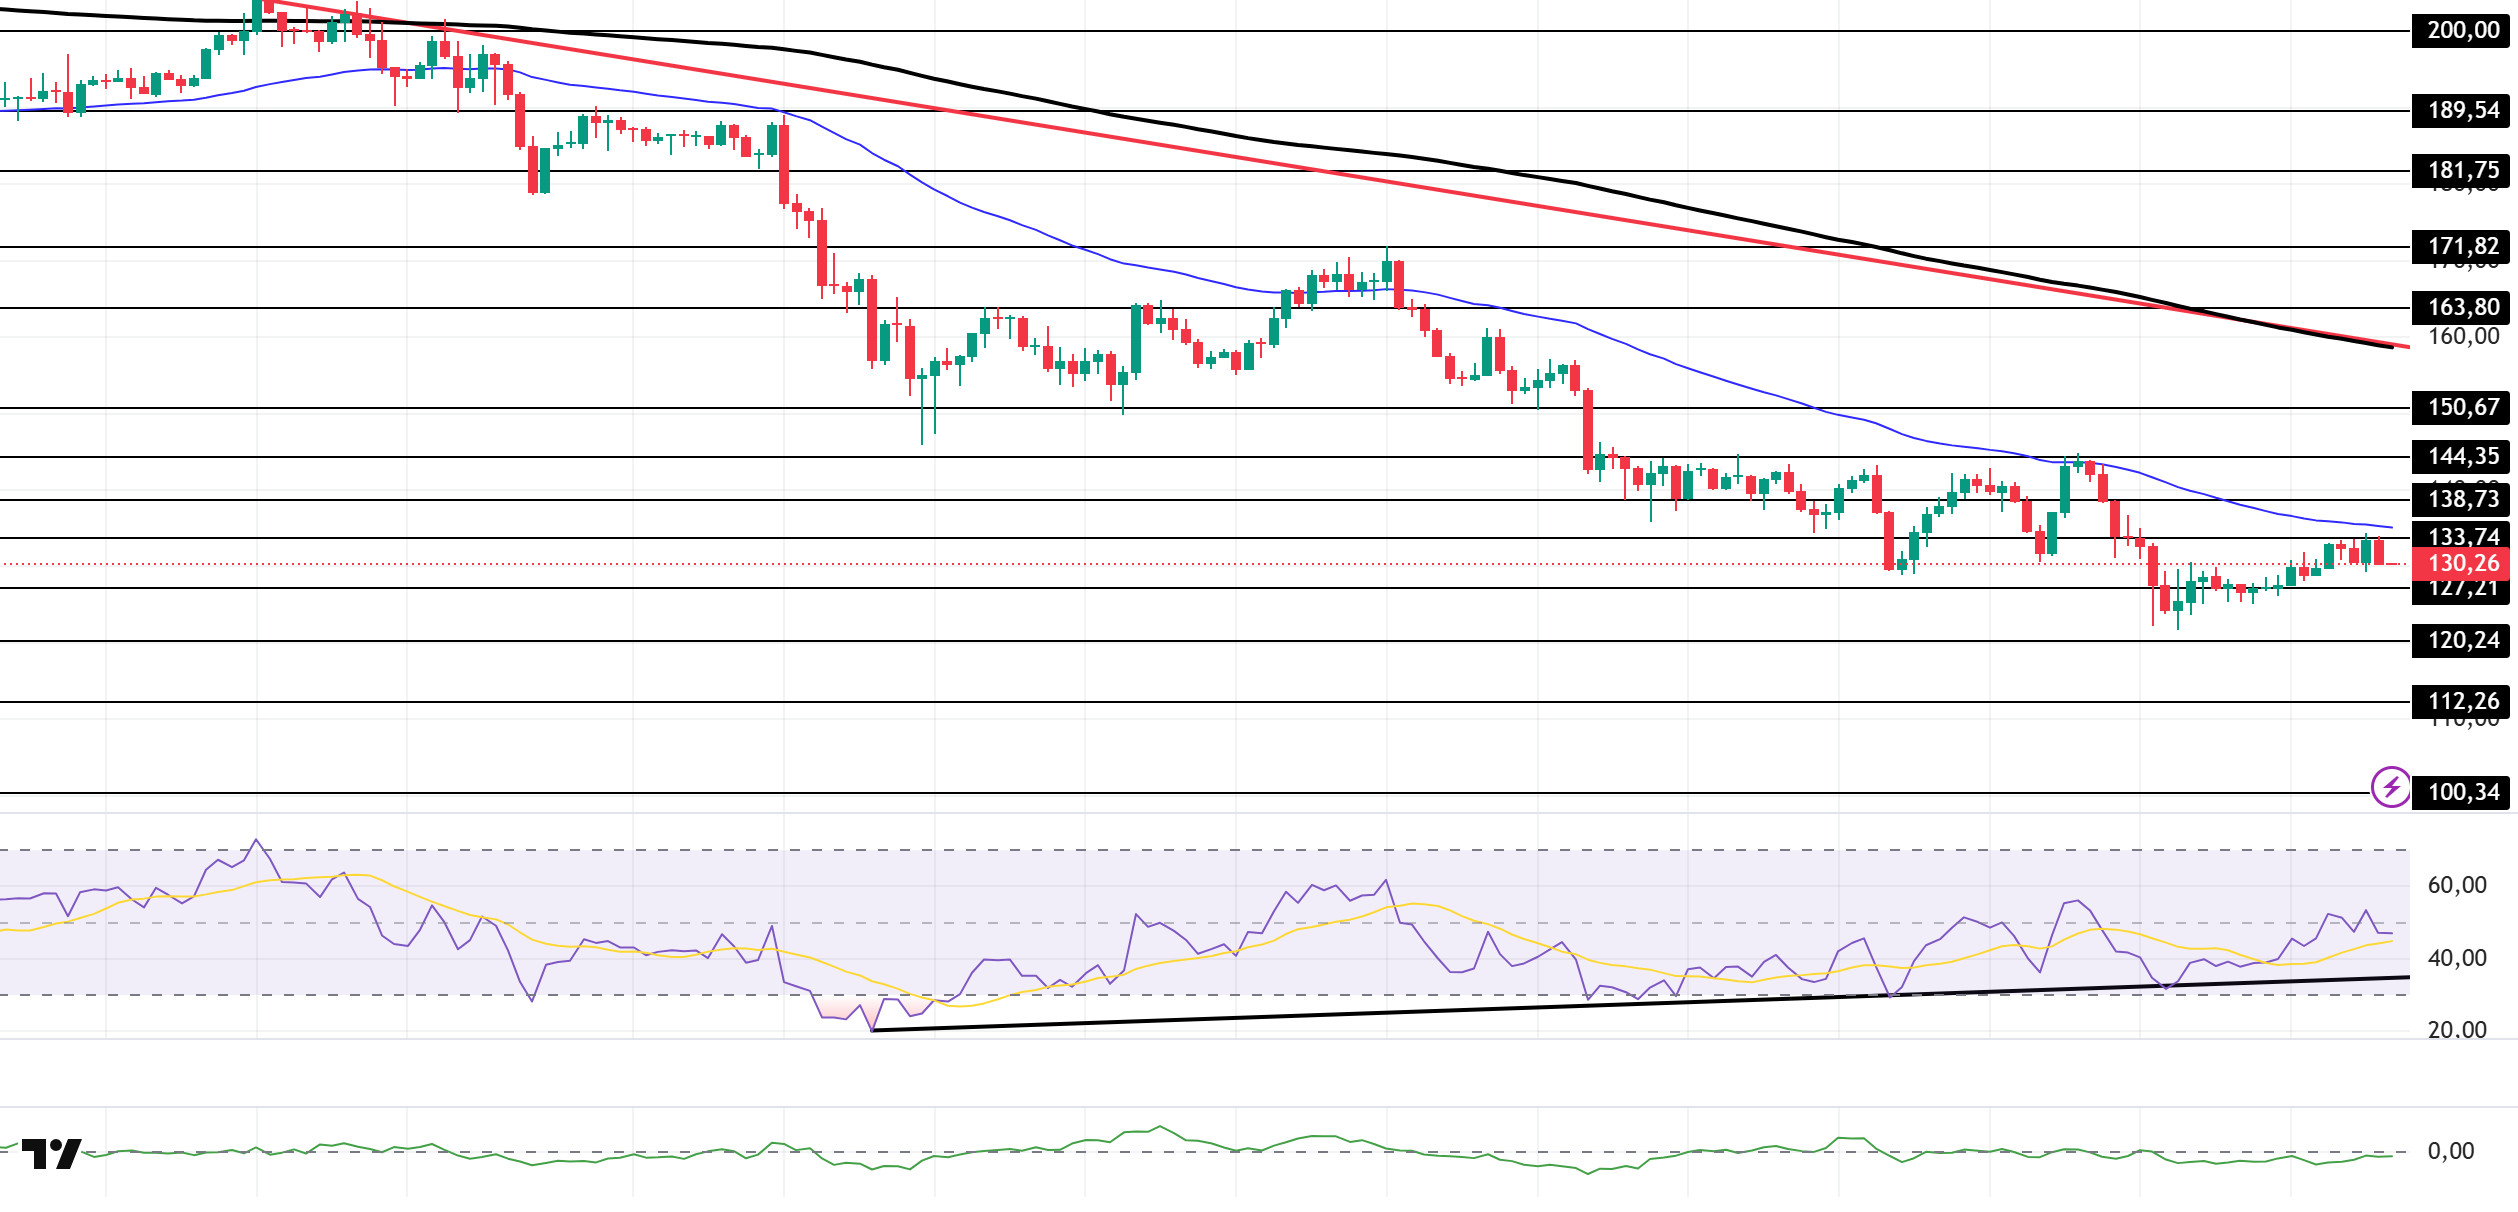
The SOL price showed a slight increase. The asset continued to trade in the lower region of the downtrend that began on October 6. Starting to gain momentum from the strong support level of $120.24, the price is currently testing the 50 EMA (Blue Line) moving average and the $133.74 level as resistance. If the uptrend continues, it could test the $150.67 level. If a pullback begins, the $120.24 level could be triggered again.
The price remained below the 50 EMA (Exponential Moving Average – Blue Line) and 200 EMA (Black Line) on the 4-hour chart. This indicates a possible downtrend in the medium term. At the same time, the price being below both moving averages shows us that the asset is trending downward in the short term. On the other hand, the gap between the two moving averages shows that the asset may experience a horizontal or upward movement. Chaikin Money Flow (CMF-20) rose to a neutral level. However, the decrease in cash inflows may push the CMF into negative territory. The Relative Strength Index (RSI-14) has risen to the positive zone. It has also remained above the upward trend that began on November 4. This indicates that buying pressure continues. If an upward movement occurs due to macroeconomic data or positive news related to the Solana ecosystem, the $150.67 level stands out as a strong resistance point. If this level is broken upwards, the rise is expected to continue. If there are pullbacks due to developments in the opposite direction or profit-taking, the $112.26 level could be tested. A decline to these support levels could increase buying momentum, presenting a potential opportunity for an uptrend.
Supports: 127.21 – 120.24 – 112.26
Resistances: 133.74 – 138.73 – 144.35
DOGE/USDT
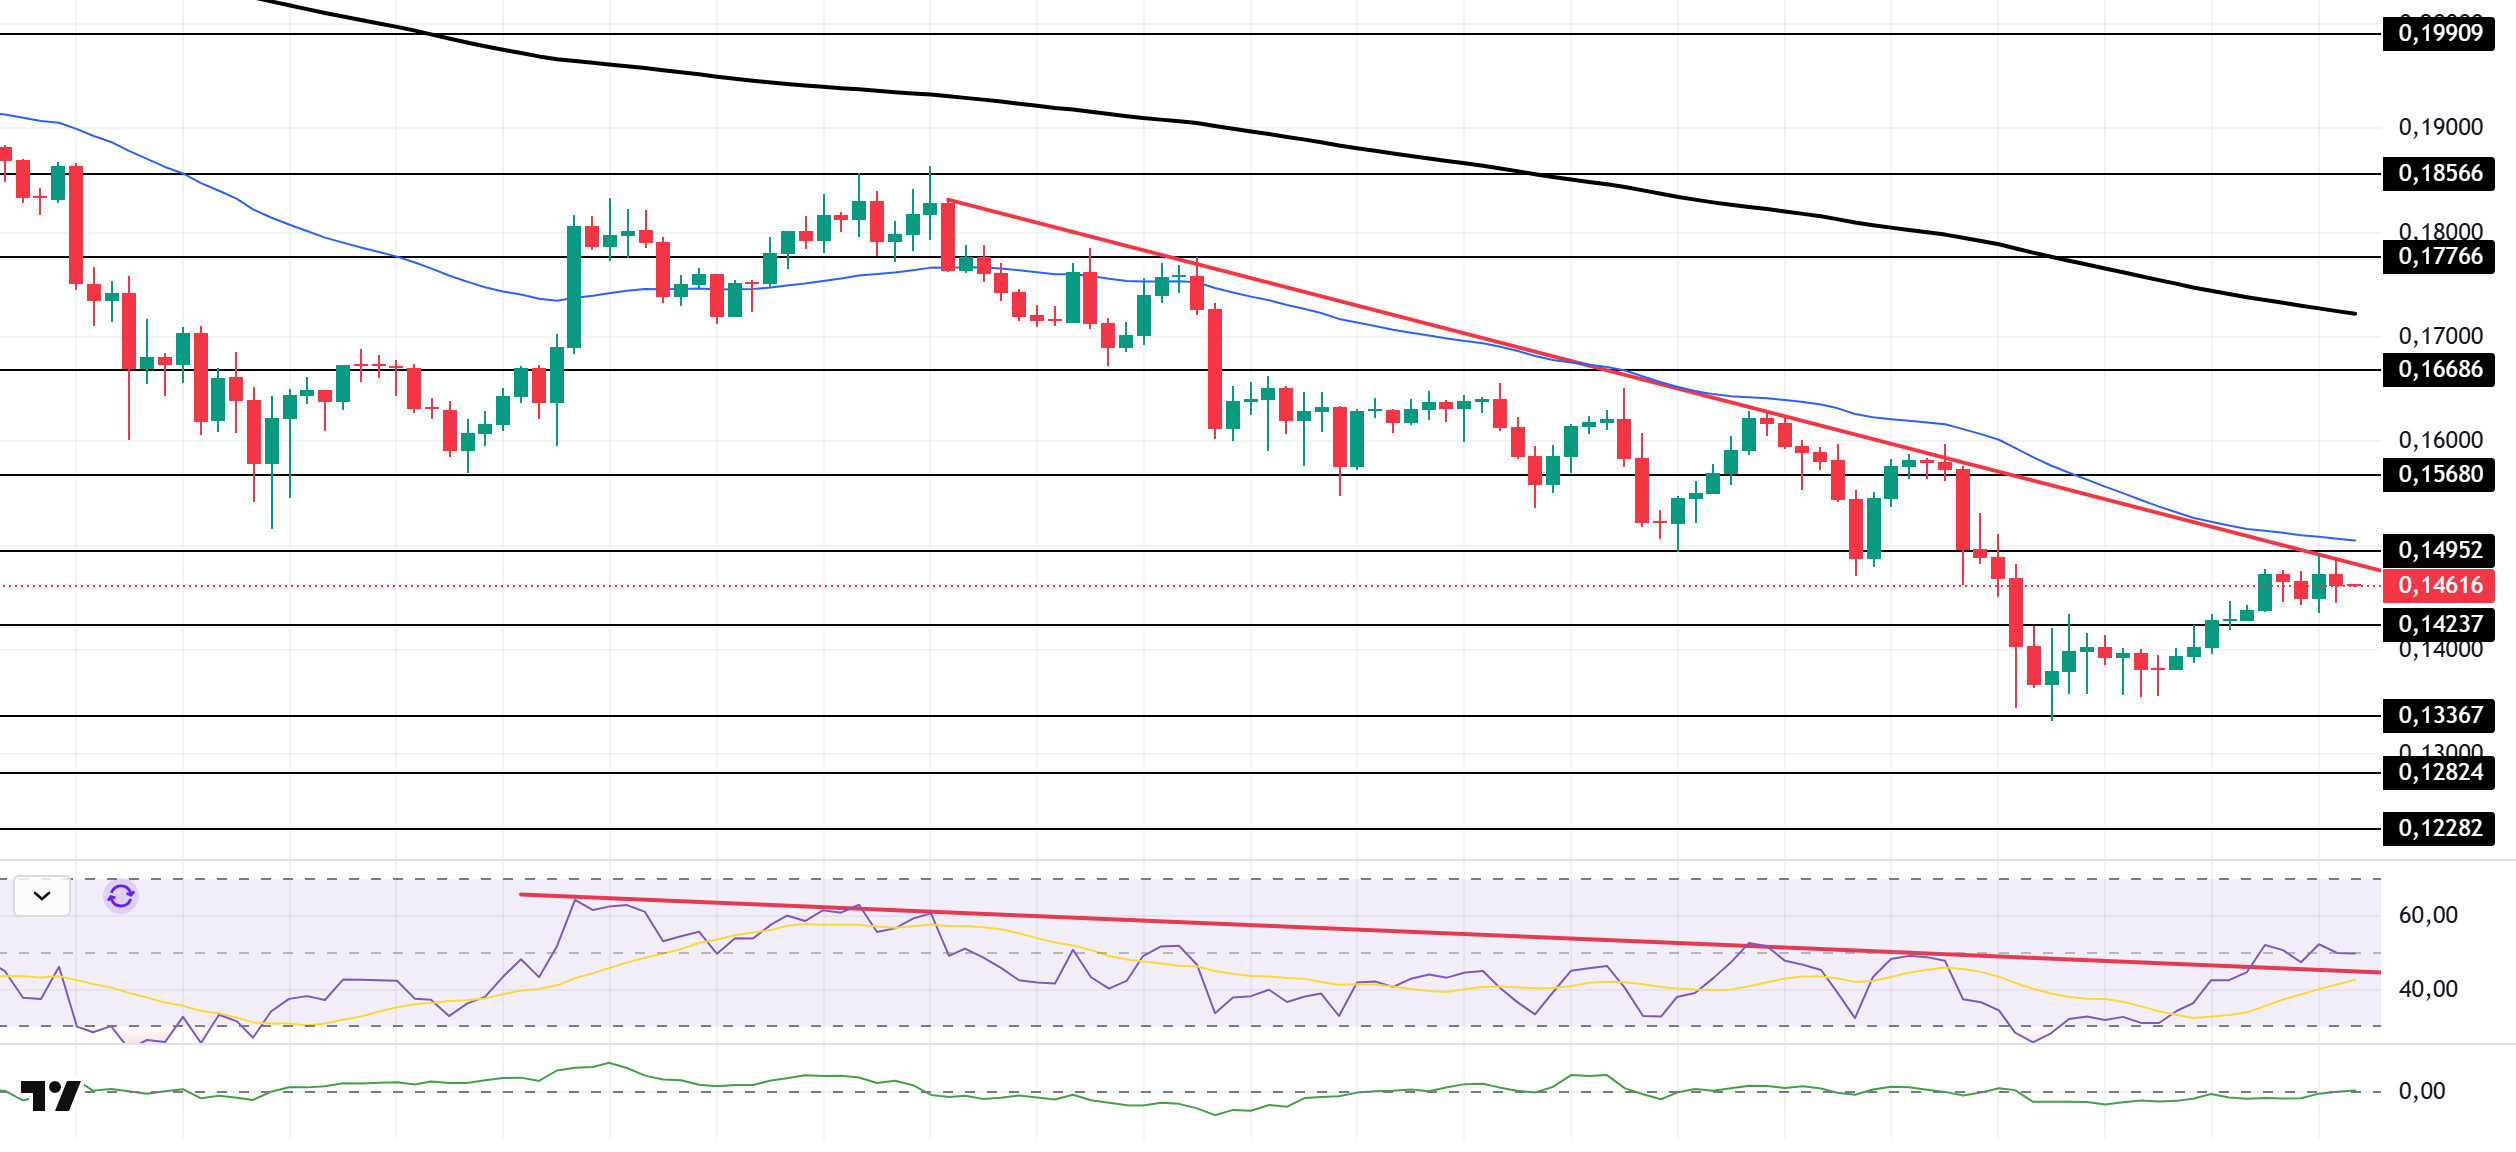
The DOGE price experienced an uptrend. The asset continued to trade in the lower region of the downtrend that began on November 11. Gaining momentum from the $0.13367 level, the price is currently testing the downward trend line and the 50 EMA (Blue Line) moving average as resistance. If it breaks above this level, it could test the 200 EMA (Black Line) moving average. In case of a pullback, it could retest the $0.13367 level.
On the 4-hour chart, the 50 EMA (Exponential Moving Average – Blue Line) remained below the 200 EMA (Black Line). This indicates that a downtrend may begin in the medium term. The price being below both moving averages indicates a downward trend in the short term. On the other hand, the large difference between the two moving averages increases the potential for the asset to move sideways or upward. The Chaikin Money Flow (CMF-20) is at a neutral level. Additionally, a decrease in cash inflows could push the CMF into negative territory. The Relative Strength Index (RSI-14) has accelerated into positive territory. At the same time, it has started to move into the upper region of the downward trend that began on November 10. This has increased buying pressure. In the event of potential increases due to political developments, macroeconomic data, or positive news flow in the DOGE ecosystem, the $0.15680 level stands out as a strong resistance zone. Conversely, in the event of negative news flow, the $0.12824 level could be triggered. A decline to these levels could increase momentum and initiate a new wave of growth.
Supports: 0.14237 – 0.13367 – 0.12824
Resistances: 0.14952 – 0.15680 – 0.16686
SHIB/USDT
The Shiba Inu ecosystem has witnessed a series of developments that have strengthened its position in terms of regulation, institutional access, and ETF expectations, even during a period of sustained selling pressure. Among the headlines highlighted by the project team as “cool facts,” its regulatory status in Japan stands out. SHIB’s inclusion in the Green List prepared by the Japan Virtual Currency Exchange Association (JVCEA), which oversees the country’s crypto market, means that the asset is now in the same category as leading cryptocurrencies such as Bitcoin and Ethereum. This status is not merely a technical approval; it allows exchanges in a market with strict regulations like Japan to list SHIB with fewer bureaucratic hurdles, making it more accessible to local investors. Furthermore, when the tax framework expected by the Financial Services Agency (FSA) comes into effect, the prospect that SHIB investments could be taxed at around 20% instead of the current approximate 55% rate stands out as a significant incentive that could boost investor interest in the region.
In parallel with this regulatory landscape, the launch of Shiba Inu futures by US-based major exchange Coinbase under the “1k SHIB index” product, enabling 24/7 trading, deepens the token’s integration with institutional derivatives markets. The global availability of regulated SHIB futures contracts makes SHIB an easier instrument for professional investors to incorporate into their portfolio strategies and increases its visibility. On the project side, this step is interpreted as a strategic threshold signaling a period in which Shiba Inu is gradually approaching the path Bitcoin and Ethereum followed in the past in terms of its regulatory roadmap; this naturally brings potential scenarios surrounding spot ETF products more into focus for the future.
In this context, while Shiba Inu is currently represented in Europe as an exchange-traded product (ETP), it is among the names expected to be included in the basket ETF structure planned by T Rowe Price in the US. On the other hand, there is currently no independent spot ETF focused solely on SHIB in the market. Nevertheless, asset management company Grayscale’s inclusion of SHIB among crypto assets eligible for approval under the SEC’s Generic Listing Standard has raised the question of whether the door is opening for a dedicated Shiba Inu ETF in the medium to long term. The project team emphasizes that the size of the community, the projects developed within the ecosystem, and the steps taken in the regulatory field have been decisive in reaching this point. Looking at the overall picture, despite price fluctuations, it can be said that Shiba Inu is entering a period where it is gradually establishing itself within a more institutional framework, both in terms of regulation and institutional products.
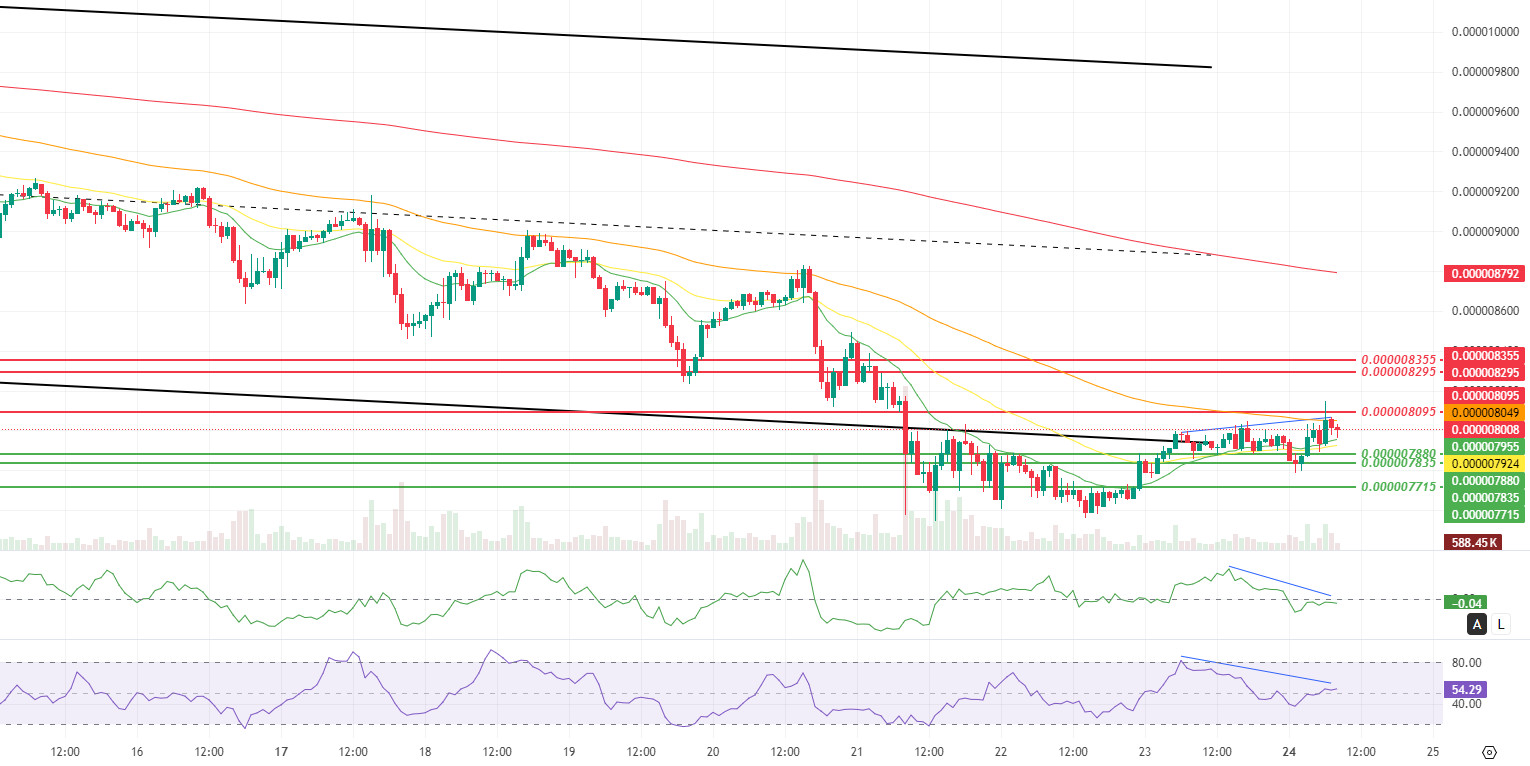
The technical chart, with new data, shows that the consolidation process in the bottom region highlighted in our previous analysis is progressing more actively but still under pressure. The increase observed in volume momentum and volatility indicates that price dynamics are reviving, while the Chaikin Money Flow (CMF) indicator remaining in negative territory suggests that this movement is not supported by strong and healthy capital inflows. The price breaking above the 9-period and 21-period Smoothed Moving Averages (SMMA) reveals that short-term buyers have re-entered the market, while the rejection from the 50-period SMMA stands out as an important threshold confirming that the main trend pressure has not yet been broken. After breaking below the lower band of the descending channel, the price returning to the channel increases the possibility of a trap breakout in the short term and the risk of a sharp move within the squeeze area. The negative divergence (Blue Line) between the price and the Money Flow Index (MFI) and CMF oscillators indicates that, despite upward attempts, buying pressure has not strengthened to the same extent and that the current rebound carries the risk of remaining limited.
Under this outlook, the levels passing through $0.000007880, $0.000007835, and $0.000007715 are the most critical support areas in the short term. If the price continues to hold above this band, the level at $0.000008095 will emerge as the first short-term resistance threshold. If sustainability is achieved above this level, the rebound could extend towards the resistance levels at $0.000008295 and $0.000008355, respectively. Breaking through these intermediate resistances with increasing volume and momentum could pave the way for a more meaningful recovery scenario within the falling channel. Conversely, a deepening negative CMF structure and a downward break of the support at $0.000007880 could cause the movement to dip towards the levels at $0.000007835 and $0.000007715, which would indicate a return to a weakening selling phase within the descending channel and increase the risk that the current rebound attempt will remain a limited respite within the medium-term primary downtrend.
(SMMA9: Green Line, SMMA21: Yellow Line, SMMA50: Orange Line, SMMA 200: Red Line)
Supports: 0.000007880 – 0.000007835 – 0.000007715
Resistances: 0.000008095 – 0.000008295 – 0.000008355
SUI/USDT
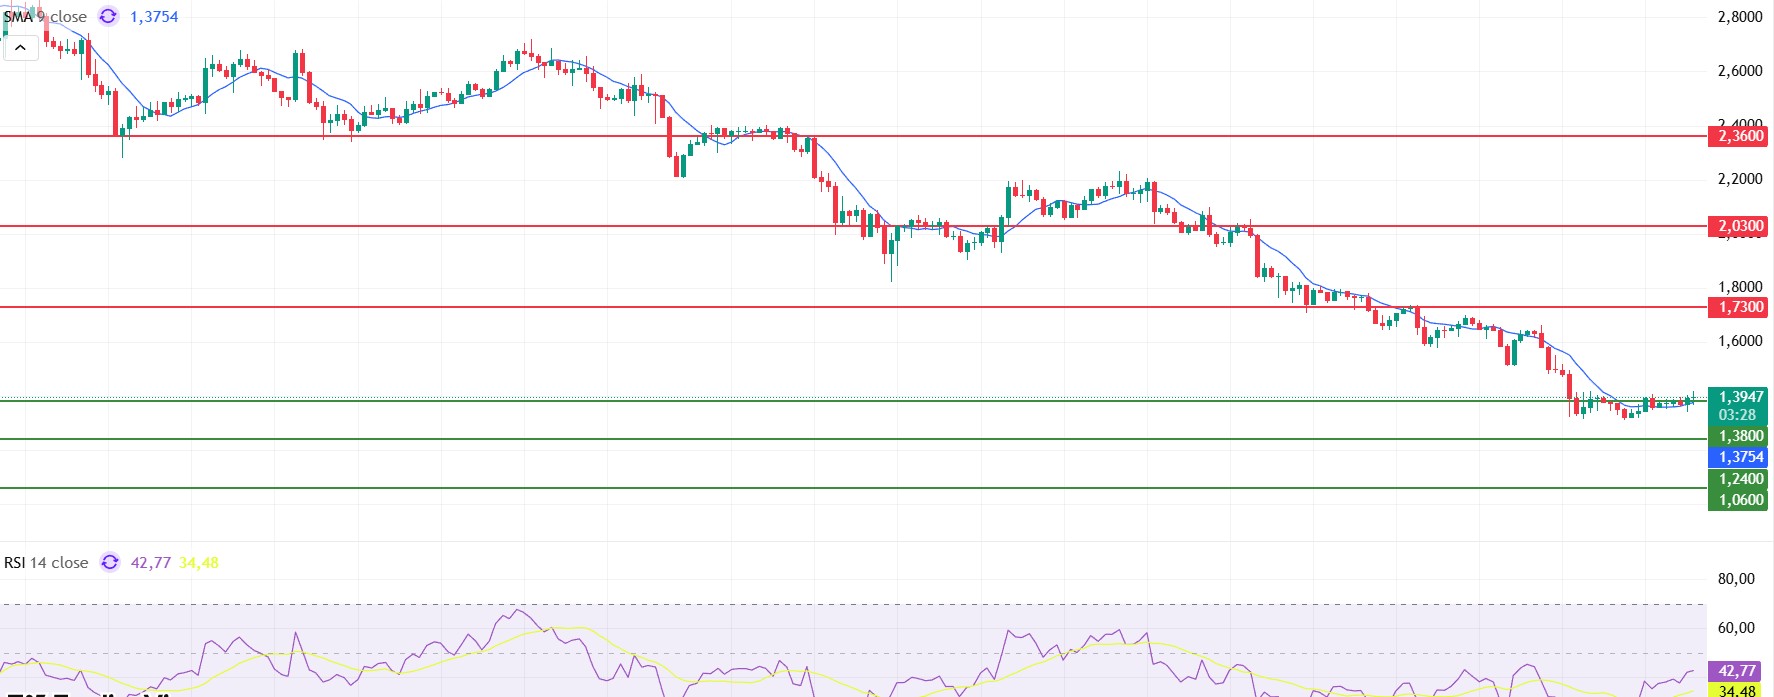
Looking at Sui’s technical outlook, we see that, influenced by fundamental developments, the price has been moving sideways at around $1.39 on a 4-hour basis. The Relative Strength Index (RSI) is currently in the range of 42.71 – 34.48. This range indicates that the market is trading close to the buy zone; a drop in the RSI to the 45.00 – 35.00 range could signal a potential buying point. If the price moves upward, the resistance levels of $1.73, $2.03, and $2.36 can be monitored. However, if the price retreats to new lows, it could indicate deepening selling pressure. In this case, the support levels of $1.36, $1.24, and $1.06 come to the fore. Based on the trend line, a pullback to $1.06 appears technically possible. According to Simple Moving Averages (SMA) data, Sui’s average price is currently at $1.37. The price remaining above this level indicates that the current uptrend could technically continue.
Supports: 1.06 – 1.24 – 1.38
Resistances: 1.73 – 2.03 – 2.36
Legal Notice
The investment information, comments, and recommendations contained herein do not constitute investment advice. Investment advisory services are provided individually by authorized institutions taking into account the risk and return preferences of individuals. The comments and recommendations contained herein are of a general nature. These recommendations may not be suitable for your financial situation and risk and return preferences. Therefore, making an investment decision based solely on the information contained herein may not produce results in line with your expectations.

