
Technical Analysis
BTC/USDT
As the crisis in the Middle East triggered diplomacy, US President Trump called for reconciliation, saying “Make the Middle East great again”. Israeli Prime Minister Netanyahu’s Iran Iran’s statements on the possibility of regime change in Israel brought geopolitical tensions to a new level. While the economic effects of the Iran-Israel tension were also felt, gold prices approached record highs, reinforcing its safe-haven status. On the other hand, in the digital asset market, Michael Saylor’s Bitcoin consultancy agreement with Pakistan, Metaplanet’s BTC reserve increase to 10,000 and new buying signals show that institutional actors’ Bitcoin strategies continue regardless of the agenda. Today, Strategy’s Bitcoin purchase details and the news flow from the US, Israel and Iran regarding the Middle East will be followed.
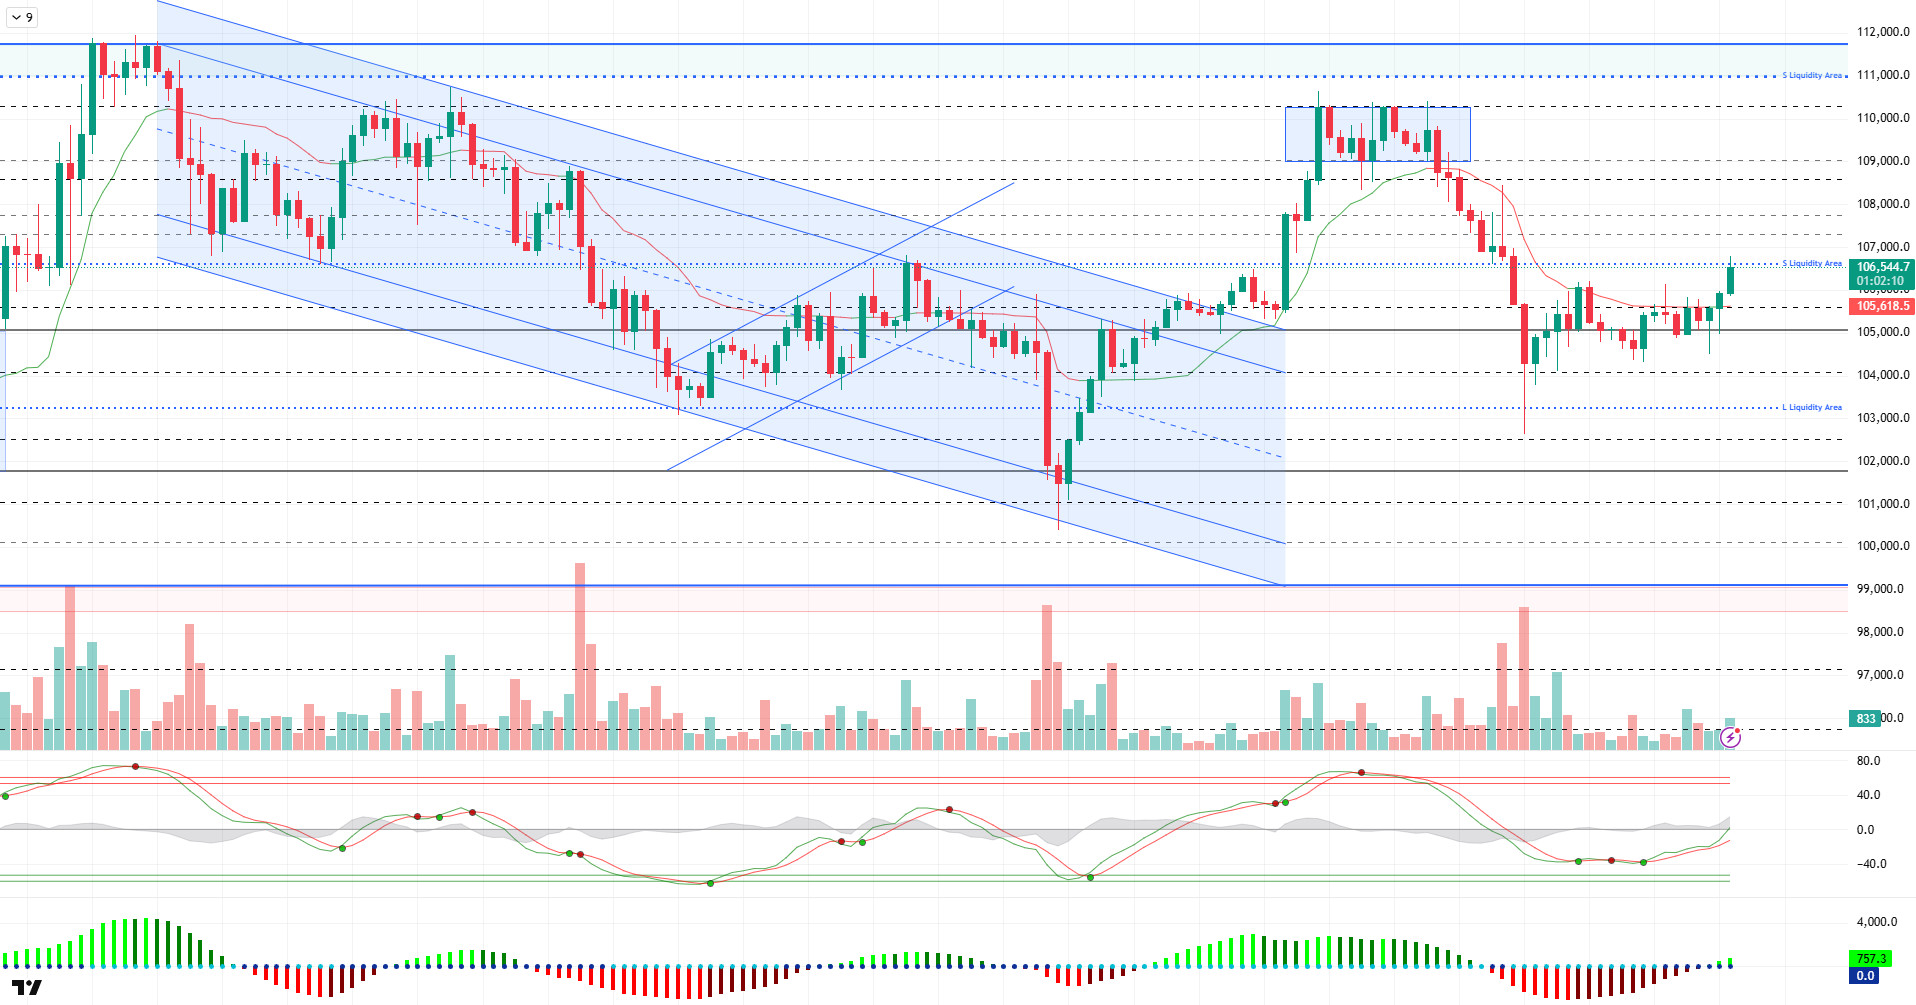
When we look at the technical outlook after the latest developments, it is seen that BTC, which experienced a short-term retreat due to the impact of fundamental developments, tends to recover again. BTC, which spent the weekend above the 105,000 support level, continues to be traded at the level of 106,700, maintaining above this support on the first trading day of the week.
Looking at the technical indicators, the wave trend oscillator started to generate a buy signal after staying in the oversold zone for a while and reached the channel mid-band. Squeeze momentum indicator also moved into positive territory, supporting the minor uptrend. The Kaufman moving average at 105,600 remains below the price, giving technical confirmation to the current bullish move.
When the liquidity data is analyzed, as can be seen in the chart, it is noteworthy that buying positions were concentrated in the 103.400 support zone, while selling positions were liquidated by exceeding 106.600 resistance. On a broader scale, it is observed that the sell trades opened near the ATH level are still open.
As a result, it seems that the effects of the short-term decline have been largely completed and BTC has resumed its bullish structure by turning its direction upwards again. Technical indicators and liquidity data support this recovery. In the next process, closures within the 106,600 and 107,300 band are critical for the continuation of the uptrend. In case of persistence above this band, it may become possible for the price to move towards the ATH level again later in the week. On the other hand, in a possible selling pressure, the 105,000 – 105,850 band will be the first support area to be followed in order to maintain persistence in the positive zone. If this level is broken, there may be a short-term spike and liquidity intake again.
Supports 105,850 – 105,000 – 104,000
Resistances 106,600 – 107,300 – 108,600
ETH/USDT
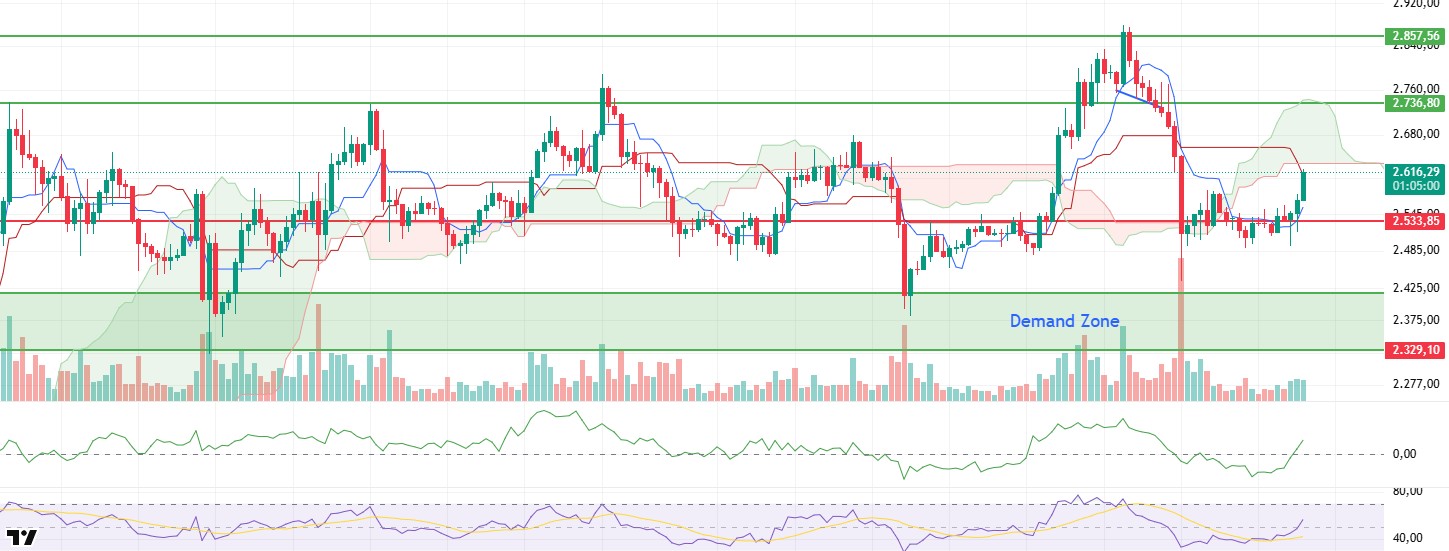
Although Ethereum fell below the $2,533 level on Friday last week due to the rising geopolitical tensions between Iran and Israel, it managed to turn its direction upwards again with the purchases coming from this region and rose up to the kijun level. This recovery has positive signals not only in terms of price but also in terms of technical indicators and on-chain data.
Cumulative Volume Delta (CVD) data reveals that the majority of the buying activity came from the futures market and demand in the spot market remained relatively weak. Although this outlook raises some question marks in terms of the persistence of the price action, the decline in the long-short ratio suggests that short positions are increasing in the market, which may support the positive pricing of the price by increasing the possibility of a potential short squeeze.
On the liquidity side, the Chaikin Money Flow (CMF) indicator shifted sharply into positive territory. This development indicates that the money entering the market has started to increase in volume and the buy side is regaining strength, while the positive outlook in structural terms comes to the fore. The rise in CMF also suggests that the price is supported not only by technicals but also by liquidity.
On the momentum side, the upward movement of the Relative Strength Index (RSI) indicator above the 50 level indicates that the market is gaining momentum and that the current uptrend is not just reaction buying but has the potential for a broader recovery. The absence of any negative divergence in the RSI also indicates that this rise is taking place on a healthy ground.
When the Ichimoku indicator is analyzed, the fact that the price is still below the kumo cloud indicates that a clear trend reversal has not yet been confirmed in technical terms. However, the upward trend of the tenkan line and the price moving towards the lower band of the cloud suggests that the positive scenario is gaining weight. If the price is able to break the lower band of this cloud and maintain its permanence above it, technically, it may be possible for the bullish movement to gain more momentum. In this case, the next resistance levels can be followed , while the price starting to move in the cloud can be considered as a preliminary signal of a trend change.
Looking at the overall picture, it is seen that the ground for upward pricing is strengthening with the recovery signals in technical and on-chain indicators. However, in order for this positive scenario to remain valid, it is critical for the price to remain above the $2,533 support. This level is a threshold that shapes the confidence of market participants not only in the short term but also structurally. If it sags below this support and closes here, the likelihood of accelerating selling pressure and sharper pullbacks will increase. Therefore, the $2,533 level stands out not only as a technical support but also as a decisive reference point in terms of the direction of the overall trend.
Top of Form
Below the Form
Supports 2,533 – 2,329 – 2,130
Resistances 2,736 – 2,857 – 3,062
XRP/USDT
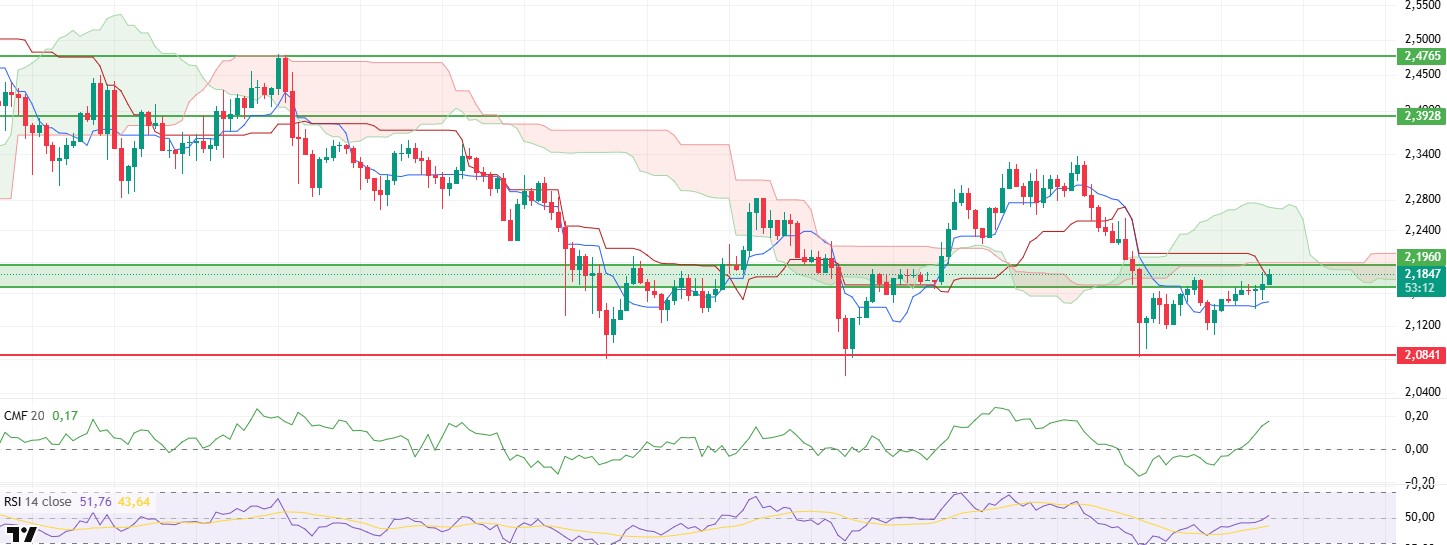
After a sharp drop on Friday, XRP rebounded over the weekend, reaching as high as $2.18. This upward movement can make sense, especially with the regaining of the transition area drawn as the green zone on the chart. Persistence above the said zone may increase the expectations that the price can continue its upward movement in technical terms.
When technical indicators are analyzed, it is seen that Chaikin Money Flow (CMF) data has moved sharply into positive territory. This indicates that the liquidity entering the market is increasing and the buy side is gaining strength. However, despite the transition to positive territory in this indicator, the risk of a potential negative divergence between the price and the indicator still remains. This suggests that structurally, the uptrend has not yet fully settled on a healthy ground and there are question marks about the continuity of the buying volume.
On the momentum side, the upward trend in the Relative Strength Index (RSI) indicator paints a more positive picture. As the RSI rises, the indicator moves above the based MA line, indicating not only that momentum is strengthening, but also that the bullish trend is becoming healthier.
When the Ichimoku indicator is analyzed, it is seen that the price has risen above both tenkan and kijun levels. This development can be considered as a positive short-term technical signal. However, the fact that the price is still trading below the kumo cloud indicates that the transformation in the main trend has not yet been confirmed. Therefore, it is critical for the price to break the lower band of the cloud during the day in order for the bullish movement to gain a more solid ground. If this level is breached, XRP’s upside potential can be expected to expand to the upper band of the kumo cloud at $2.27. This area should be monitored as the next strong resistance line.
On the downside, the $2.08 level remains as the main support. A possible closing below this zone may not only deteriorate the short-term outlook, but also trigger deeper and sharper retracements. For this reason, the $2.08 level stands out as a vital threshold both in terms of short-term positions and in terms of maintaining the overall market structure. The general outlook reveals that although short-term technical indicators point to a recovery trend, the price needs to cross certain thresholds and turn this movement into a structural rise.
Supports 2.0841 – 2.0402- 1.6309
Resistances 2.2154 – 2.3928 – 2.4765
SOL/USDT
Invesco has filed for the Solana ETF. Bitwise and Canary added staking to Solana ETF S-1 amendments. Fidelity Spot filed a Solana ETF S-1 application. Franklin Templeton, Galaxy Digital and VanEck submitted updated S-1 documents. Grayscale also filed an updated document and announced a 2.5% fee for potential funds. Earlier this week, the US SEC contacted several potential Solana ETFs. On the other hand, a centralized exchange is launching a decentralized exchange on Solana.
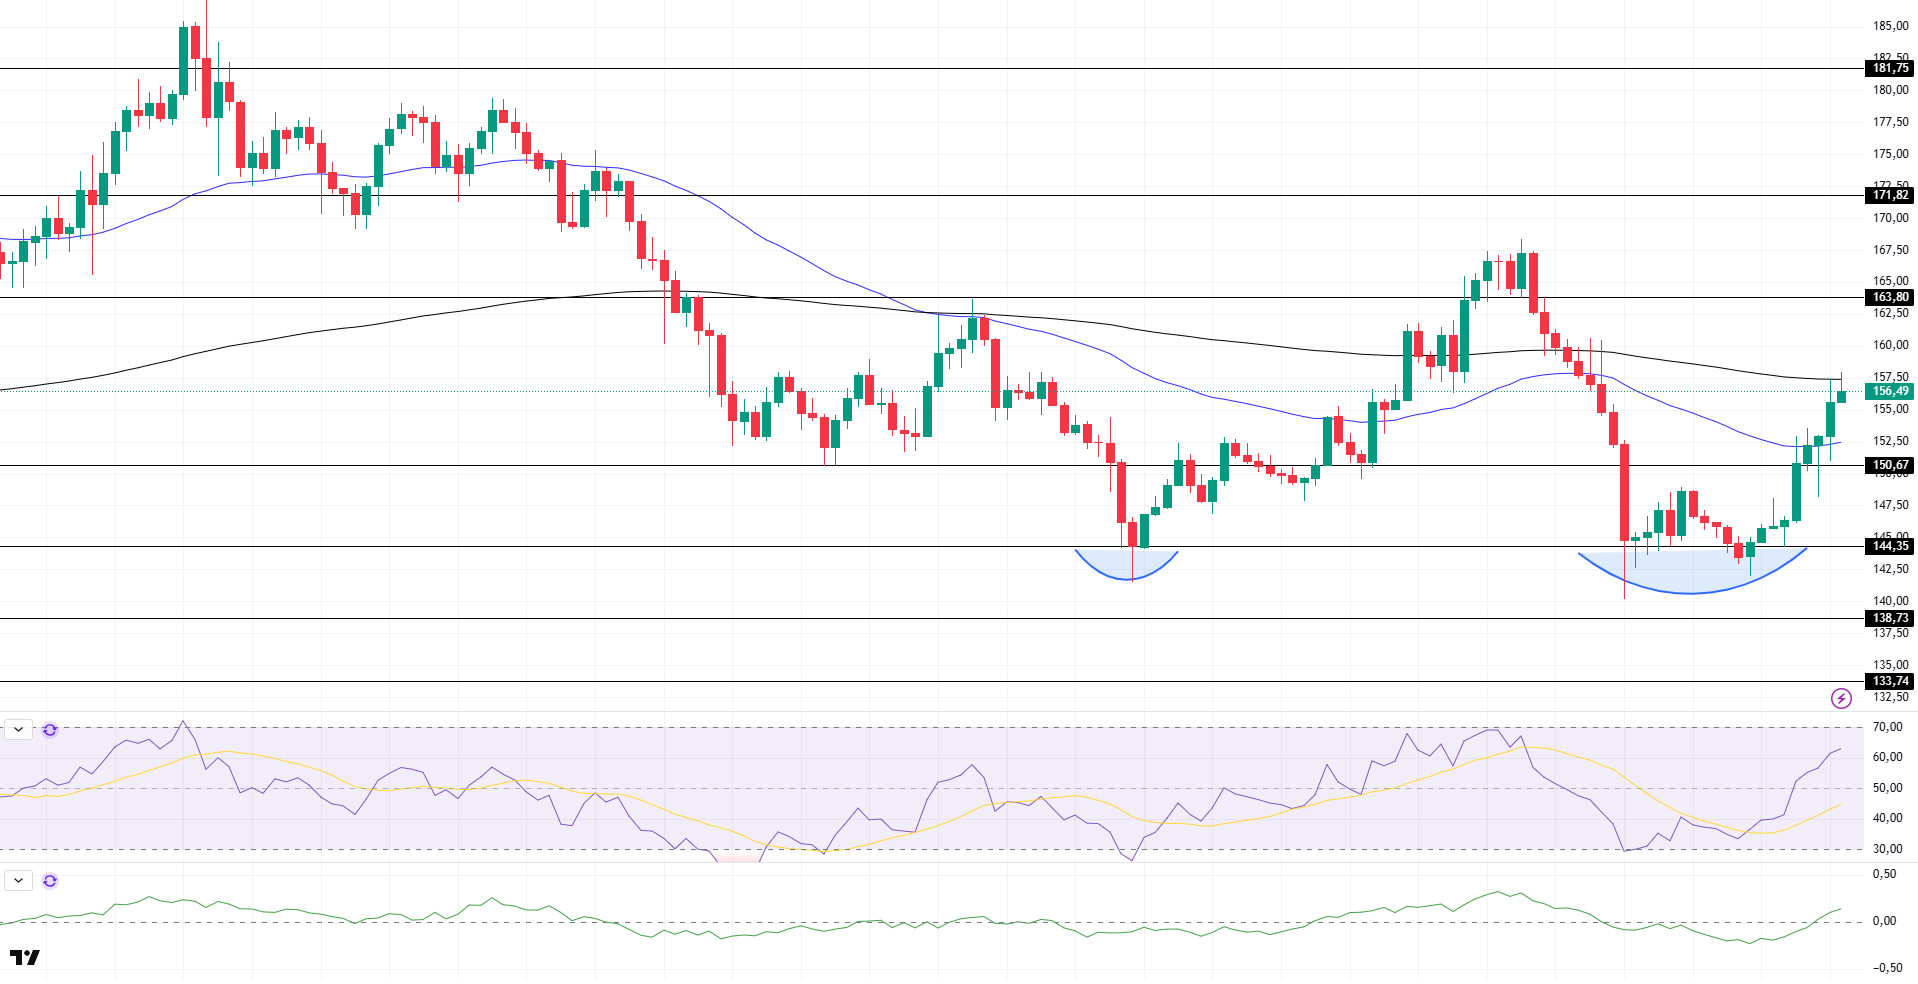
SOL price turned bullish and gained about 9%. The asset managed to stay above the strong support at $144.35 and accelerated to the upside. However, the double bottom formation worked. Breaking the 50 EMA (Blue Line) to the upside, the asset is currently testing the 200 EMA (Black Line) as resistance. If it breaks, the $163.80 level, which is a strong resistance, may be triggered.
On the 4-hour chart, the 50 EMA continued to be below the 200 EMA. This suggests that the bearish trend may continue in the medium term. At the same time, the fact that the price is between both moving averages suggests that the market is currently in a short-term decision-making phase. Chaikin Money Flow (CMF-20) crossed into positive territory; in addition, an increase in daily inflows may push CMF to the top of the positive zone. Relative Strength Index (RSI-14) is at the middle of the positive zone and buying pressure continues. The $163.80 level stands out as a strong point of resistance in the event of a rally on the back of macroeconomic data or positive news on the Solana ecosystem. If this level is broken upwards, the rise can be expected to continue. If there are pullbacks due to contrary developments or profit realizations, the $150.67 level may be retested. In case of a decline to these support levels, the increase in buying momentum may offer a potential bullish opportunity.
Supports 150.67 – 144.35 – 138.73
Resistances 163.80 – 171.82 – 181.75
DOGE/USDT
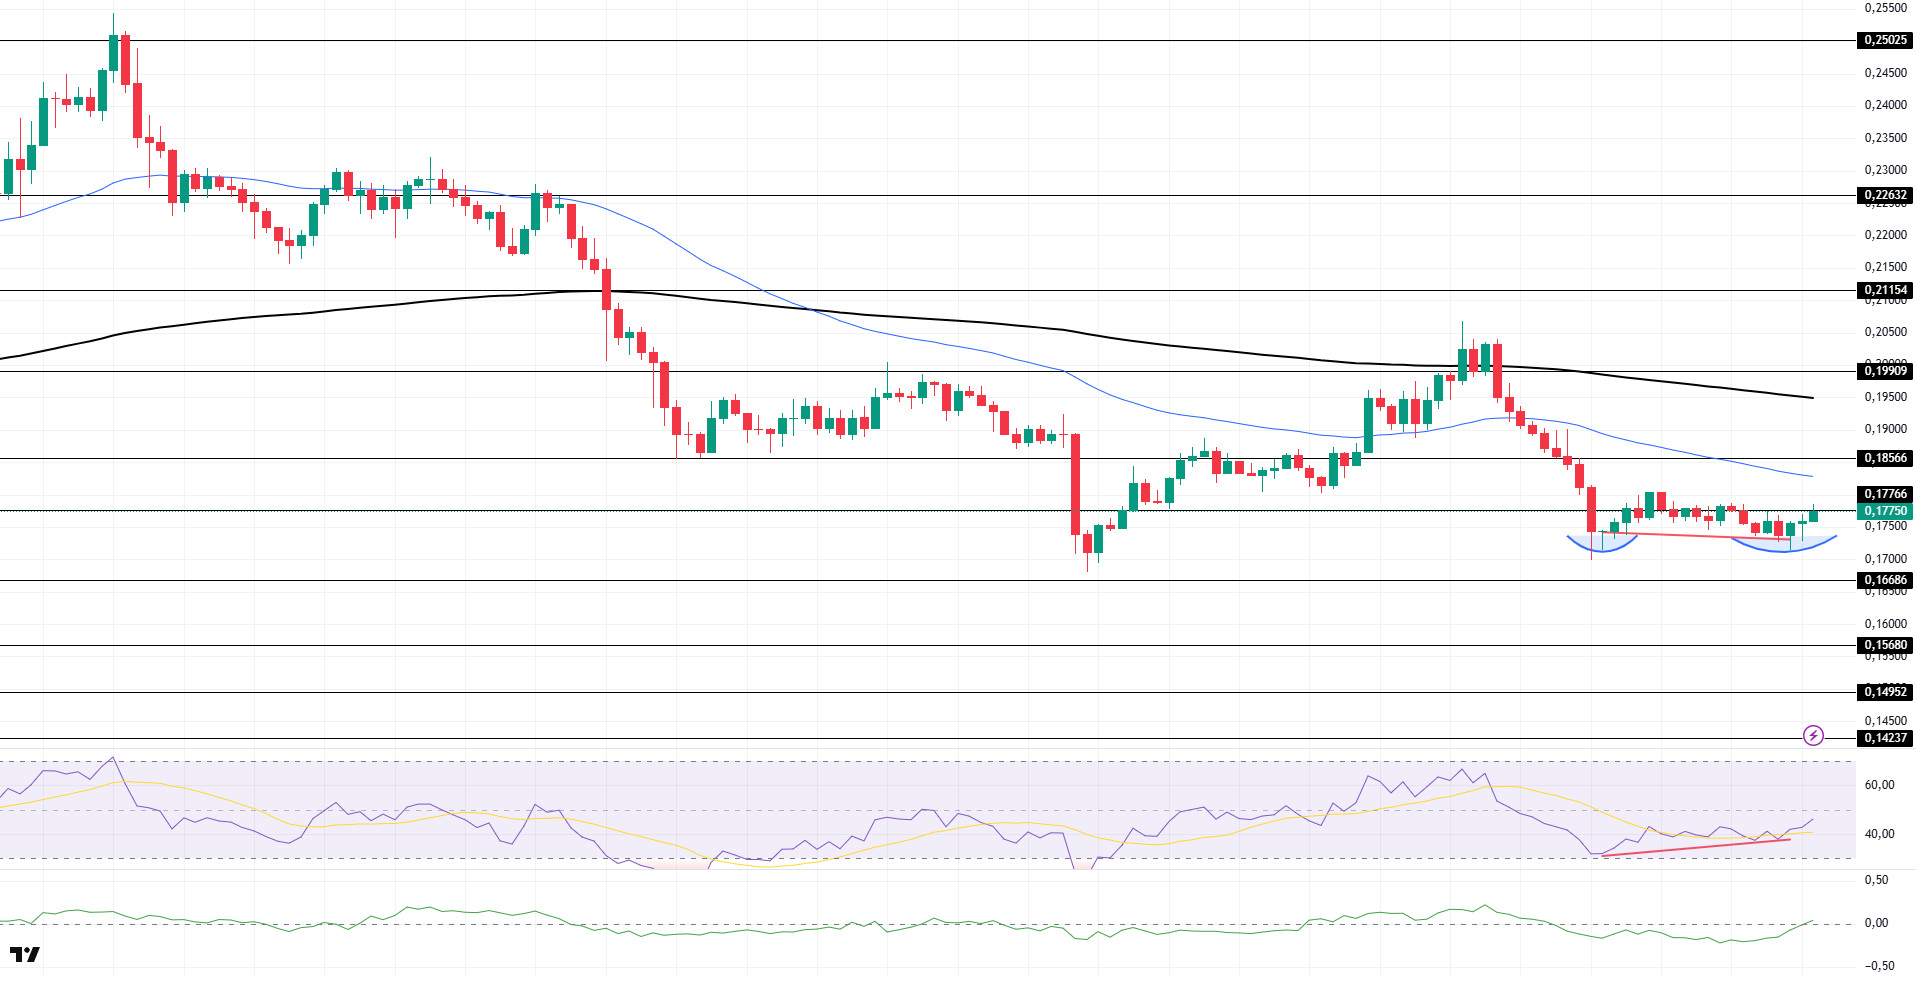
DOGE price continued its sideways trend. Failing to break the strong resistance at $0.17766, the asset may test the 50 EMA (Blue Line) if it breaks there. On the other hand, the double bottom formation may be bullish.
On the 4-hour chart, the 50 EMA (Blue Line) continues to be below the 200 EMA (Black Line). This shows us that the asset is bearish in the medium term. The fact that the price is below the two moving averages suggests that the asset is bearish in the short term. The Chaikin Money Flow (CMF-20) indicator is at a neutral level. In addition, negative money inflows may move CMF into negative territory. Relative Strength Index (RSI-14), on the other hand, remained in the negative territory and rose slightly from the oversold zone. Although this may allow the price to rebound, selling pressure remains. On the other hand, a positive divergence could initiate a rally. The $0.18566 level stands out as a strong resistance zone in case of a rally on the back of political developments, macroeconomic data or positive news flow in the DOGE ecosystem. In the opposite case or possible negative news flow, the $0.16686 level may be triggered. In case of a decline to these levels, the increase in momentum may start a new bullish wave.
Supports 0.16686 – 0.15680 – 0.14952
Resistances 0.17766 – 0.18566 – 0.19909
Legal Notice
The investment information, comments and recommendations contained herein do not constitute investment advice. Investment advisory services are provided individually by authorized institutions taking into account the risk and return preferences of individuals. The comments and recommendations contained herein are of a general nature. These recommendations may not be suitable for your financial situation and risk and return preferences. Therefore, making an investment decision based solely on the information contained herein may not produce results in line with your expectations.