
Technical Analysis
BTC/USDT
U.S. President Donald Trump and Chinese President Xi Jinping reached a comprehensive agreement during their talks. China’s commitment to resume purchases of soybeans, sorghum, and other agricultural products from the US, increase rare earth exports, and limit the flow of fentanyl drew attention. On the Washington front, Treasury Secretary Scott Bessent emphasized that the Fed needed to update its economic forecasts, saying it was “operating with outdated models.” Bessent announced that the new Fed chair could be announced before Christmas. In Europe, the ECB kept interest rates steady at 2% for the third consecutive meeting. The bank opted to maintain its cautious stance due to persistent inflation, despite weak economic growth signals.
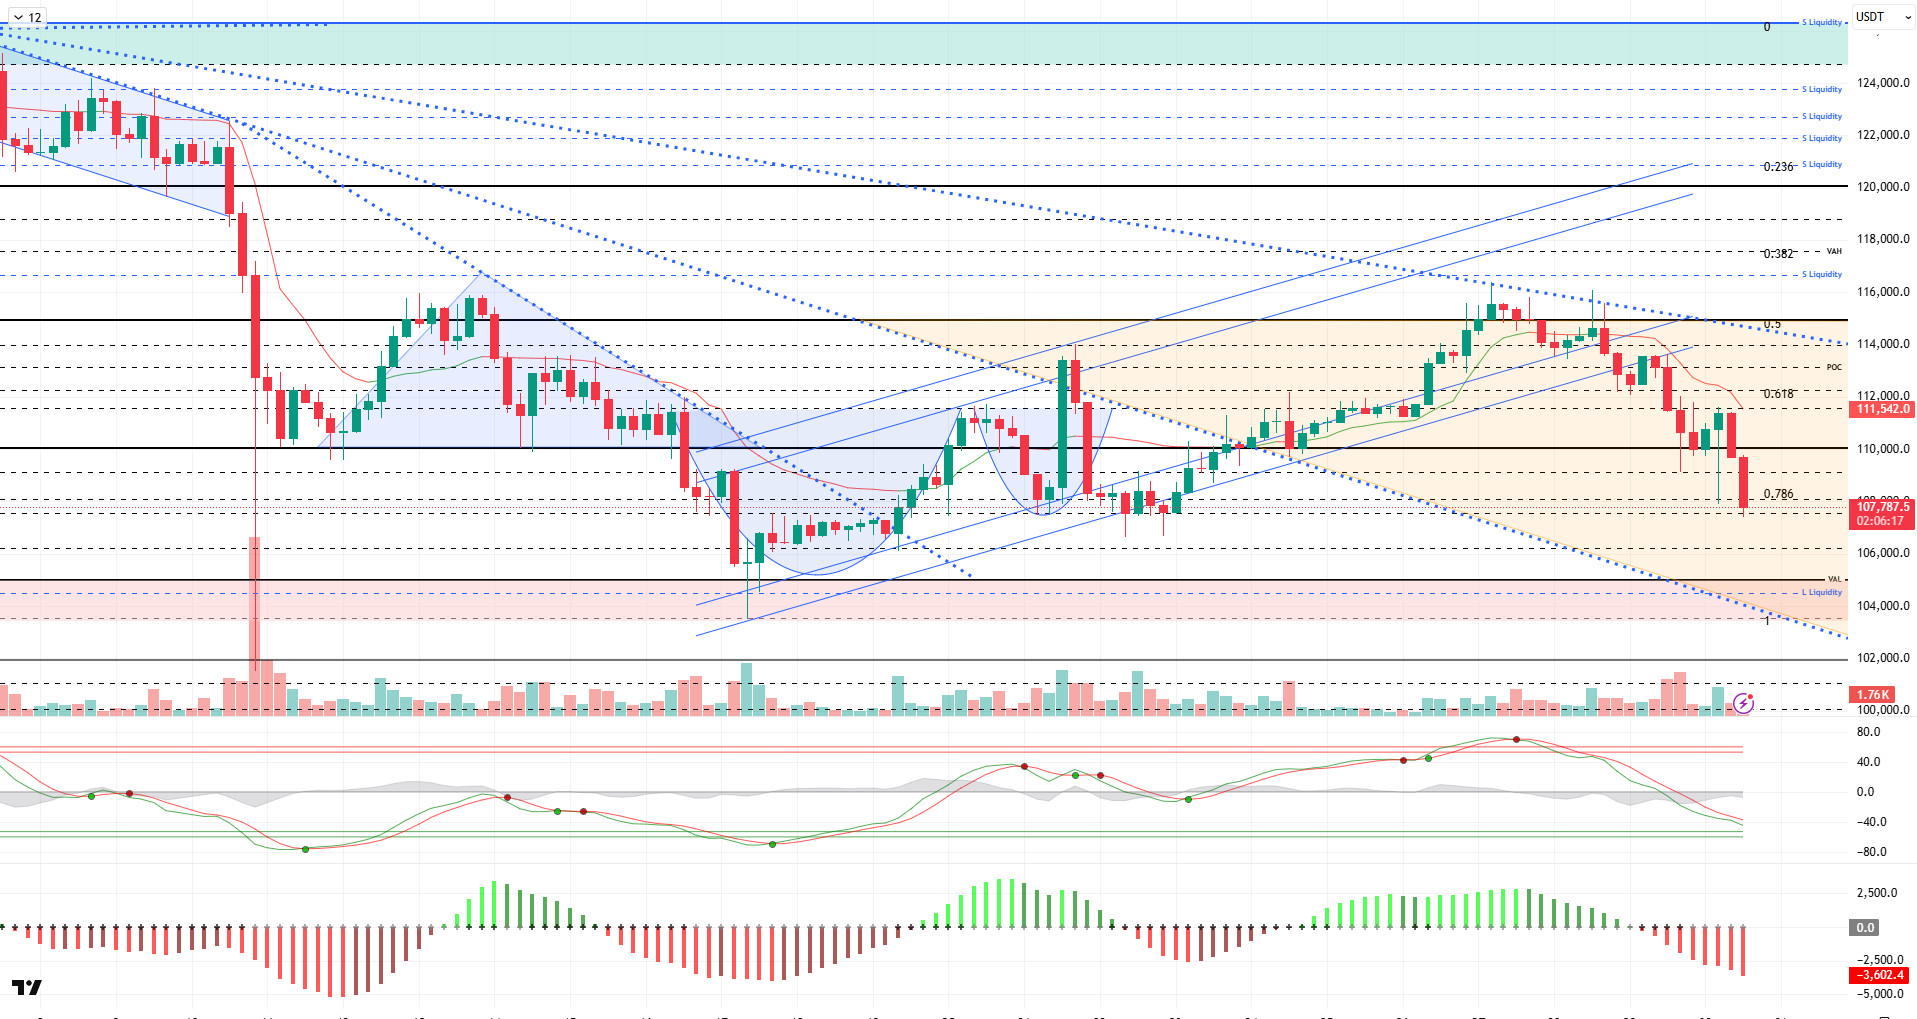
From a technical perspective, BTC continued to maintain its bearish outlook during the day, losing the 110,000 reference level. With deepening selling pressure, the price retreated to the 107,500 level and continues to test the critical support here.
Technical indicators show the Wave Trend (WT) oscillator entering the overbought zone just above the oversold zone, paralleling the sell signal it gave. The histogram on the Squeeze Momentum (SM) indicator continues to weaken within the negative zone. The Kaufman moving average (KAMA) is currently at $111,500, positioned above the price.
According to liquidation data, the buy level recorded fragmented density in the 108,000 – 111,000 band, with intense liquidation occurring at the 112,450 level, where accumulation increased. In contrast, the selling level is concentrated at $113,000 in the short term, while the broader time frame shows a dense liquidity zone at $116,400.
In summary, while the talks between the US and China took place in a constructive atmosphere on the fundamental side, Fed Chairman Powell’s uncertain stance on interest rate cuts next month emerged as a factor weighing on the markets. On the technical side, BTC lost its upward channel and moved into a horizontal band range, then lost the horizontal band range and formed a minor downtrend. In liquidity data, balanced transactions, along with the recent decline, brought the selling level to the fore. In the coming period, 107,500 will be monitored as a critical support point. If this level is lost and selling pressure deepens, we will monitor the 105,000 level, which is the last reference point for holding on to six-digit levels. To discuss a new upward movement, we will wait for the price to regain the 110,000 level.
Supports: 106,600 – 105,000 – 103,300
Resistances: 108,600 – 110,000 – 111,400
ETH/USDT
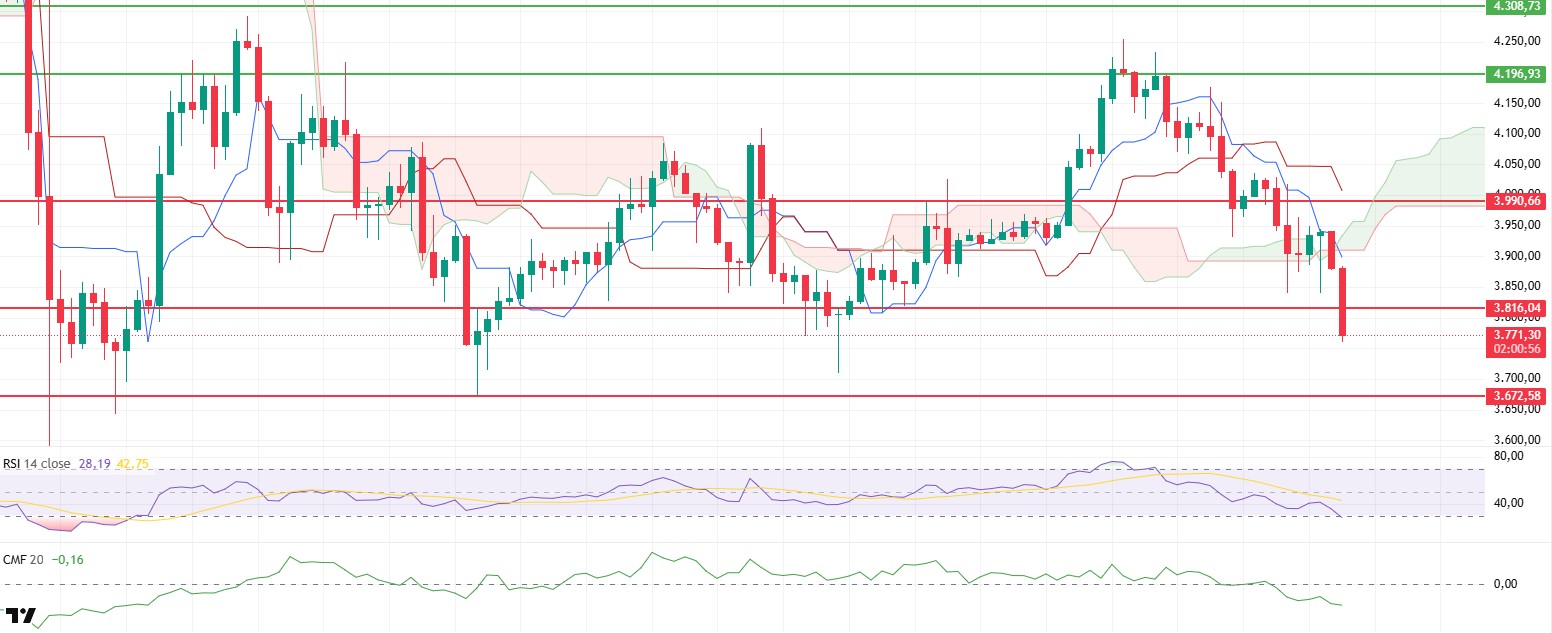
The Ethereum price faced strong selling pressure after failing to hold the critical support level mentioned in the morning analysis. Sales accelerated during the day with the break of the 3,928 dollar level kumo cloud intermediate support, and the price fell sharply to below the 3,800 dollar level. This movement indicates that the short-term technical structure has weakened and the market has entered a downward trend.
The RSI indicator has fallen to the oversold zone following this sharp pullback. The significant loss of momentum indicates that selling pressure has intensified and the market has entered the oversold zone. If the RSI remains in this zone, the downward trend is expected to continue for some time.
The CMF indicator also continues to decline in negative territory, indicating that liquidity outflows from the market are continuing. The dominance of sellers is limiting upward price reactions.
With the price falling below the Ichimoku cloud, the overall trend direction has now turned downward. This structure indicates that the downward movement may continue in the short term and that the market has not yet found equilibrium. As the medium-term positive structure breaks down, the market appears to be searching for a new equilibrium point.
The technical outlook is generally negative. If the price fails to regain the $3,816 level in the evening hours, the downward movement is expected to continue. In this case, there is a risk of the price retreating to the $3,672 level. On the other hand, if the price manages to stay above $3,816, a short-term recovery is possible, and the price may target the lower band of the kumo cloud at $3,912 again. Looking at the overall picture, selling pressure on Ethereum remains strong. However, due to entering the oversold zone, short-term rebound buying may be seen. Nevertheless, as the trend direction is downward, any rallies may remain limited for now.
Supports: 3,672 – 3,438 – 3,210
Resistances: 3,816 – 3,990 – 4,196
XRP/USDT
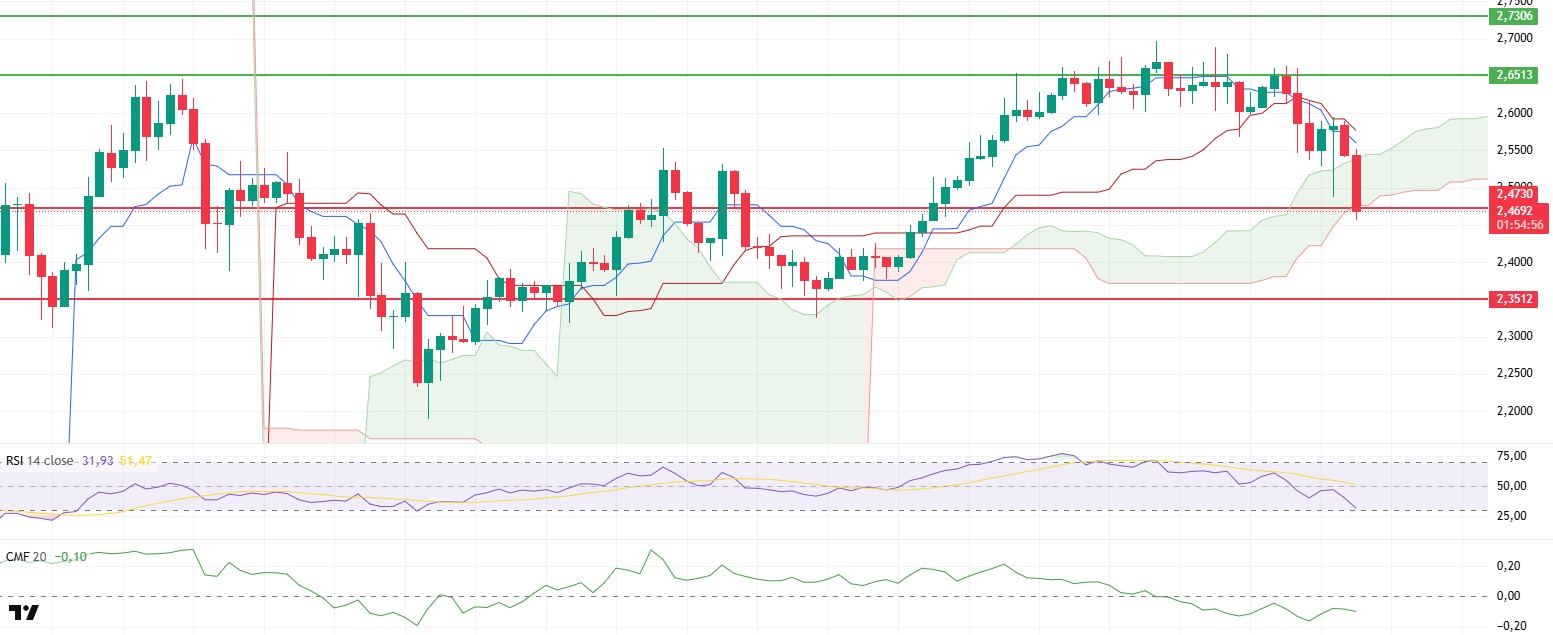
The XRP price failed to maintain the recovery potential indicated in the morning analysis and fell to the $2.47 support level in line with the general selling pressure experienced in the cryptocurrency markets during the day. The weak market outlook and investors’ cautious stance caused the price to head back to this critical support zone.
The RSI indicator continued its downward trend, falling to the oversold zone. The weakening momentum indicates that selling pressure has intensified and the market has entered the oversold zone. If the RSI remains in this zone, the downward trend is expected to continue for some time.
The CMF indicator continues its horizontal movement in the negative zone. This indicates that a significant influx of liquidity has not yet begun in the market and that buyers remain weak. This stagnation in volume may limit upward price reactions.
The price is attempting to hold onto the lower band of the Ichimoku cloud. If this level is broken downward, the likelihood of accelerated selling and the price retreating to deeper levels in the short term will increase. However, if there is a strong reaction from this area, the chance of a short-term recovery remains intact.
Technically, XRP is currently at a critical threshold. The $2.47 level is the main support, and price movement in this area will be decisive in determining the direction. Closings below the $2.47 level could increase selling pressure and trigger a pullback towards the $2.40 region. Conversely, if the price rebounds from this area, we could see a recovery movement towards the $2.65 level. Although the overall outlook remains weak in the short term, the fact that it has entered the oversold zone indicates that rebound buying could be effective in the coming sessions.
Supports: 2.3512 – 2.2100 – 2.0768
Resistances: 2.4730 – 2.6513 – 2.7306
SOL/USDT
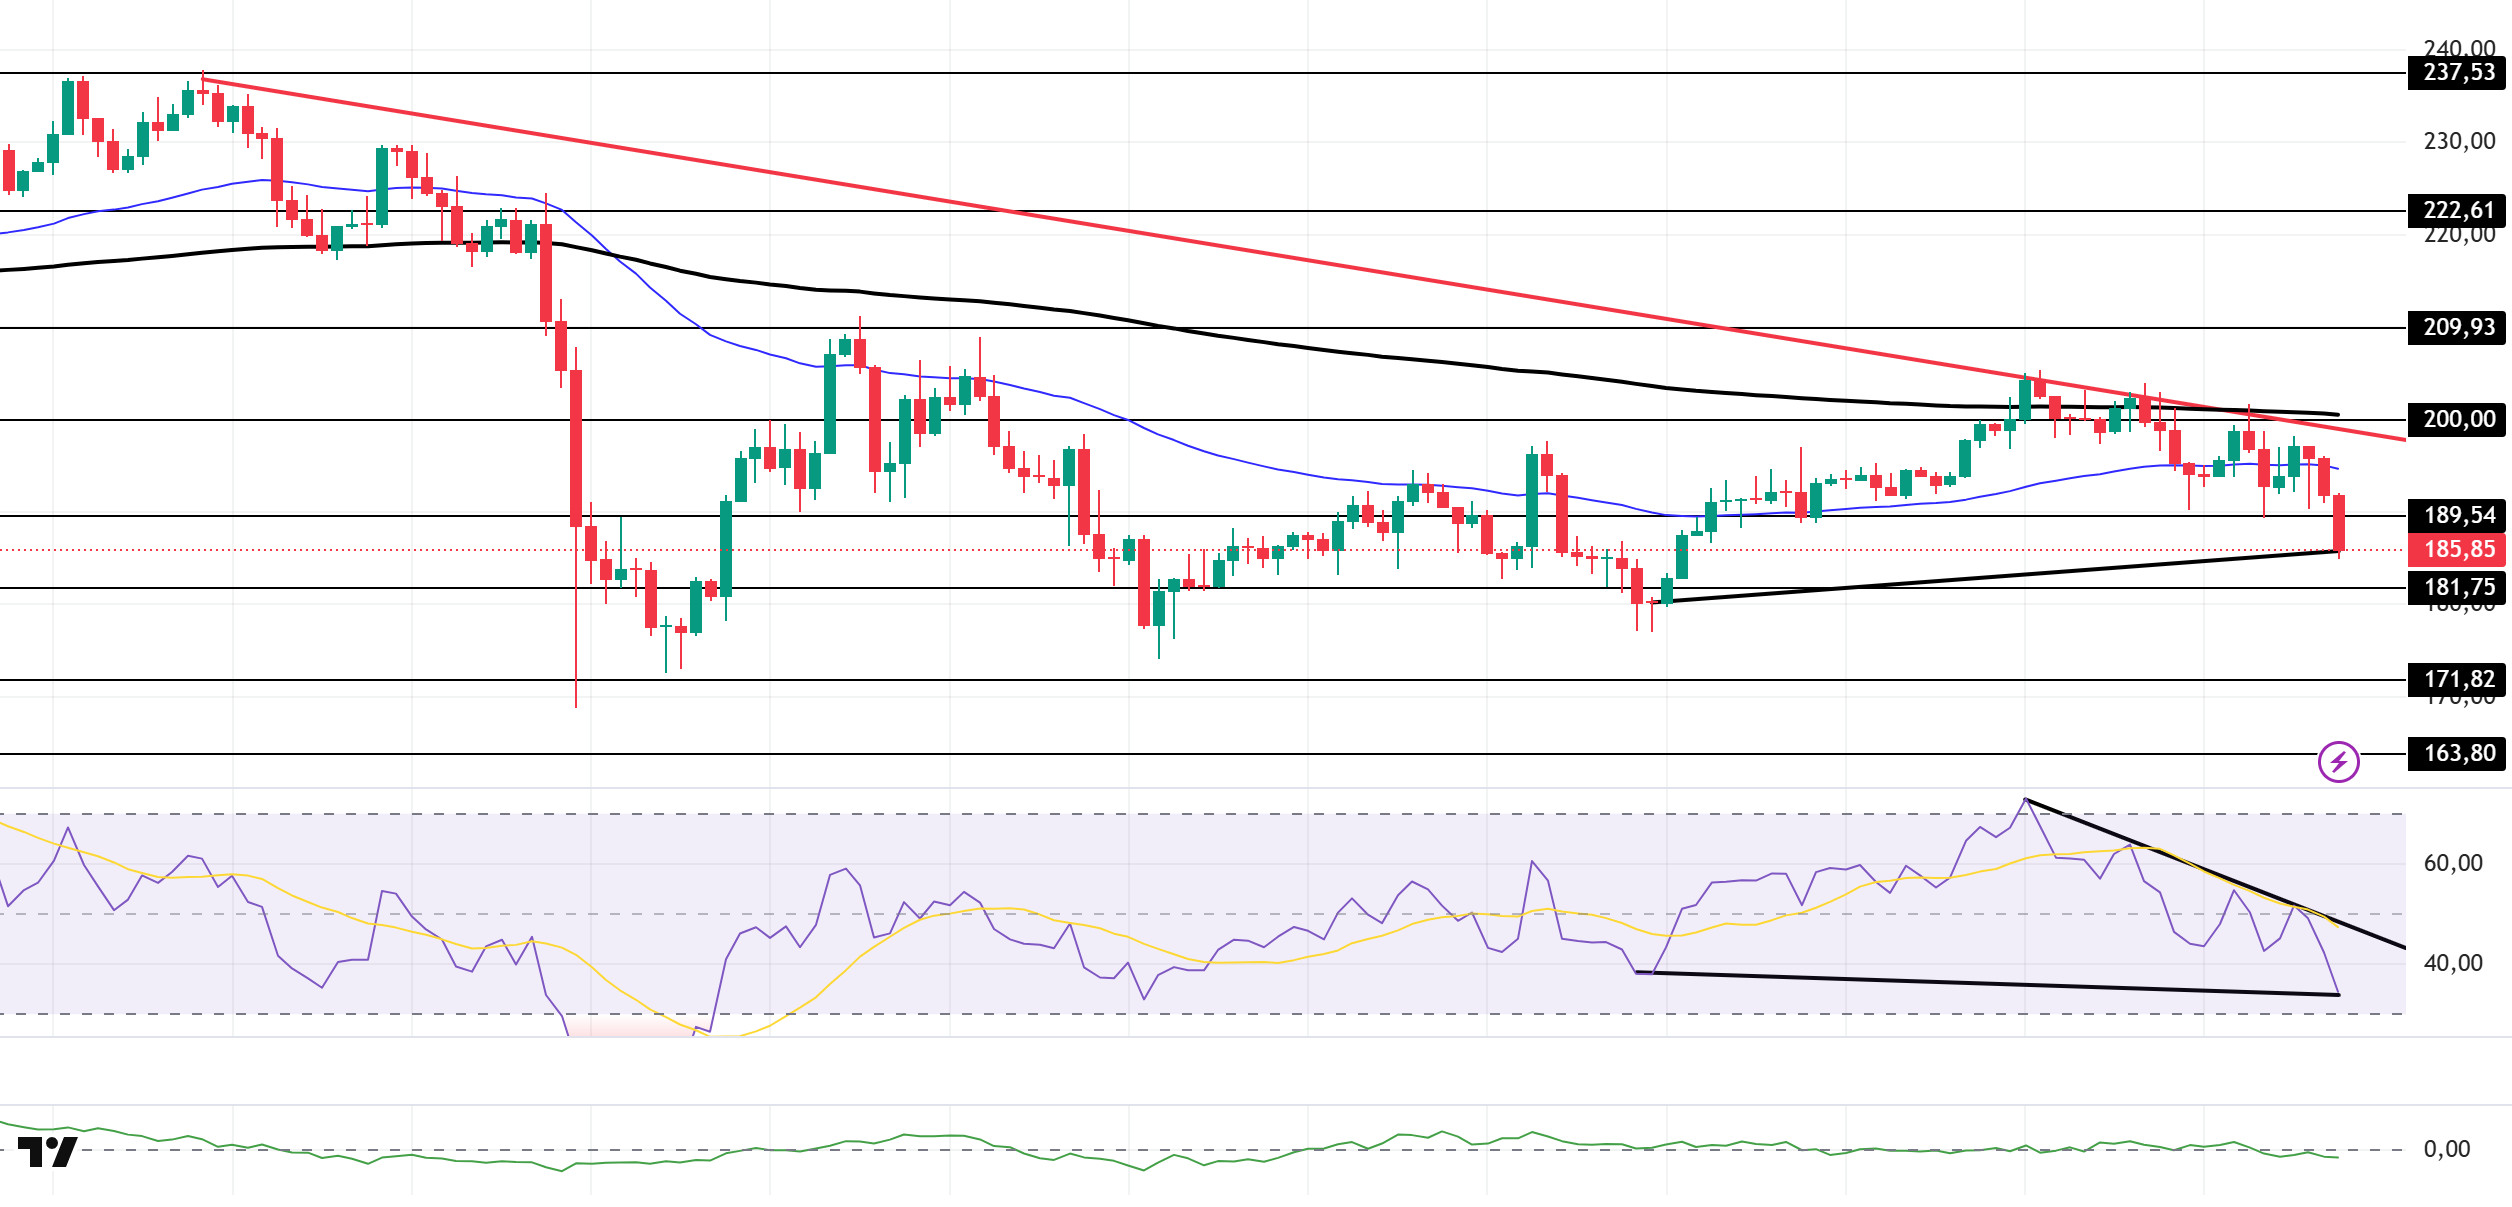
The SOL price experienced a pullback during the day. The asset tested the 200 EMA (Black Line) moving average and the downward trend that began on October 6 as resistance but failed to break through and experienced a pullback. The price, which is currently testing the strong support level of $189.54, may test the $181.75 level if the pullback continues. In the event of an uptrend, the 200 EMA moving average should be monitored.
On the 4-hour chart, it remained below the 50 EMA (Exponential Moving Average – Blue Line) and 200 EMA (Black Line). This indicates a possible downtrend in the medium term. At the same time, the price being below both moving averages shows us that the asset is in a downward trend in the short term. The Chaikin Money Flow (CMF-20) remained in the negative zone near the neutral level. However, the decrease in money inflows could push the CMF deeper into the negative zone. The Relative Strength Index (RSI-14) is in the negative zone. It also remained below the downward trend that began on October 27. This signaled increased selling pressure. On the other hand, there is a bullish divergence. This could bring upward movement. If there is an uptrend due to macroeconomic data or positive news related to the Solana ecosystem, the $209.93 level stands out as a strong resistance point. If this level is broken upward, the uptrend is expected to continue. If there are pullbacks due to developments in the opposite direction or profit-taking, the $181.75 level could be tested. If there is a decline to these support levels, an increase in buying momentum could present a potential upside opportunity.
Supports: 181.75 – 171.82 – 163.80
Resistances: 189.54 – 200.00 – 209.93
DOGE/USDT
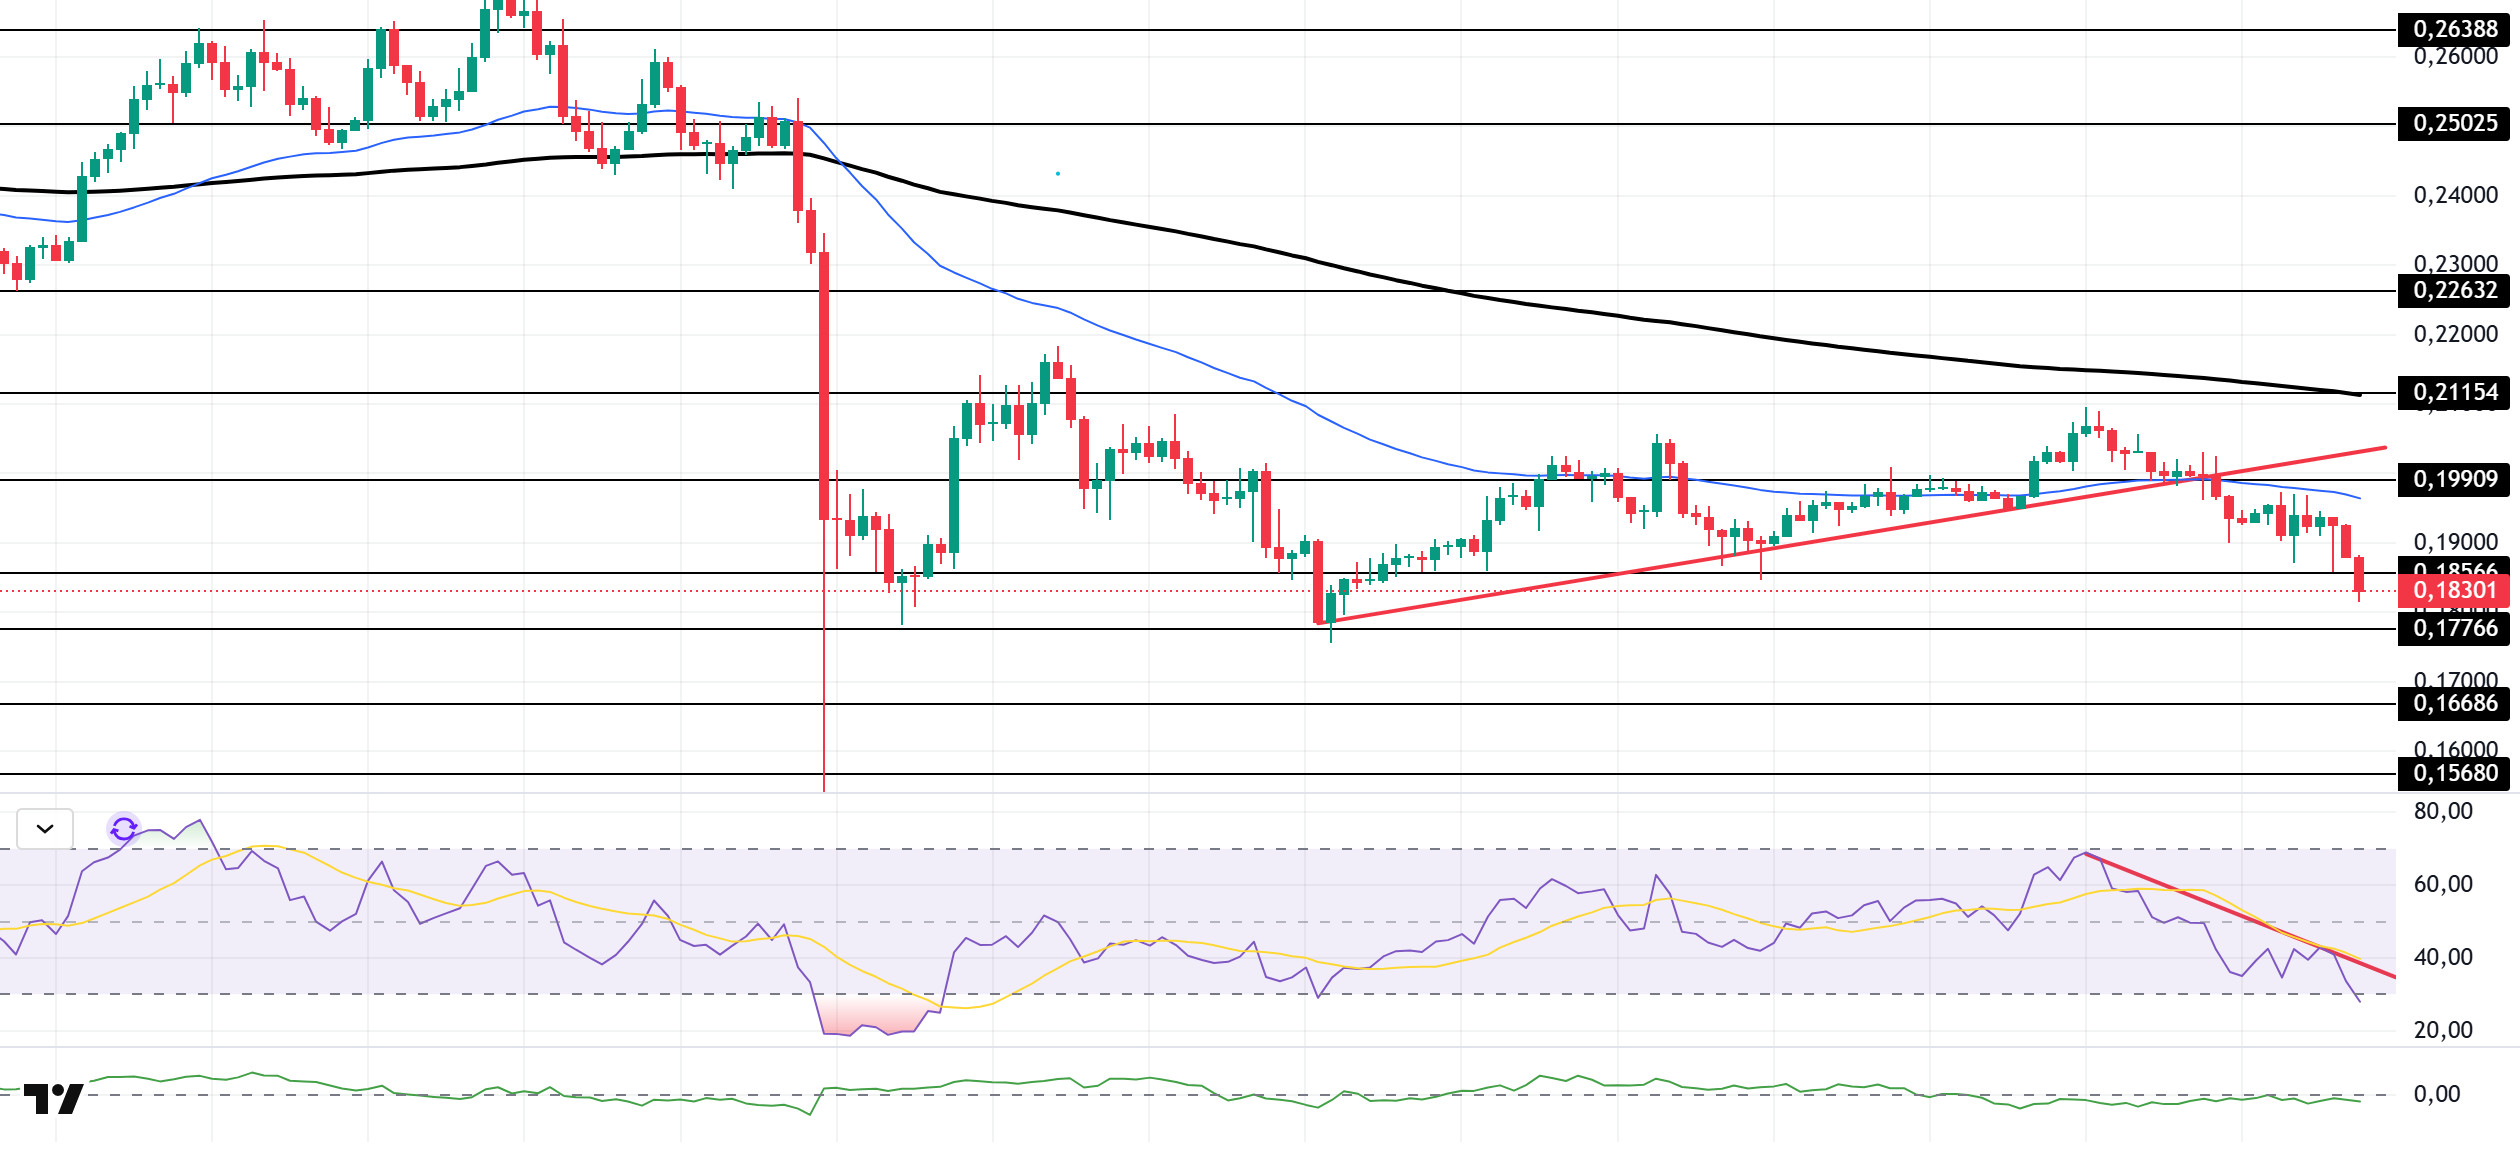
The DOGE price declined during the day. The asset remained in the lower region of the upward trend that began on October 17. This indicated increased downward pressure. Currently testing the strong support level of $0.18566, the asset could test the $0.17766 level if the pullback continues. If the uptrend begins, it could test the 50 EMA (Blue Line) moving average as resistance.
On the 4-hour chart, the 50 EMA (Exponential Moving Average – Blue Line) remained below the 200 EMA (Black Line). This indicates that a downtrend may begin in the medium term. The price being below both moving averages indicates a downward trend in the short term. The Chaikin Money Flow (CMF-20) also remained in negative territory. Additionally, a decrease in cash inflows could push the CMF deeper into negative territory. The Relative Strength Index (RSI-14) began trading below the downward trend that started on October 27. This could increase selling pressure. At the same time, its position in the oversold zone could bring a rise. In the event of a rise due to political developments, macroeconomic data, or positive news flow in the DOGE ecosystem, the $0.21154 level stands out as a strong resistance zone. Conversely, in the event of negative news flow, the $0.17766 level could be triggered. A decline to these levels could increase momentum and start a new wave of growth.
Supports: $0.17766 – $0.16686 – $0.15680
Resistances: 0.18566 – 0.19909 – 0.21154
LINK/USDT
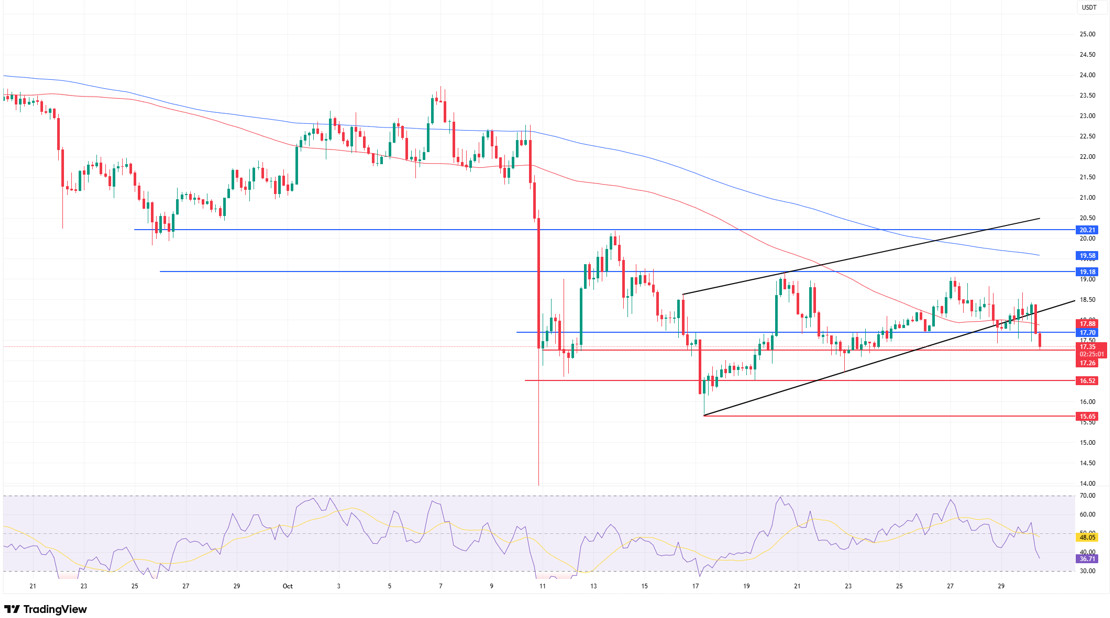
The price has fallen below the $17.70 support zone highlighted in our morning analysis, weakening the short-term positive structure. Indeed, we had noted that a 4-hour close below $17.70 could deepen the downward trend. Today’s price movement has confirmed this scenario. Currently, we see that the link has broken the lower band of the rising channel, losing an important level both technically and psychologically.
The price is currently attempting to hold around the $17.26 support level. If it remains below this region, the $16.52 and $15.95 levels will emerge as the next support zones. Specifically, a 4-hour close below $17.26 could increase selling pressure and cause the price to extend its downward breakout from the channel. We can expect the first reactionary move to come from the $16.52 region.
In potential upward recoveries, the first obstacle is the $17.70–$17.88 band. If this zone is breached, the $19.18 resistance could be targeted again. However, since this region is both the area where the channel broke and a critical threshold for a short-term trend reversal, upward movements may remain quite limited unless sustainability is achieved. Therefore, it is important to remember that the primary target in the current situation is downward.
The Relative Strength Index (RSI) has fallen to the 40 level, supporting the view that the market is experiencing weakening momentum in the short term. This value indicates that selling has begun to become somewhat excessive, but that a strong buyback signal has not yet formed. The RSI continuing to trade below the 50 level confirms that sellers are still dominant. The current outlook is moving towards the risk scenario we predicted in this morning’s analysis. While regaining $17.70 could create a positive recovery ground, as long as it remains below this level, the downtrend is likely to continue towards the $16.52–15.95 range.
Supports: $17.26 – $16.53 – $15.65
Resistances: 17.70 – 19.18 – 20.21
Legal Notice
The investment information, comments, and recommendations contained herein do not constitute investment advice. Investment advisory services are provided individually by authorized institutions taking into account the risk and return preferences of individuals. The comments and recommendations contained herein are of a general nature. These recommendations may not be suitable for your financial situation and risk and return preferences. Therefore, making an investment decision based solely on the information contained herein may not produce results in line with your expectations.


