
Technical Analysis
BTC/USDT
The US Congress mandated the Treasury Department to prepare a strategic reserve plan for Bitcoin with the HR 5166 bill. According to CoinShares data, digital asset investment products saw outflows of $352 million last week, while Bitcoin recorded inflows of $524 million. Bitcoin spot ETFs saw inflows of $368 million on the last trading day. Nasdaq announced that it is seeking approval for blockchain-based securities transactions by applying to the SEC for tokenization of stocks.
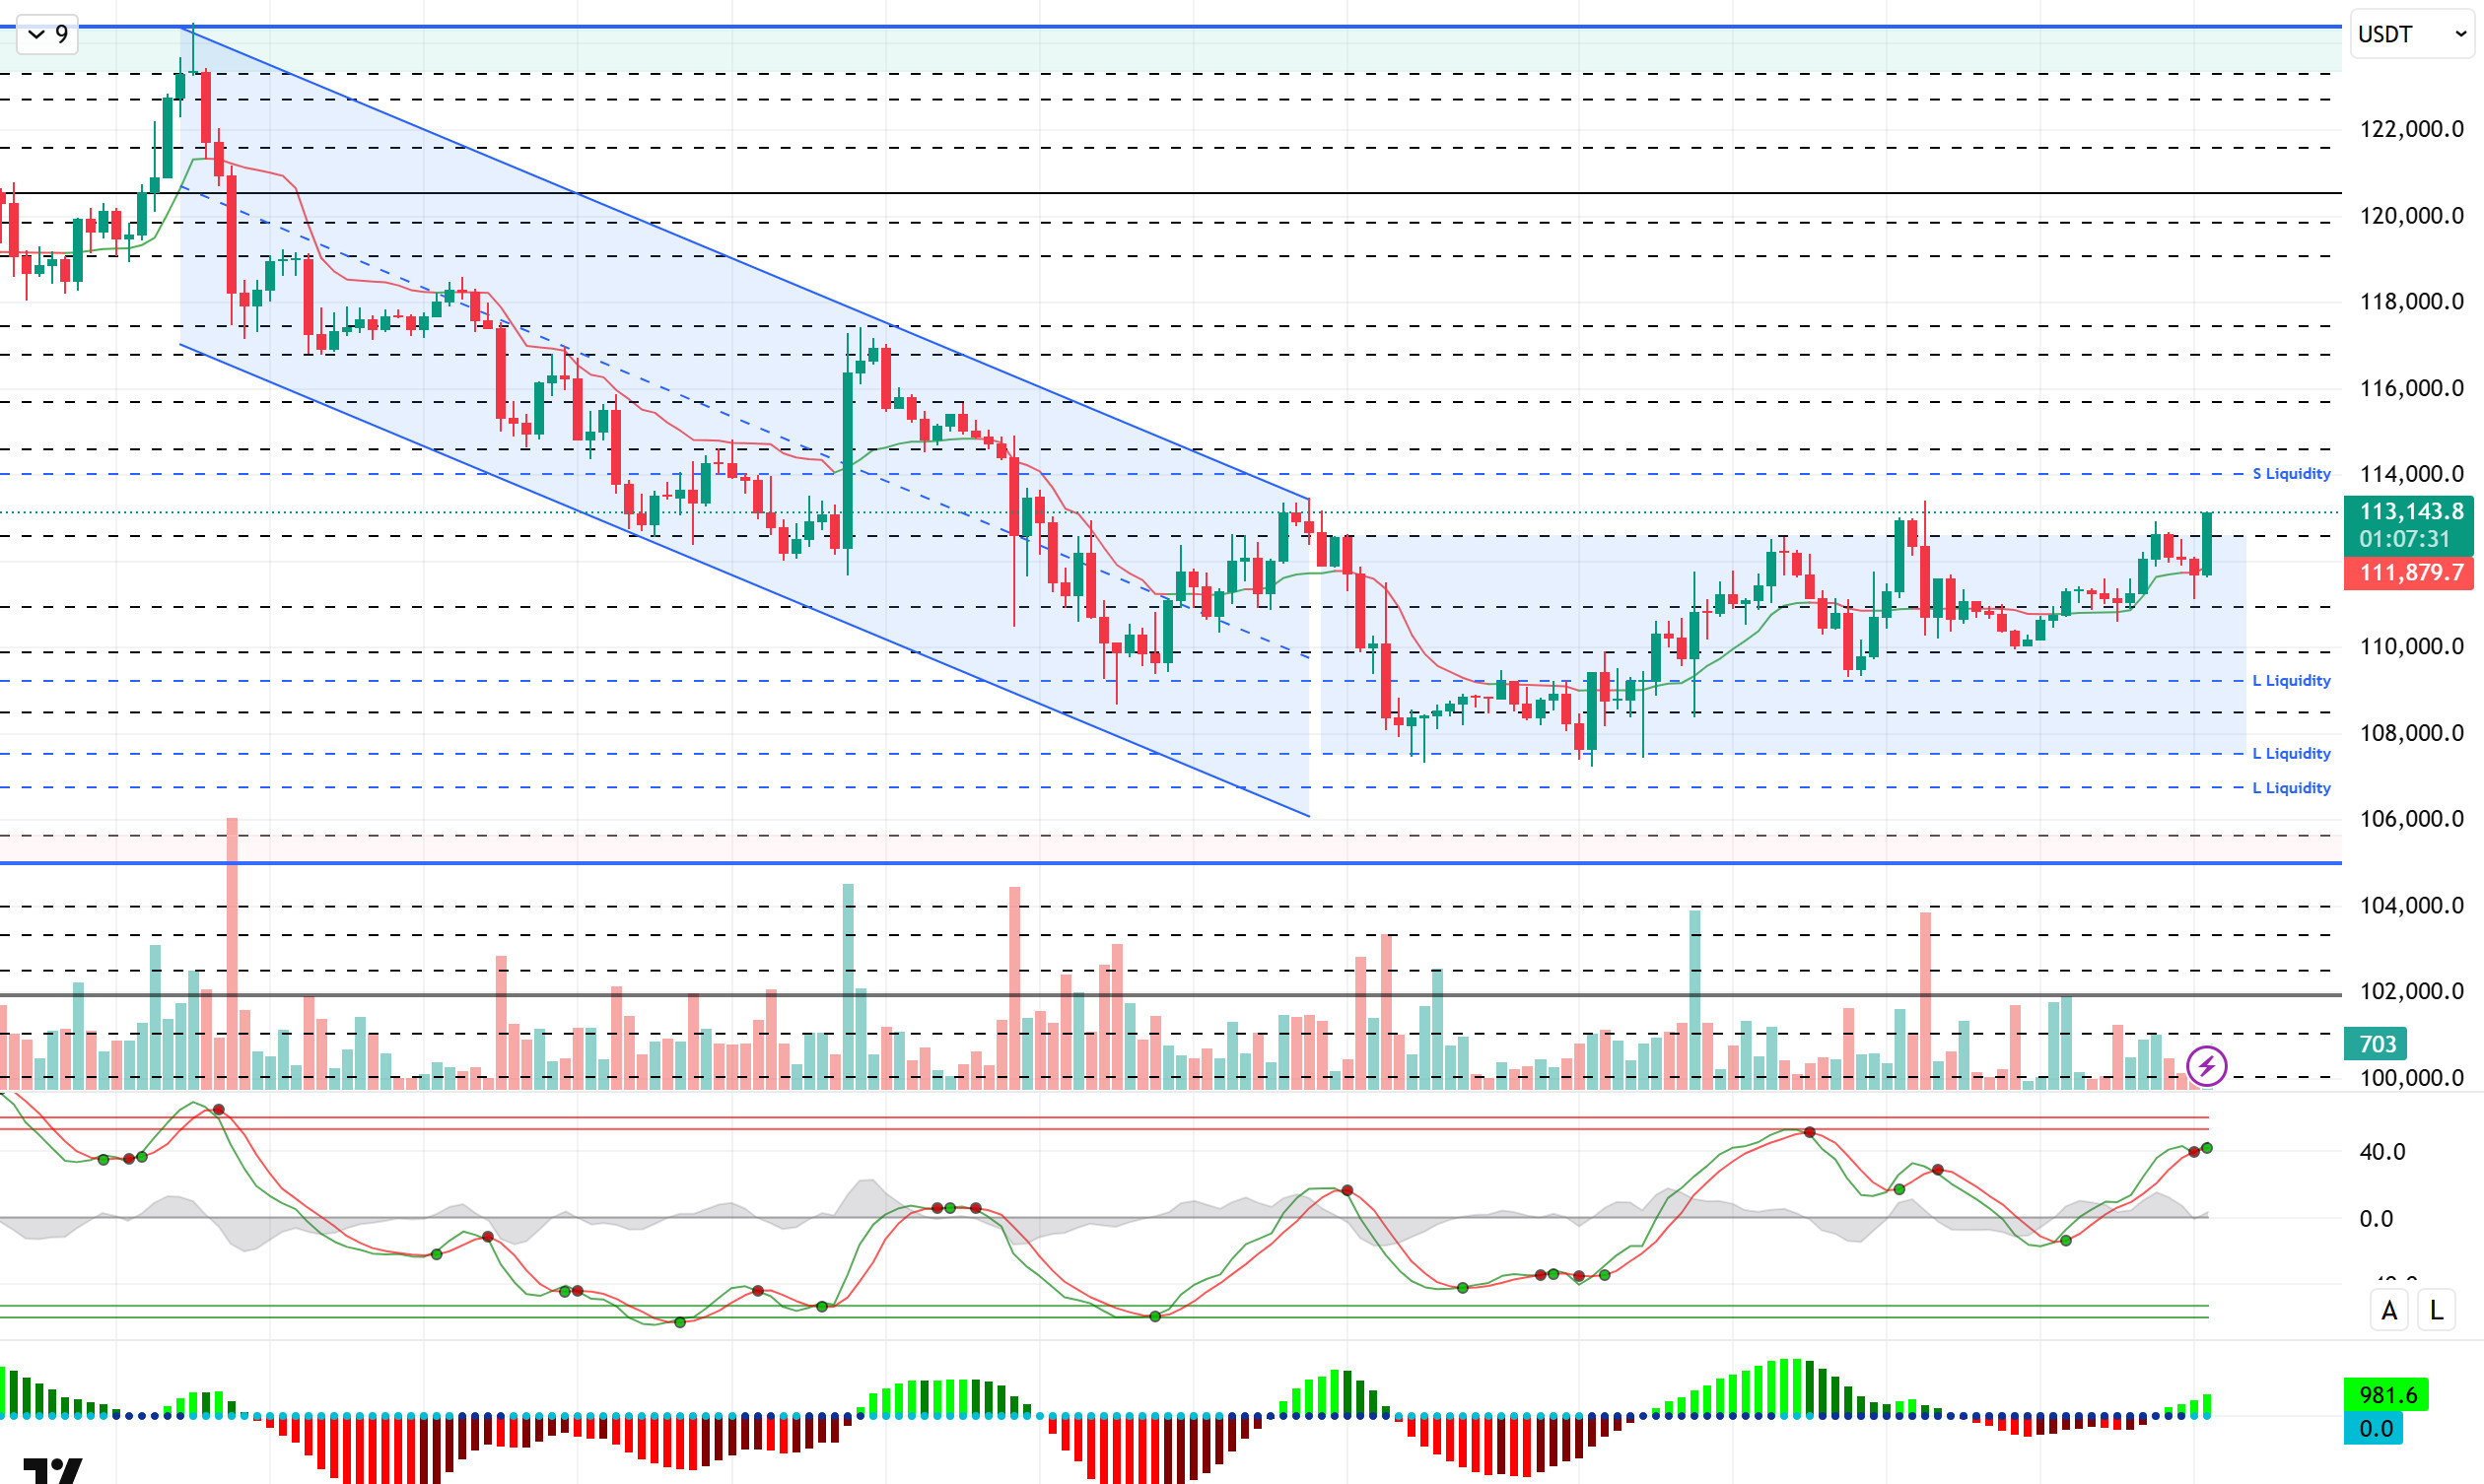
When we look at the technical outlook, BTC pricing continues within the horizontal band range. In the previous analysis, the price, which pushed the 112,600 level, fell to 111,000 after facing sales pressure. At the time of writing, BTC, which has regained momentum, continues to trade at 112,600.
Technical indicators are indecisive with the Wave Trend oscillator (WT) showing trading signals in the overbough area, while the histogram of the Squeeze Momentum (SM) indicator is trying to regain momentum in the positive area. The Kaufman moving average is currently moving below the price at 111,800.
Looking at the liquidity data, short-term accumulating sell trades started to reappear at 113.200, while the wider timeframe sell accumulation intensified above 114.000 and became the target zone. On the other hand, the buying tier started to accumulate at 110,000 – 110,900 levels in the short term, while the 109,000 band became a more intense accumulation zone in the long term.
To summarize, the loss of the optimistic mood in recent days with fundamental developments, interest rate cut discussions among Fed members, tariffs remaining on the agenda with the new distribution of duties and political tensions stand out as factors that put pressure on the price. In technical terms, the formation of a favorable ground for a new upward movement created some recovery. While it was noteworthy that the rises remained in the form of liquidity purchases, it was noteworthy that the price movements turned from a falling trend movement into a horizontal trend channel. The reappearance of catalysts in the market for a new long-lasting uptrend may be possible by creating a driving force on the price. In this context, 112,600 stands out as a critical reference area in the continuation of the upward movement. Exceeding this level may cause the price to gain momentum and bring a movement towards the 114,000 liquidity level. In a possible selling pressure, the 108,500 level may meet us in case of a break of 110,000.
Supports 108,500 – 107,400 – 105,000
Resistances 112,600 – 114,000 – 115,000
ETH/USDT
According to CoinShares data, digital asset investment products saw outflows of $352 million last week, while Ethereum recorded outflows of $912 million. Onchain Lens reported that BitMine took 8,001 ETH ($34.41 million) from Galaxy Digital, while Ember reported that Longling Capital withdrew 5,000 ETH ($21.57 million) from a centralized exchange after depositing 5 million USDT. Ethereum spot ETFs saw outflows for the sixth consecutive day, with a total net outflow of $96.7 million on September 8.
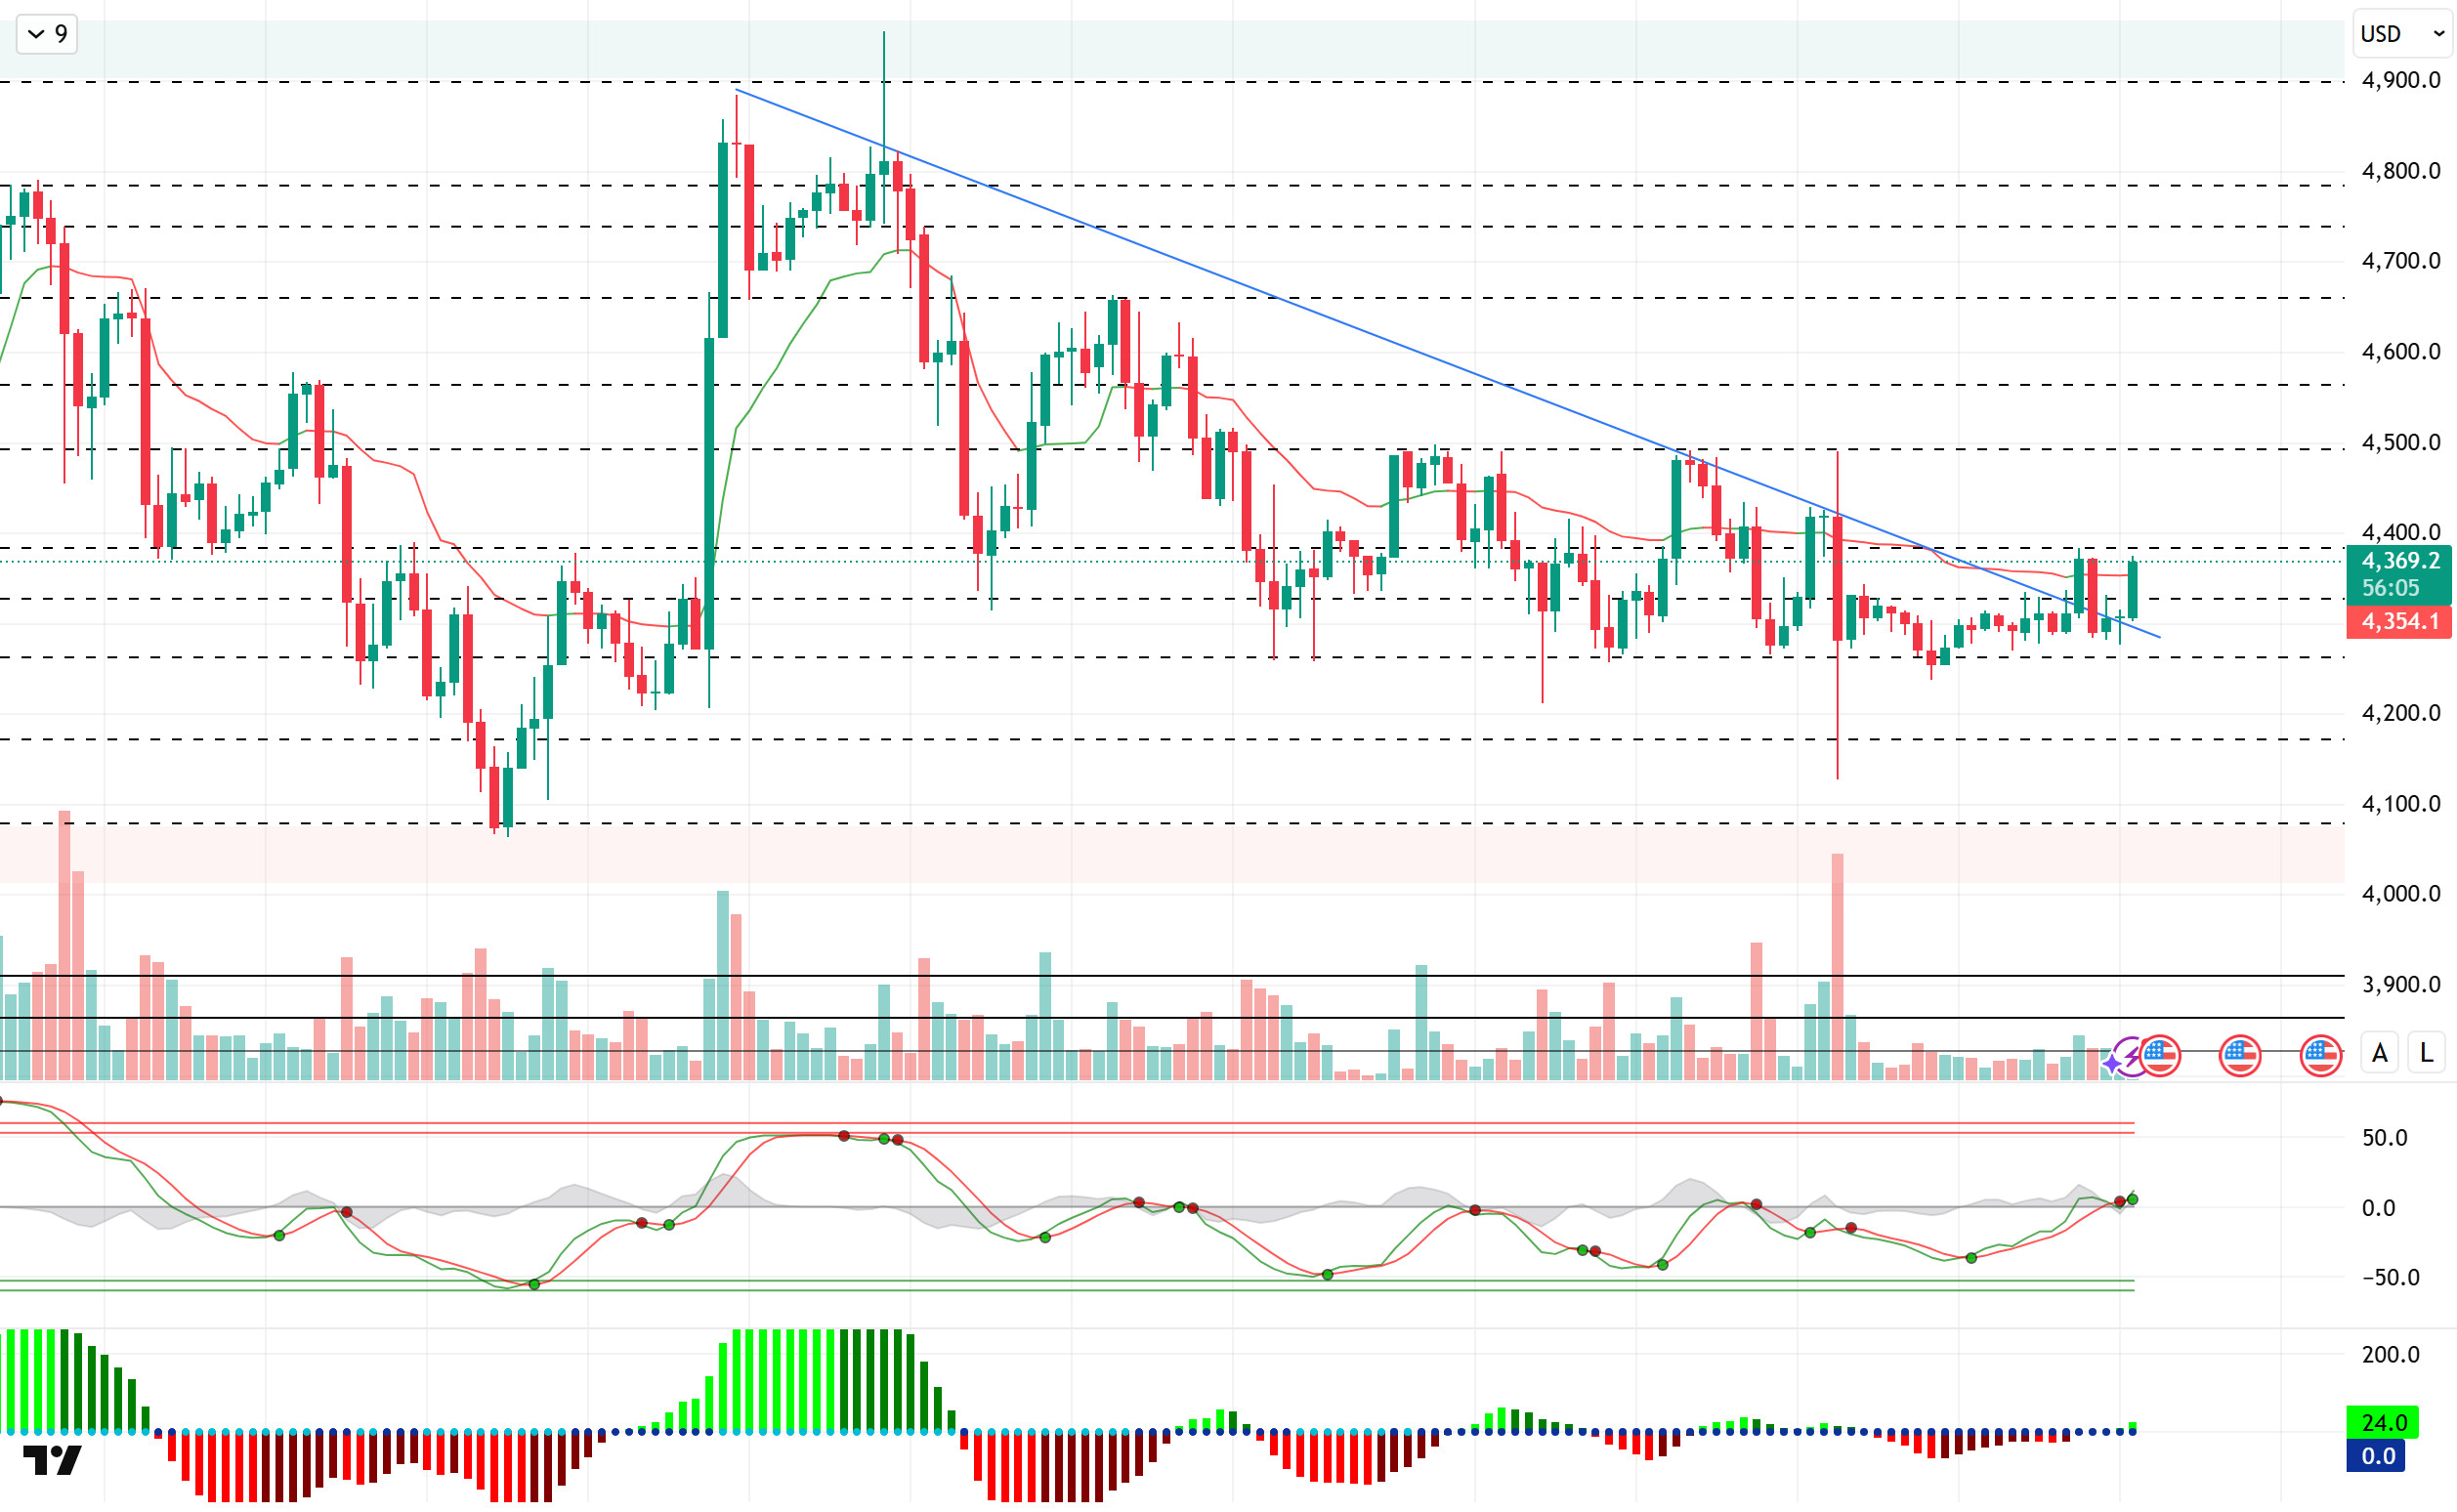
Looking at the technical outlook, the price, which exceeded the falling trend line in the previous analysis, tested 4,385 levels. Then, the price, which faced selling pressure, fell to 4,277 levels. At the time of writing, ETH, which has recovered again, continues to trade at 4,375 levels.
Technical indicators, the Wave Trend oscillator (WT) is once again turning upward with a buy signal at the mid-band of the channel, while the histogram of the Squeeze Momentum (SM) indicator is trying to regain momentum in the positive area. The Kaufman moving average is currently moving below the price at 4,350.
Looking at the liquidity data, the short-term sell accumulation was liquidated at 4.355, while the sell step was sparse. The buying tier continues to be concentrated at 4,200 and above on short and extended timeframes.
To summarize, ETH continues to move in line with the overall market developments. When we look at the fundamental dynamics specific to ETH, it is seen that institutional interest continues while ETF inflows are weakening. On the technical side, while the price’s recovery effort continues, liquidity data continues to determine the limits of price movements. In this context, closes above the falling trend line at 4,330 stand out as a critical threshold. The momentum that may occur above this level may move the price to the 4,490 resistance zone. On the other hand, 4,260 support and liquidity area will be followed in possible pullbacks. If this support is broken, the downtrend structure may deepen further.
Supports 4,260 – 4,170 – 4,080
Resistances 4,330 – 4,385 – 4,490
XRP/USDT
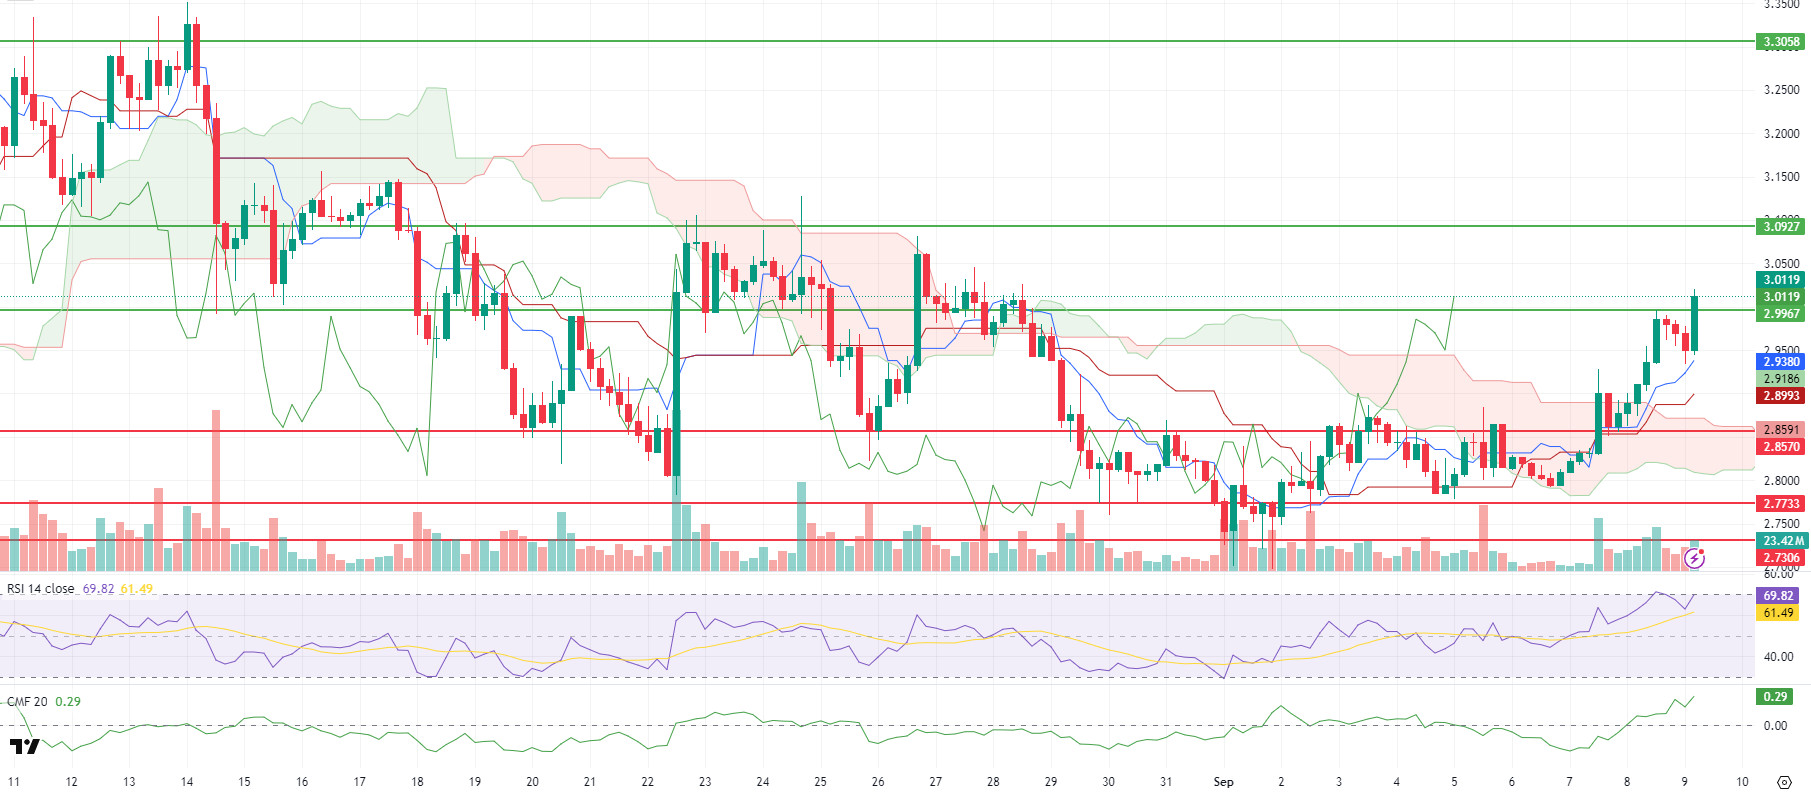
XRP started the new day with a rise after a 3.2% increase in value yesterday. XRP, which started the new day at $ 2,968, continues to trade above $ 3, up about 1.4%. On the 4-hour chart, according to XRP Ichimoku, the structure gives a bullish signal in the short term. In the decline it experienced with the sales after its rise, it started to rise again with the purchases coming at the Tenkan level. Although the outlook is positive, closures and persistence above the $ 2.9967 resistance are essential for the continuation of the rise. Otherwise, profit sales that may come from the Kumo edge may create a risk of retracement in the short term.
Relative Strength Index (RSI) settled in the positive zone with 70. Since the 70 threshold is an overbought area, profit realizations may be seen in this region. Chaikin Money Flow (CMF) continued to rise in positive territory at +0.29, indicating that liquidity inflows on the spot side are on the rise. This can be stated by XRP that the rise is supported by volume and the volumetric support for persistence above $ 3 is currently positive.
In the short term, the hold on the Kumo upper band continues successfully and XRP is retesting the $2.9967 resistance level with its rise today. Persistence above this level is important. Providing permanence above this level and then continuing the rise, rises towards $ 3.0927 and then $ 3.3058 may come to the agenda. On the other hand, if the XRP price falls below $ 2,941 with the possible selling pressure, the risk of correction towards Tenkan and Kijun levels may increase. Below this region, supports of $ 2,857 and $ 2,773 stand out. In general, although momentum and liquidity indicators have turned in favor of intraday, the persistence above $ 3.00 and keeping CMF in the positive zone will be decisive for the sustainability of the rise.
Supports: 2.8570 – 2.7733 – 2.7306
Resistances 2.9967 – 3.0927 – 3.3058
SOL/USDT
Swiss crypto platform SwissBorg suffered a $41.5 million SOL hack attack after its public API was compromised.
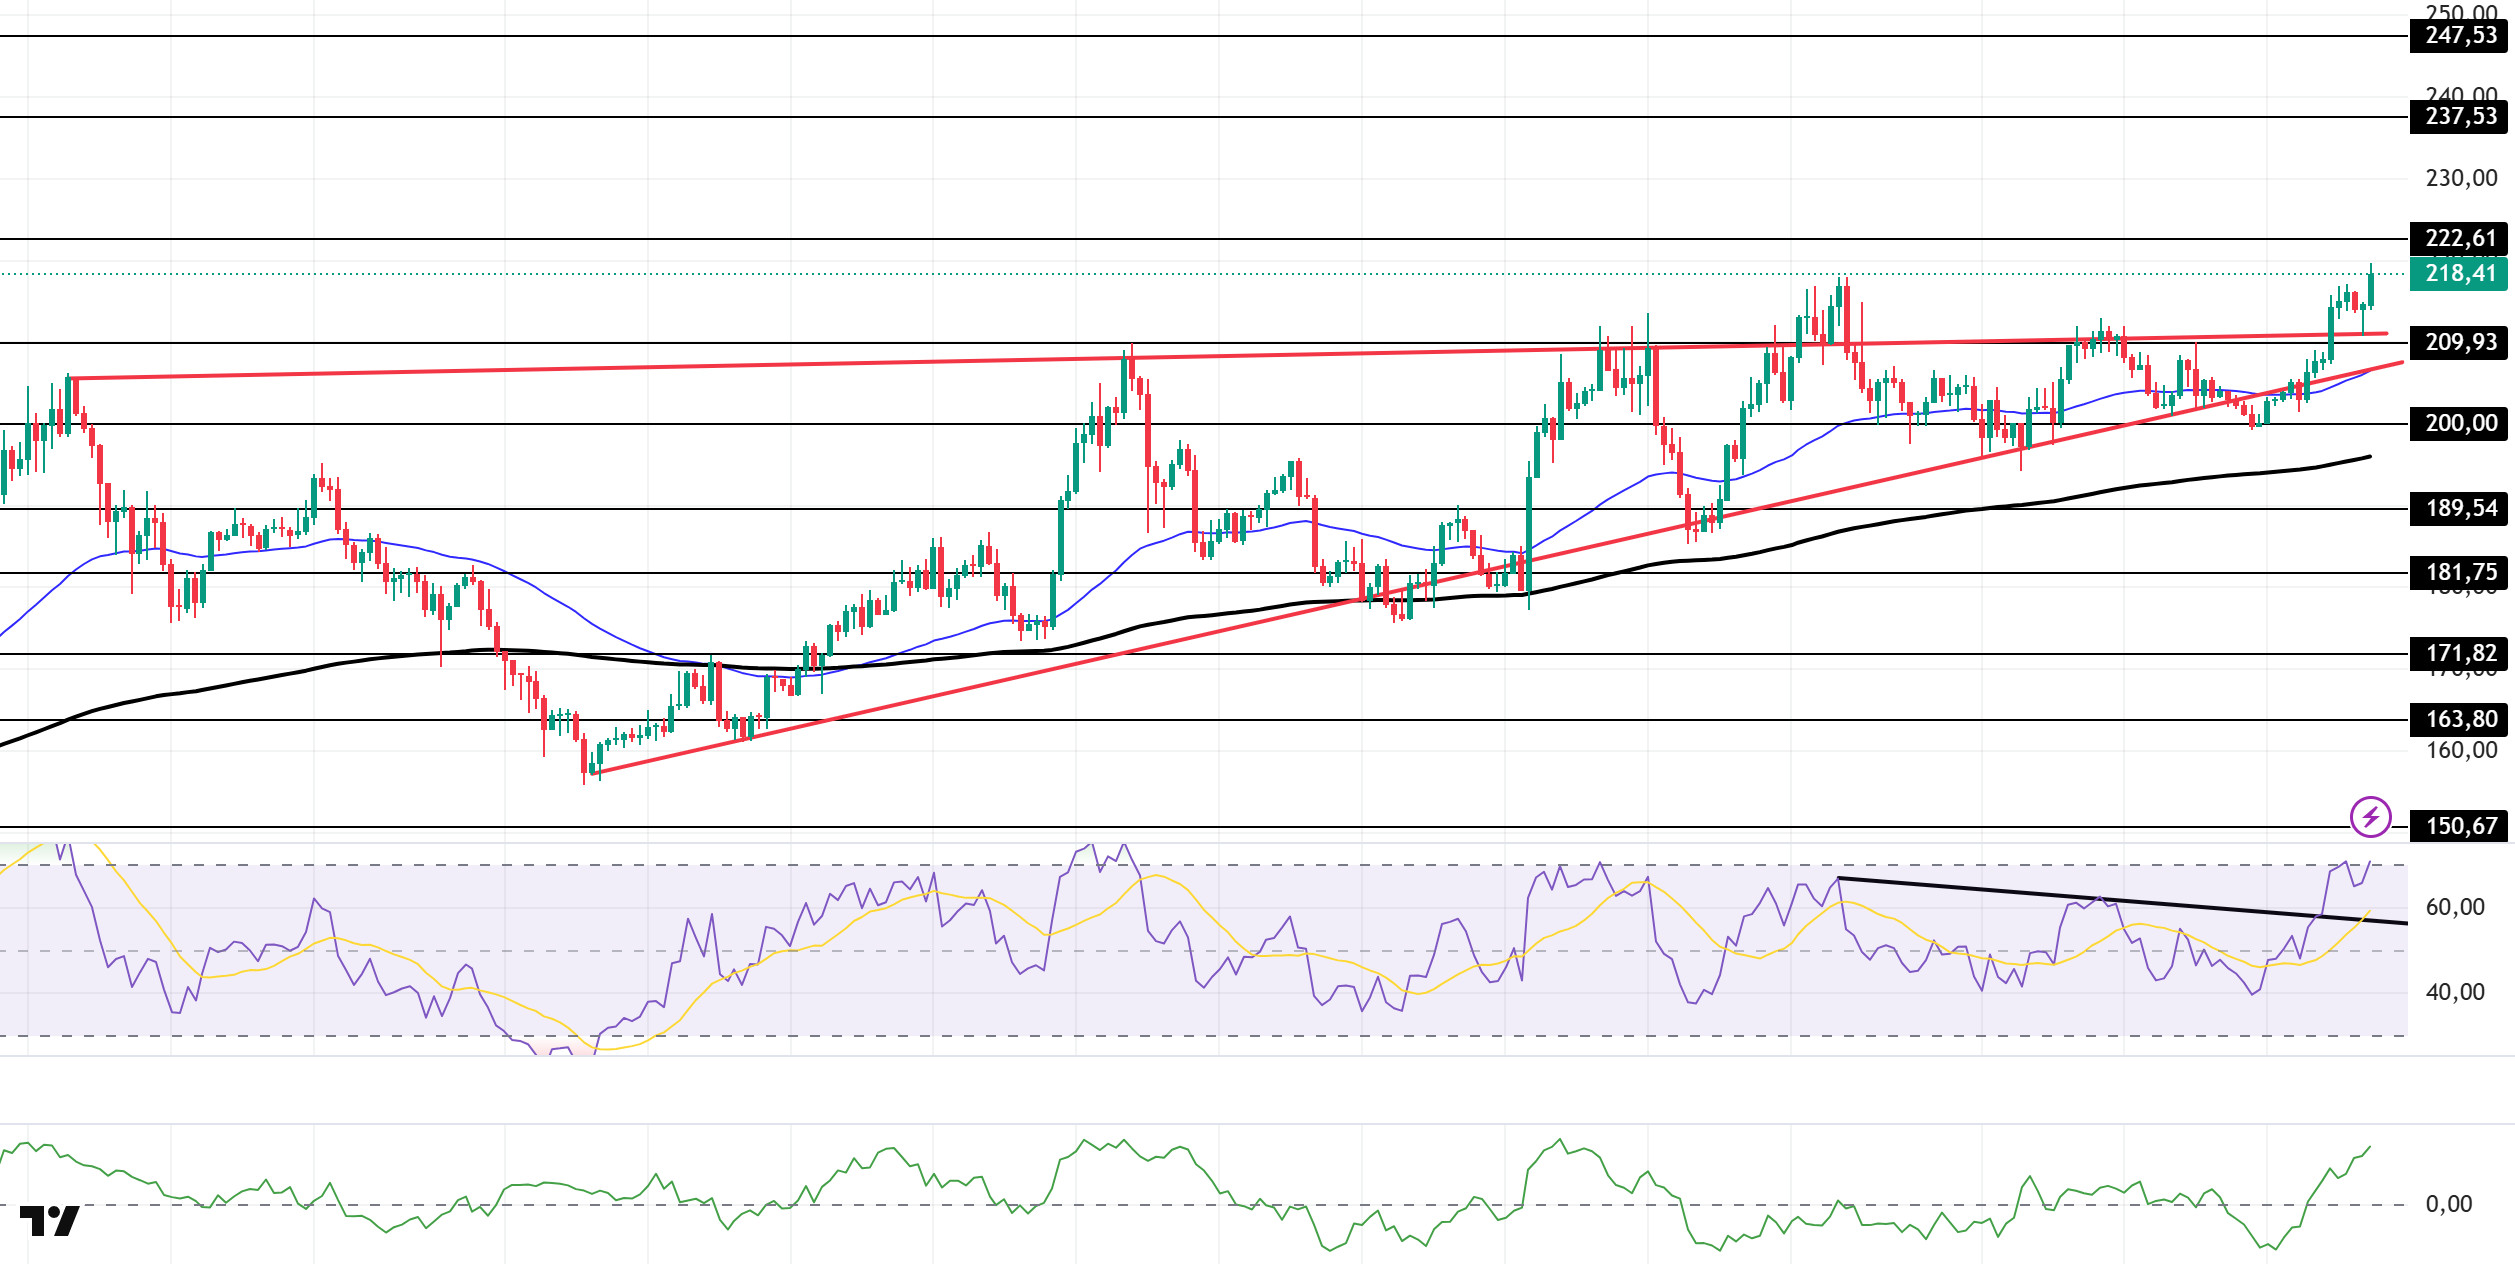
SOL price was flat. The asset broke the rising wedge pattern that started on August 2 to the upside and remained there. The price, which tested the ceiling level of the rising wedge pattern as support, saw support here and experienced a slight rise. In case of a continuation of the rise, the 222.61 dollar level can be followed as resistance. In retracements, the ceiling level of the pattern can work as support.
On the 4-hour chart, it continued to be above the 50 EMA (Exponential Moving Average – Blue Line) and the 200 EMA (Black Line). This suggests that the uptrend may continue in the medium term. At the same time, the fact that the price is above both moving averages suggests that the market is bullish in the short term. Chaikin Money Flow (CMF-20) continued to be in positive territory. However, an increase in inflows may keep CMF above the positive zone. Relative Strength Index (RSI-14) continued to be in positive territory. It also broke the ceiling of the downtrend that started on August 29 to the upside. This could exacerbate the upside. However, being in the overbought zone brought profit selling and caused a pullback. The $222.61 level stands out as a strong resistance point in the event of a rally on the back of macroeconomic data or positive news on the Solana ecosystem. If this level is broken upwards, the rise can be expected to continue. If there are pullbacks due to contrary developments or profit realizations, the $ 200.00 level can be tested. In case of a decline to these support levels, the increase in buying momentum may offer a potential bullish opportunity.
Supports 209.93 – 200.00 – 189.54
Resistances 222.61 – 237.53 – 247.53
DOGE/USDT
CleanCore bought 285.42 million Dogecoins and set a target of 1 billion DOGE in 30 days.
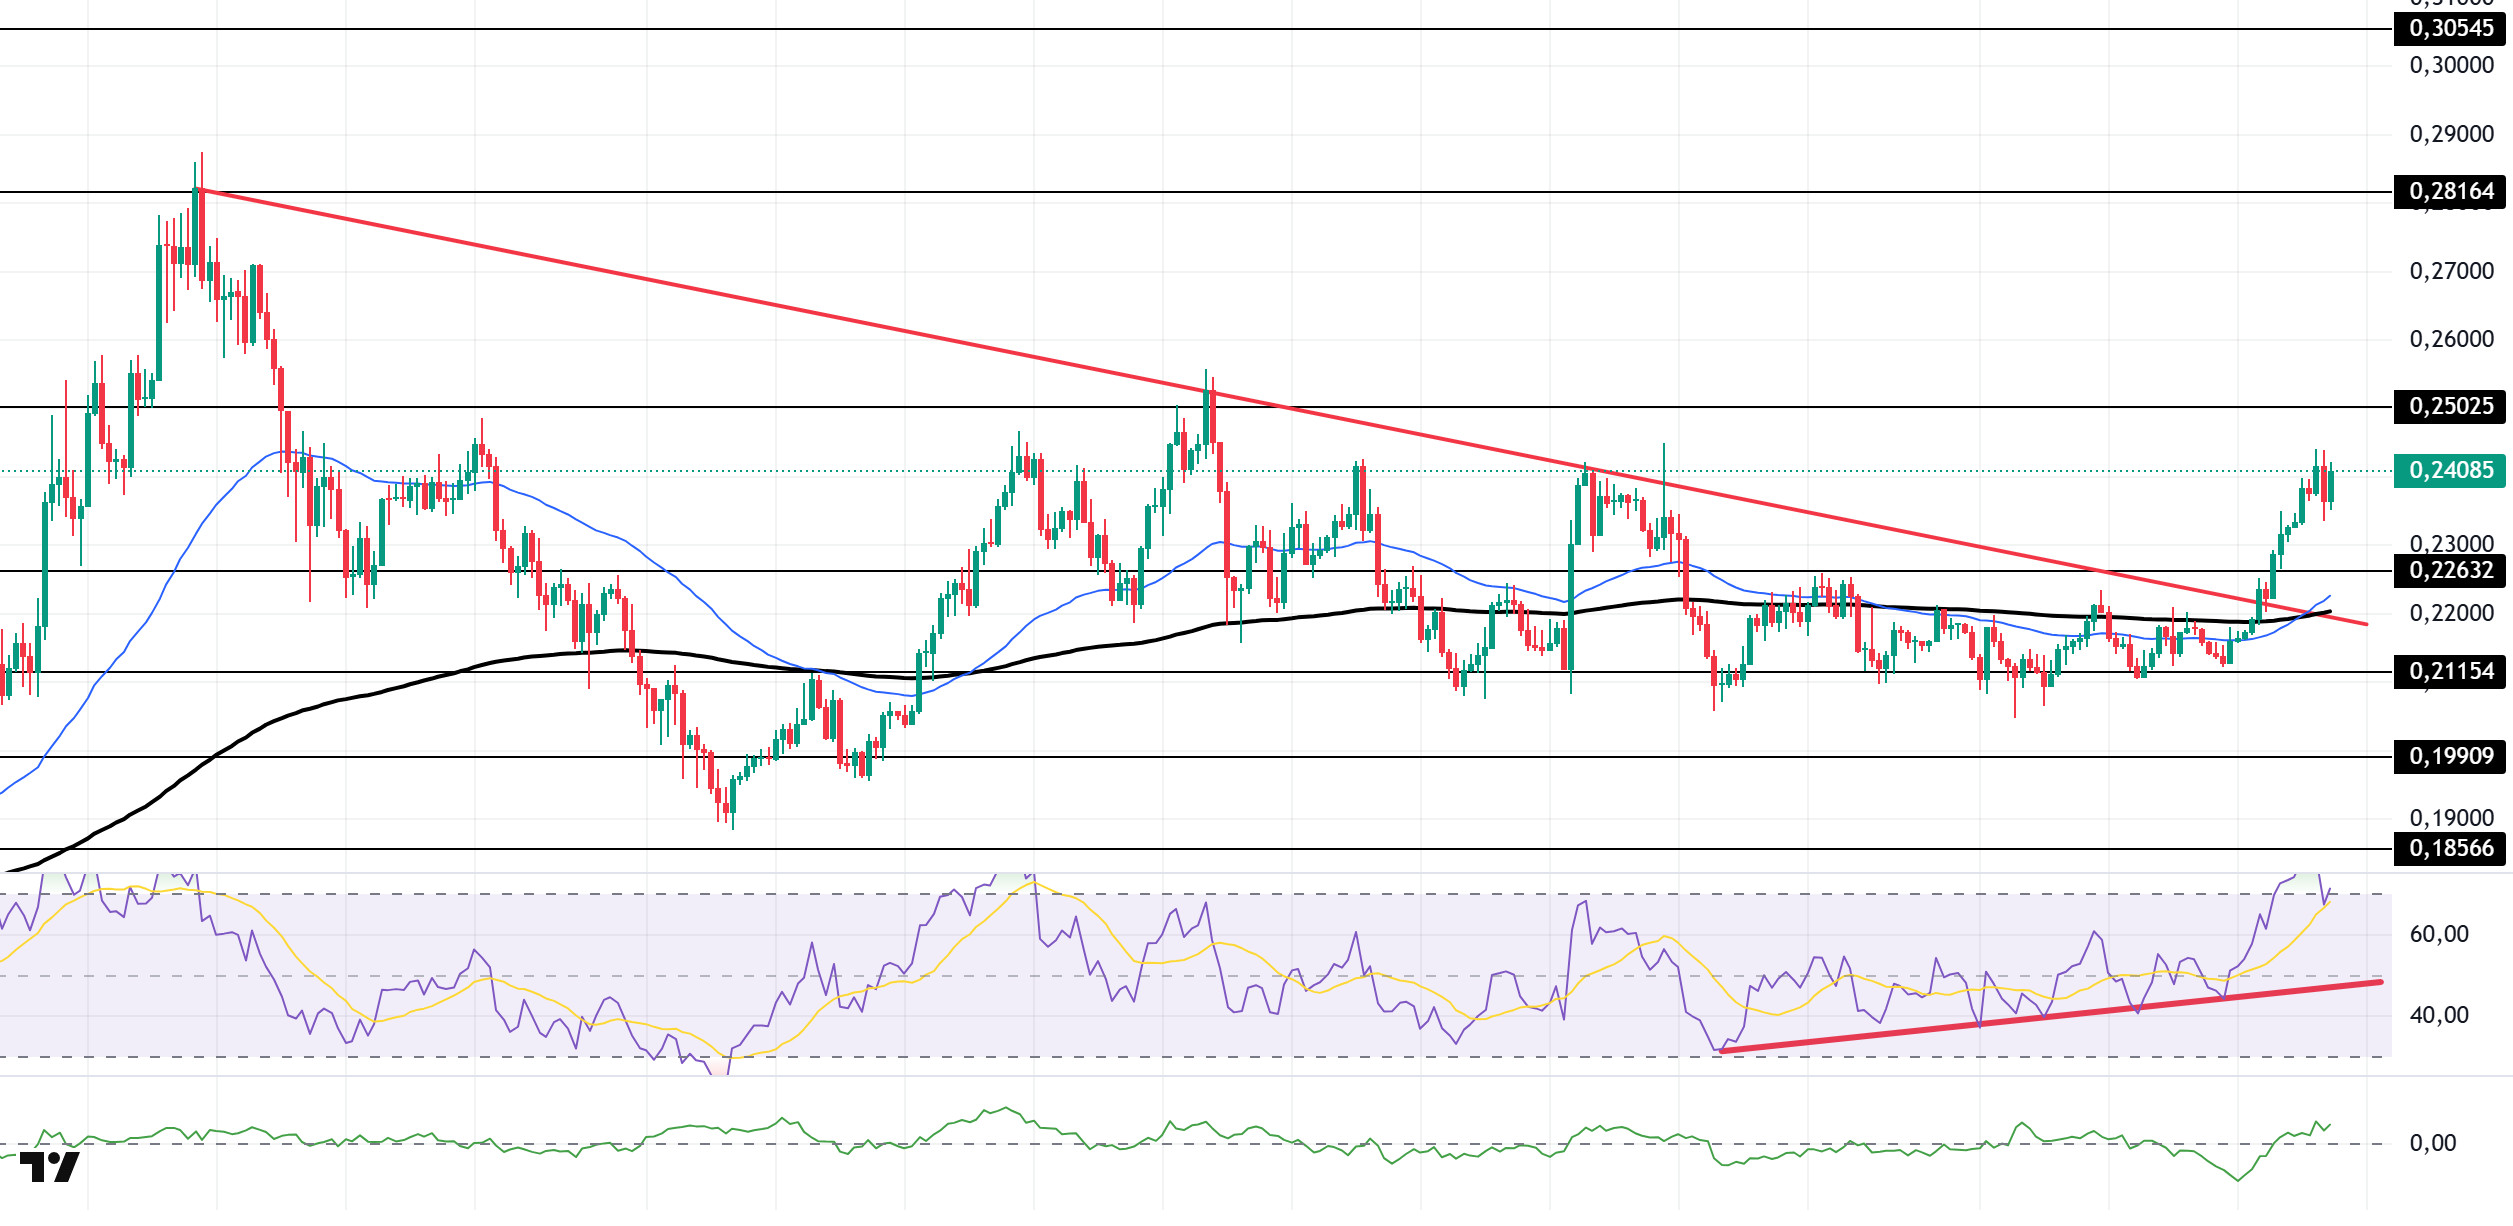
DOGE price was flat. The asset broke the downtrend that started on July 21 with a strong candle and continues to hold above it. The price, which is above the 50 EMA (Exponential Moving Average – Blue Line) and 200 EMA (Black Line) moving averages, should follow the $0.25025 level if it maintains its momentum and continues to rise. In case of a possible pullback, the $0.22632 level may be triggered.
On the 4-hour chart, the 50 EMA (Blue Line) broke the 200 EMA (Black Line) to the upside. This signals the start of a bullish trend in the medium term. The fact that the price is above both moving averages indicates that the uptrend is strong in the short term. Chaikin Money Flow (CMF-20) continues to be in positive territory. In addition, a decrease in inflows may move CMF into negative territory. Relative Strength Index (RSI-14) retreated slightly from its level in the overbought zone. This indicates that profit selling is taking place. At the same time, it continues to be in the upper zone of the uptrend that started on August 26. This signaled that momentum may continue. The $0.25025 level stands out as a strong resistance zone in the rises that may be experienced in line with political developments, macroeconomic data or positive news flow in the DOGE ecosystem. In the opposite case or possible negative news flow, the $0.22632 level may be triggered. In case of a decline to these levels, the momentum may increase and a new bullish wave may start.
Supports 0.22632 – 0.21154 – 0.19909
Resistances 0.25025 – 0.28164 – 0.30545
AVAX/USDT
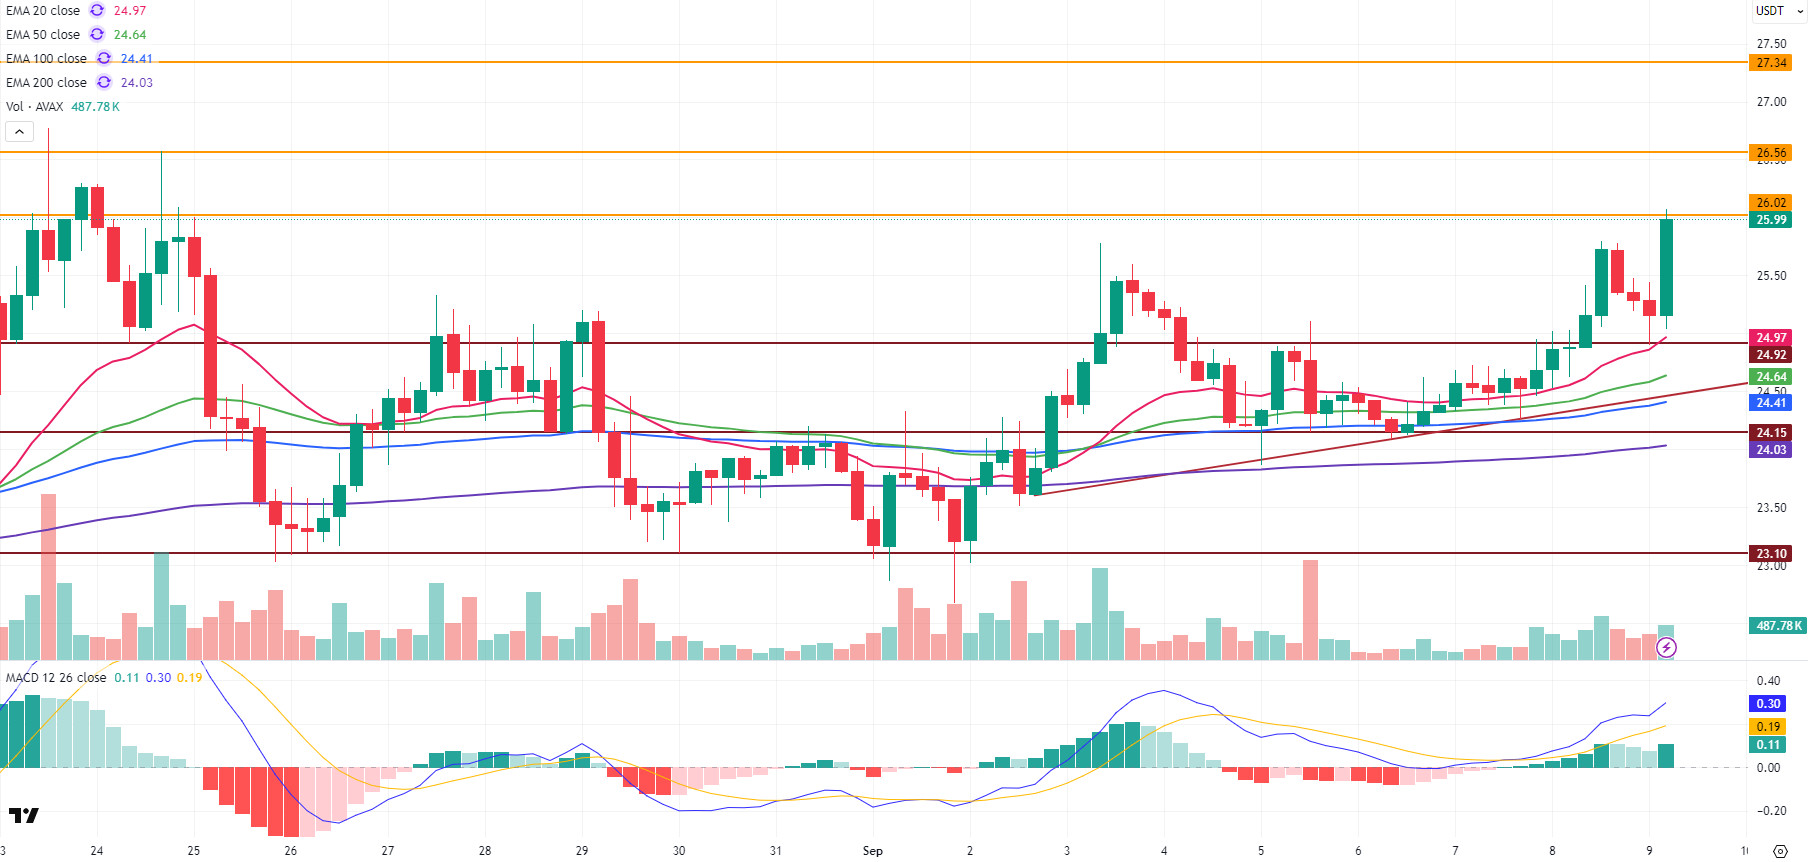
AVAX started the new day with an increase. AVAX, which closed yesterday at $ 25.28, rose to $ 26 with an increase of approximately 2.8%. The increase in daily trading volume in the AVAX ecosystem and the growth in RWA increased investor interest in AVAX and was effective in its rise. Rising to $ 26, AVAX’s persistence above this level may create a gradual upward potential up to $ 30 in the short term. It is important that the rise is supported by volume purchases, otherwise it is possible to decline with profit sales.
On the technical indicators side, while the Moving Average Convergence/Divergence (MACD) is above the signal line on the 4-hour chart, its rise has gained momentum and continues its positive momentum. This indicates that the upward trend may continue. AVAX is also trading above the critical Exponential Moving Average (EMA) levels. AVAX started to rise again with the purchases at the EMA20 level in the decline it experienced. Momentum continues to strengthen as selling pressure decreases.
It is important for AVAX to break the critical $ 26.02 resistance level and stay above this level. If it is permanent above this level, the resistance levels of $ 26.56 and then $ 27.34 will come to the agenda, respectively, in its rise with strong purchases that may come while the selling pressure decreases. If these levels are exceeded, there may be the potential to gradually rise to the $ 30 level. On the contrary, if AVAX cannot persist above the $ 26.02 resistance level, it may test the EMA20 and $ 24.92 support levels in its decline with the selling pressure that may occur. If it falls below these levels, selling pressure may increase and it may fall to $ 23.10 support levels after $ 24.15. The general outlook on AVAX is positive. Strong purchases and positive news are important to maintain this outlook. Otherwise, it may decline with profit sales that may come in resistance zones in its rise.
(EMA20: Pink Line EMA50: Green Line, EMA100: Blue Line, EMA200: Purple Line)
Supports 24.92 – 24.15 – 23.10
Resistances 26.02 – 26.56 – 27.34
BNB/USDT
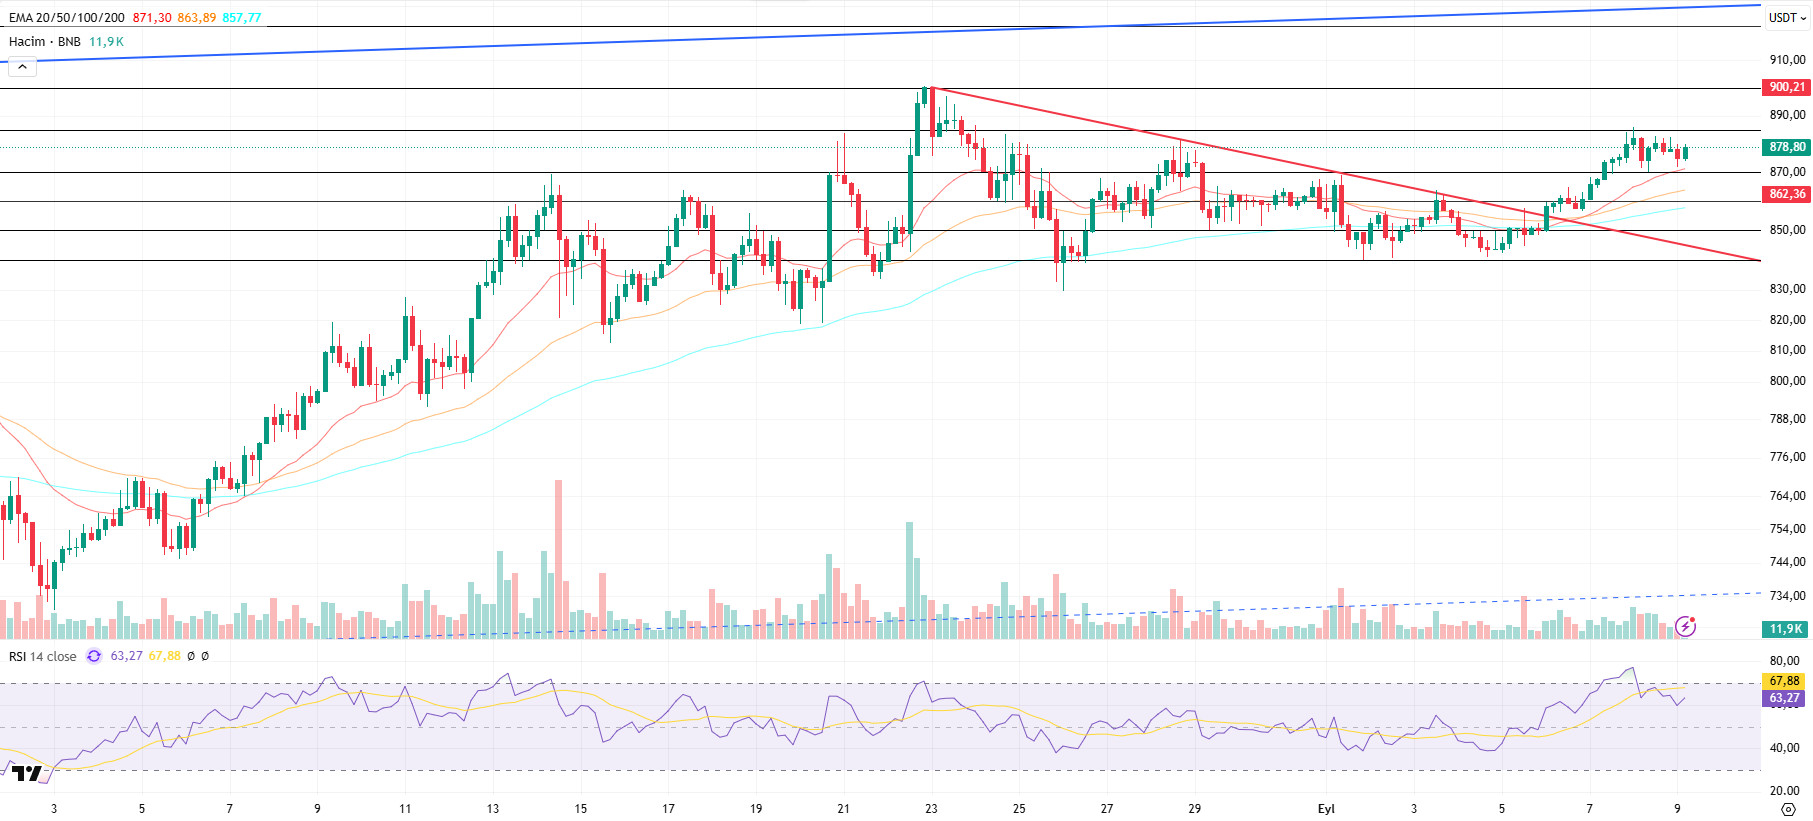
From a technical point of view, BNB/USDT continued its downward trend to the $840 level with the selling pressure it saw from the $900 peak level in the four-hour period. Finding support three times from this level, BNB regained positive momentum up to $885. Thus, the asset generally displayed a horizontal outlook between the $ 840-885 levels.
However, BNB, which saw selling pressure below the $ 885 level, fell to $ 870 in line with our expectations and regained positive momentum with support from this level. With this move, the asset showed that it is at the decision stage between the $ 870-885 levels.
In this context, technical indicators for BNB/USDT, which is traded in the range of $870-885, show that a weak trend in trading volume has recently come to the fore. This picture indicates that the market has entered the decision phase. On the other hand, although the Relative Strength Index (RSI) rose above the 70 level, it declined with selling pressure on the new day and turned its direction down. This technical structure indicates that negative trends may continue in the short term.
Within the framework of the current technical outlook, if the positive momentum continues, the BNB price is expected to test the $ 885 resistance level in the first place. If this level is broken upwards, the $ 900 and $ 990 levels stand out as critical resistance zones to be followed, respectively. On the other hand, if the $ 885 resistance is maintained and the sales appetite increases, the price is likely to head towards the $ 870 support level again. If this support is broken, the $ 850 and $ 920 levels, respectively, gain importance as strong levels to follow.
Supports 870 – 860 – 850
Resistances 885 – 900 – 920
ADA/USDT
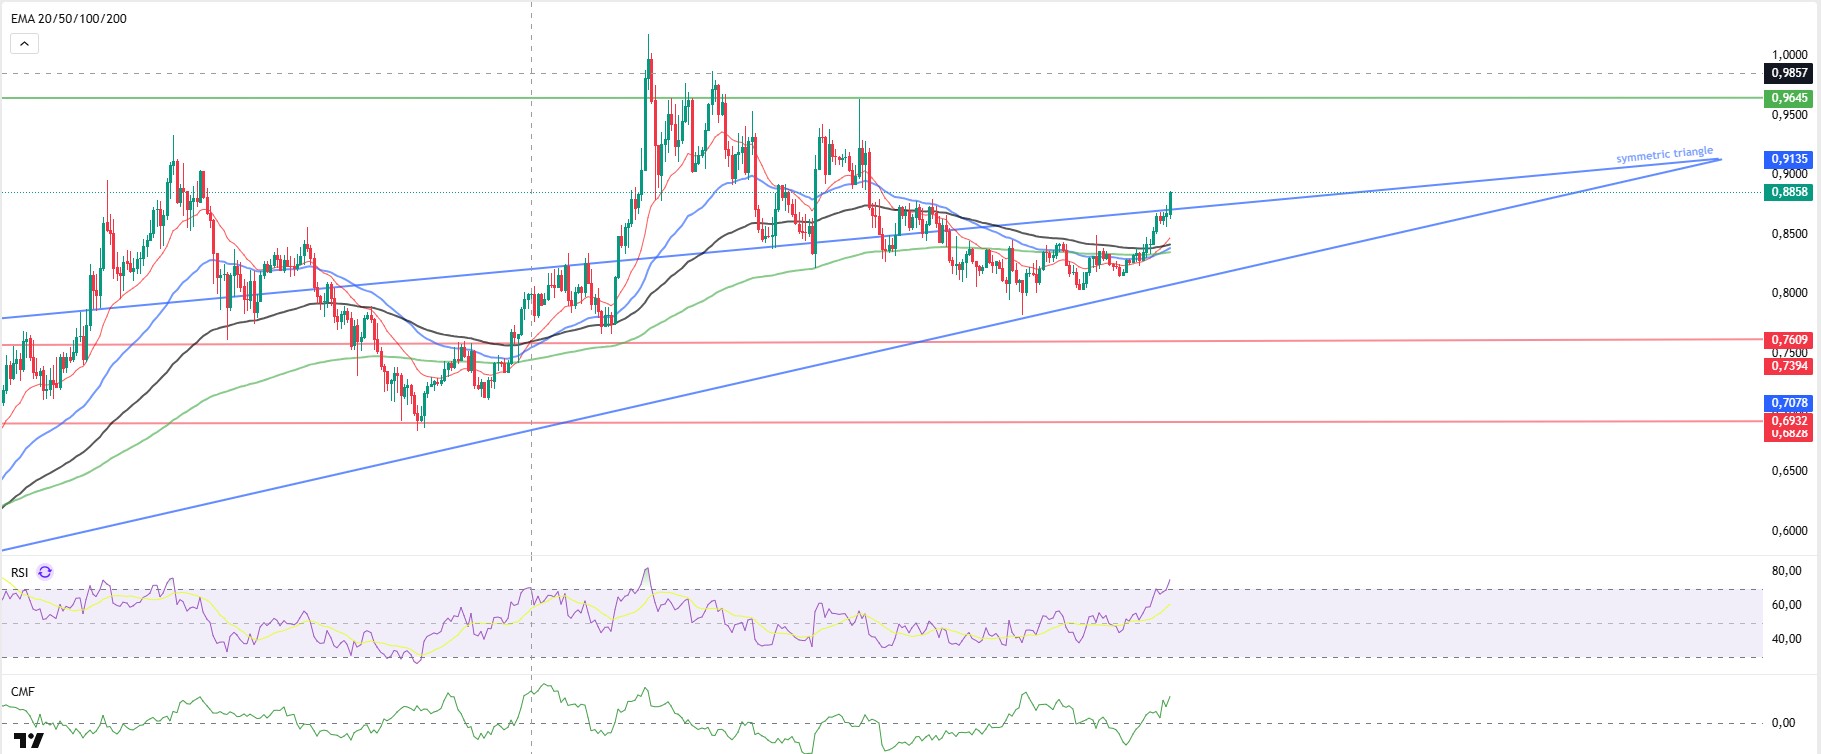
The ADA price rose to $0.8112 on the ADA network, Cumulative Volume Delta data shows that the current liquidity in the market is accumulating in buyers. Taker buying is strong, buyers are trying to push the market price up. It broke the top of the symmetrical triangle pattern and tested the resistance point at 0.8732. As long as it holds above this level, the price can be expected to rise to 0.9135, the second resistance zone. With the cold wallet hacking news announced yesterday, the first support we will follow within the formation of FOMO in the market is the level of 0.8112 dollars, the level where market makers buy.
On the 4-hour chart, ADA continues its bullish move at 0.8857, pinning outside the ascending symmetrical triangle pattern. The price continues to maintain its bullish potential on volume by staying above all moving averages. Especially the 20-day Exponential Moving Average (EMA 20 – Red Line) and (EMA 50 – Blue Line) are important for the continuation of the uptrend. Relative Strength Index (RSI) rose to 75, signaling that it is approaching the overbought zone, while Chaikin Money Flow (CMF-20) rose to 0.25, indicating that there may be buying potential. The bullish signal in money inflows may keep CMF in positive territory and the positive correlation between the two indicators may be a harbinger of a buying effect. In case of Trump’s statements today or in case of purchases related to the ADA ecosystem, the $0.9135 level may appear as our strong resistance point. If the decline starts, the 0.7851 level is an important support level to follow.
Supports 0.8732 – 0.8140 – 0.8112
Resistances 1.1943 – 1.0954 – 0.9135
Legal Notice
The investment information, comments, and recommendations contained herein do not constitute investment advice. Investment advisory services are provided individually by authorized institutions taking into account the risk and return preferences of individuals. The comments and recommendations contained herein are of a general nature. These recommendations may not be suitable for your financial situation and risk and return preferences. Therefore, making an investment decision based solely on the information contained herein may not produce results in line with your expectations.

