
Technical Analysis
BTC/USDT
US President Donald Trump reiterated his call for the Fed to cut interest rates, describing the latest inflation data as “very good”. Noting economic pressures and looming debt maturity dates, Trump stated that a rate cut is “extremely important”. On the other hand, the US Senate took a historic step for the stablecoin market, passing the GENIUS Act in a procedural vote. The issue of digital reserves has also gained prominence at the global level, with bills in Brazil and Ukraine to include crypto assets in government reserves gaining parliamentary support. The Bitcoin buying strategy of corporates has found support from small German and Canadian companies, with 21 new companies buying Bitcoin in the last month. Today, US Unemployment Claims and PPI data will be followed in the data set.
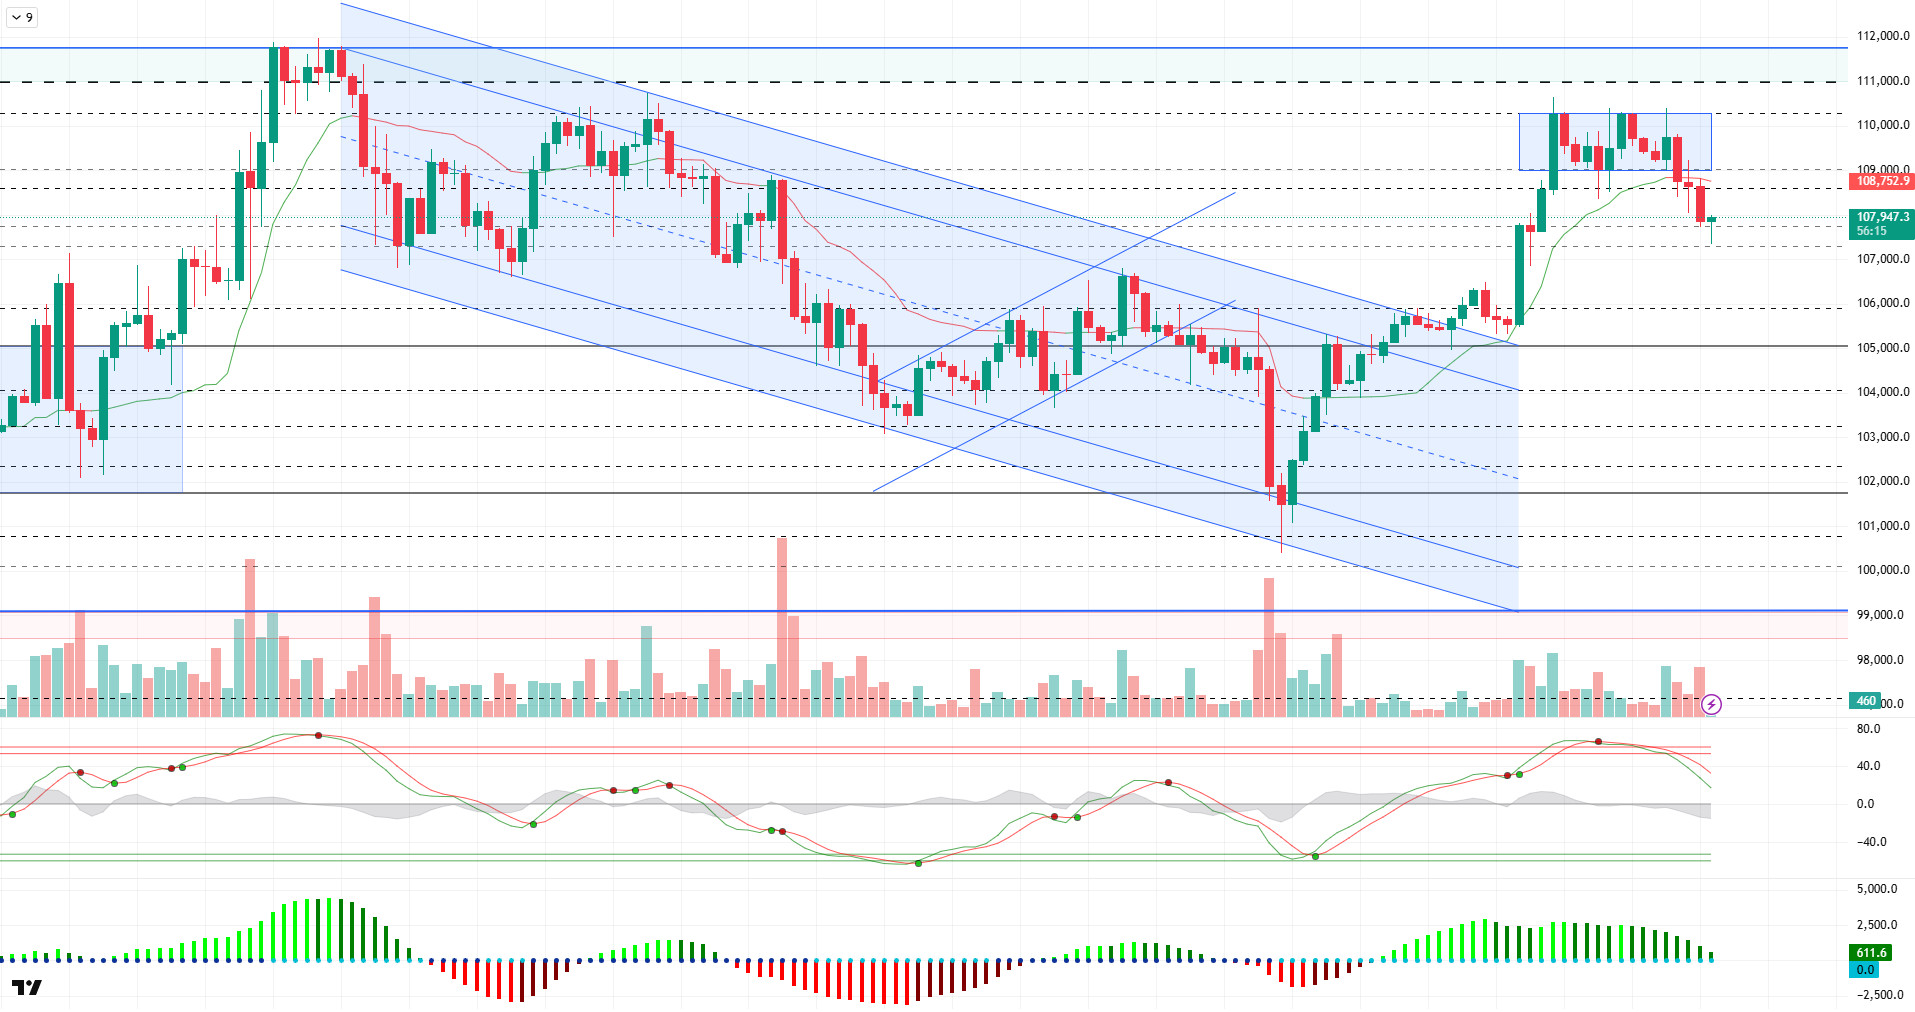
When we look at the technical outlook, BTC responded to technical pressures by breaking the 109,000 level and turned its direction down. Yesterday, the price, which displayed a horizontal image in the minor band range, rose to 110,000 and then retreated, unable to hold this level. BTC, which first stabilized at 108,500 levels with the subsequent selling pressure, then retreated to 107,300 with the break of this support.
The technical structure for BTC, which is trading at 107,900 at the time of writing, continues to confirm the decline. The Wave Trend oscillator is still generating a sell signal as it approaches the channel mid-band. The momentum indicator, on the other hand, continues to look weak, indicating continued pressure on the price. The fact that the Kaufman moving average has crossed above the pricing at 108.745 also supports a short-term downtrend from a technical perspective.
When we look at the liquidation data, although there has been a certain liquidation with the recent decline, it is still seen that buying positions are still concentrated, especially in the region above 106,000. This reinforces the scenario that a possible retracement towards these levels could lead to reaction buying. On the other hand, it is noteworthy that selling positions intensified after the 110,000 level was tested and the accumulation of transactions increased, especially in the 111,000 region.
Considering the technical structure and liquidation data, bearish movements in BTC are likely to continue for a while. In this context, the 107,300 level will be monitored as the first minor support, and if it breaks, the 106,000 level stands out as a critical support line. On the other hand, the continuation of positive developments on the fundamental side may pave the way for a possible recovery movement. In such a scenario, the price regaining the 109,000 level may cause the ATH level to come back on the agenda.
Supports 107,300 – 106,600 – 105,850
Resistances 109,000 – 110,000 – 111,970
ETH/USDT
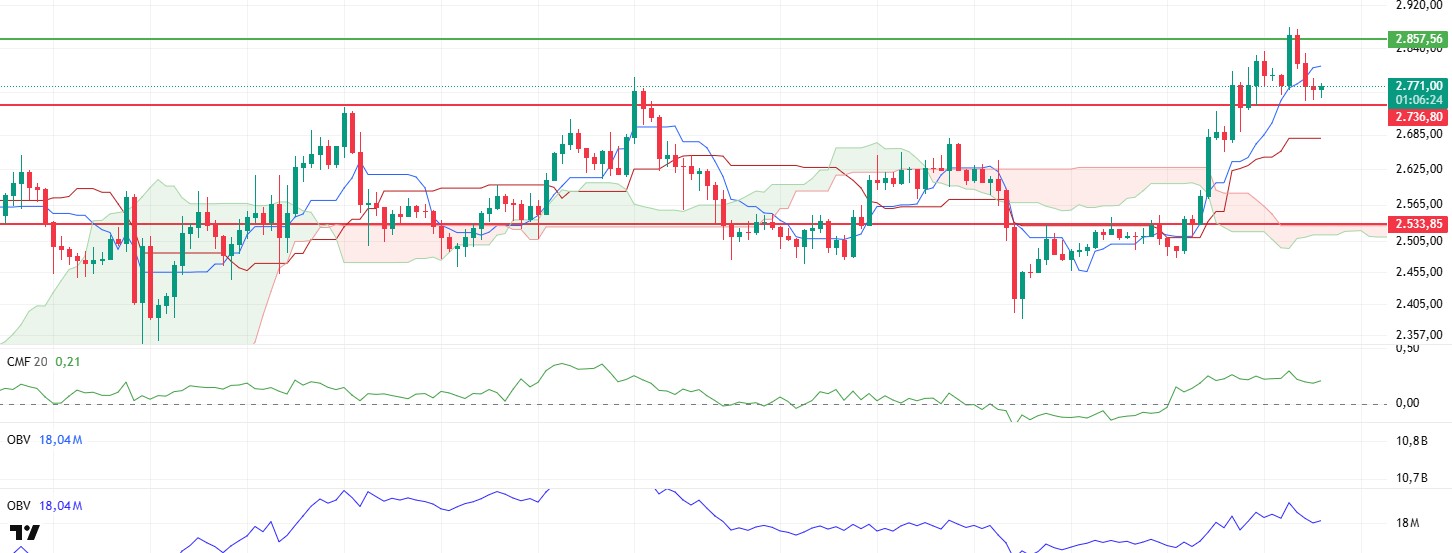
ETH tested an important resistance zone yesterday evening, rising above the $2,857 level, as expected, as technical indicators gave positive signals. However, as a result of the selling pressure from this level, there was a retracement in the night hours and the price fell to the support level of $2,736. This region stands out as an area where the price managed to hold on and sales remained limited for now. Following these developments, technical indicators have turned neutral.
A closer look at the technical analysis tools reveals that the decline in the Cumulative Volume Delta (CVD) indicator indicates that the selling pressure in the spot market is increasing and this pressure is supported by liquidity outflows. This outlook suggests that the price has lost its short-term bullish momentum and market participants are turning to profit realization.
On the other hand, Ichimoku cloud analysis shows that although the price’s sagging below the tenkan level increases the risk of volatility in the short term, the price is still positioned above the kumo cloud and kijun levels, indicating that the medium-term structure remains technically positive. This implies that the market has not yet experienced a structural breakdown and that possible pullbacks could be met with a recovery.
The decline observed in the On Balance Volume (OBV) indicator indicates that the price retracement took place on low trading volume and the sales did not have a strong momentum. This suggests that the short-term decline may be limited and that there is potential for a rebound. In other words, the market-wide easing can be interpreted as a temporary correction rather than a strong breakdown phase.
As a result, although the weakening signals in technical indicators indicate that downside risks persist in the short term, it can be said that Ethereum maintains its positive outlook in structural terms. In this context, in case of persistence below the $2,736 level, it is likely to experience a retracement to the $2,679 region, which is the kijun level. However, maintaining these levels and especially a permanent movement above the $2,857 level may allow the upward momentum to regain strength and continue the upward movement. Careful monitoring of market dynamics shows that price behavior at these critical levels will be decisive for strategic decisions.
Top of Form
Below the Form
Supports 2,736 – 2,533 – 2,254
Resistances 2,857 – 3,062- 3,246
XRP/USDT
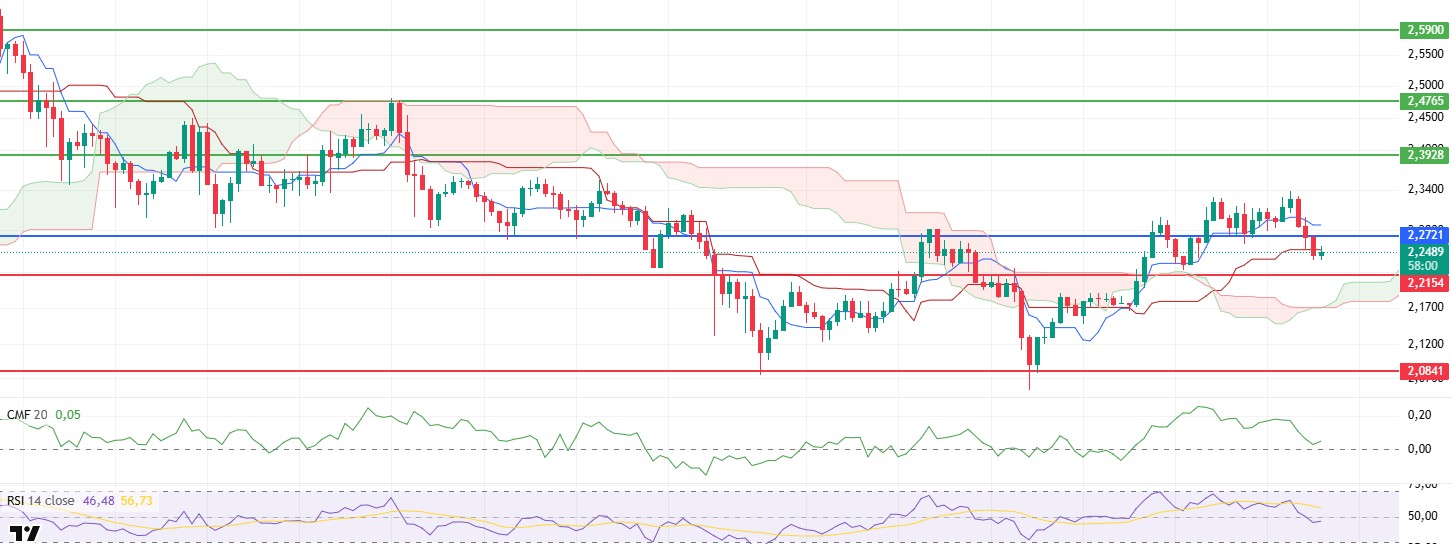
As stated in the analysis made yesterday evening, XRP continued its decline after losing the intermediate support at the $2.27 level and fell to $2.23. The price action, which is currently trying to stabilize at this level, shows that the loss of technical strength continues.
The sharp decline in the Chaikin Money Flow (CMF) indicator reveals a significant liquidity outflow from the market and weakening buyer interest. In particular, values approaching the zero line suggest that selling pressure has increased further and the market tends to move away from risk.
The Relative Strength Index (RSI) indicator has also slipped below the Based MA line and the lack of any positive divergence signals during this transition suggests that the price is struggling to gain upside momentum.
The Ichimoku indicator, on the other hand, shows continued short-term weakness as the price dips below both the tenkan and kijun levels. This view raises the possibility that the decline may continue until the upper band of the Ichimoku cloud. The price may remain under pressure until it encounters cloud support.
When all these technical signals are evaluated, it seems likely that the decline will continue if XRP cannot exceed $2.27 again. In particular, a break of the $2.21 support could pull the price to lower levels, in which case areas within the Ichimoku cloud could be tested. On the other hand, regaining the $2.27 level could help reduce short-term selling pressure and set the stage for the price to recover to the $2.33 level. For this reason, the $2.27 level stands out as a critical threshold both for buyers to re-engage and to limit the decline.
Supports 2.2154 – 2.0841 – 2.0402
Resistances 2.3928 – 2.4765- 2.5900
SOL/USDT
Solana ETF approval chances rise to 91%. Allnodes launches bare-metal servers for Solana validators and originators. SEC blocks DeFi Development’s $1 billion Solana acquisition plan due to document issues.
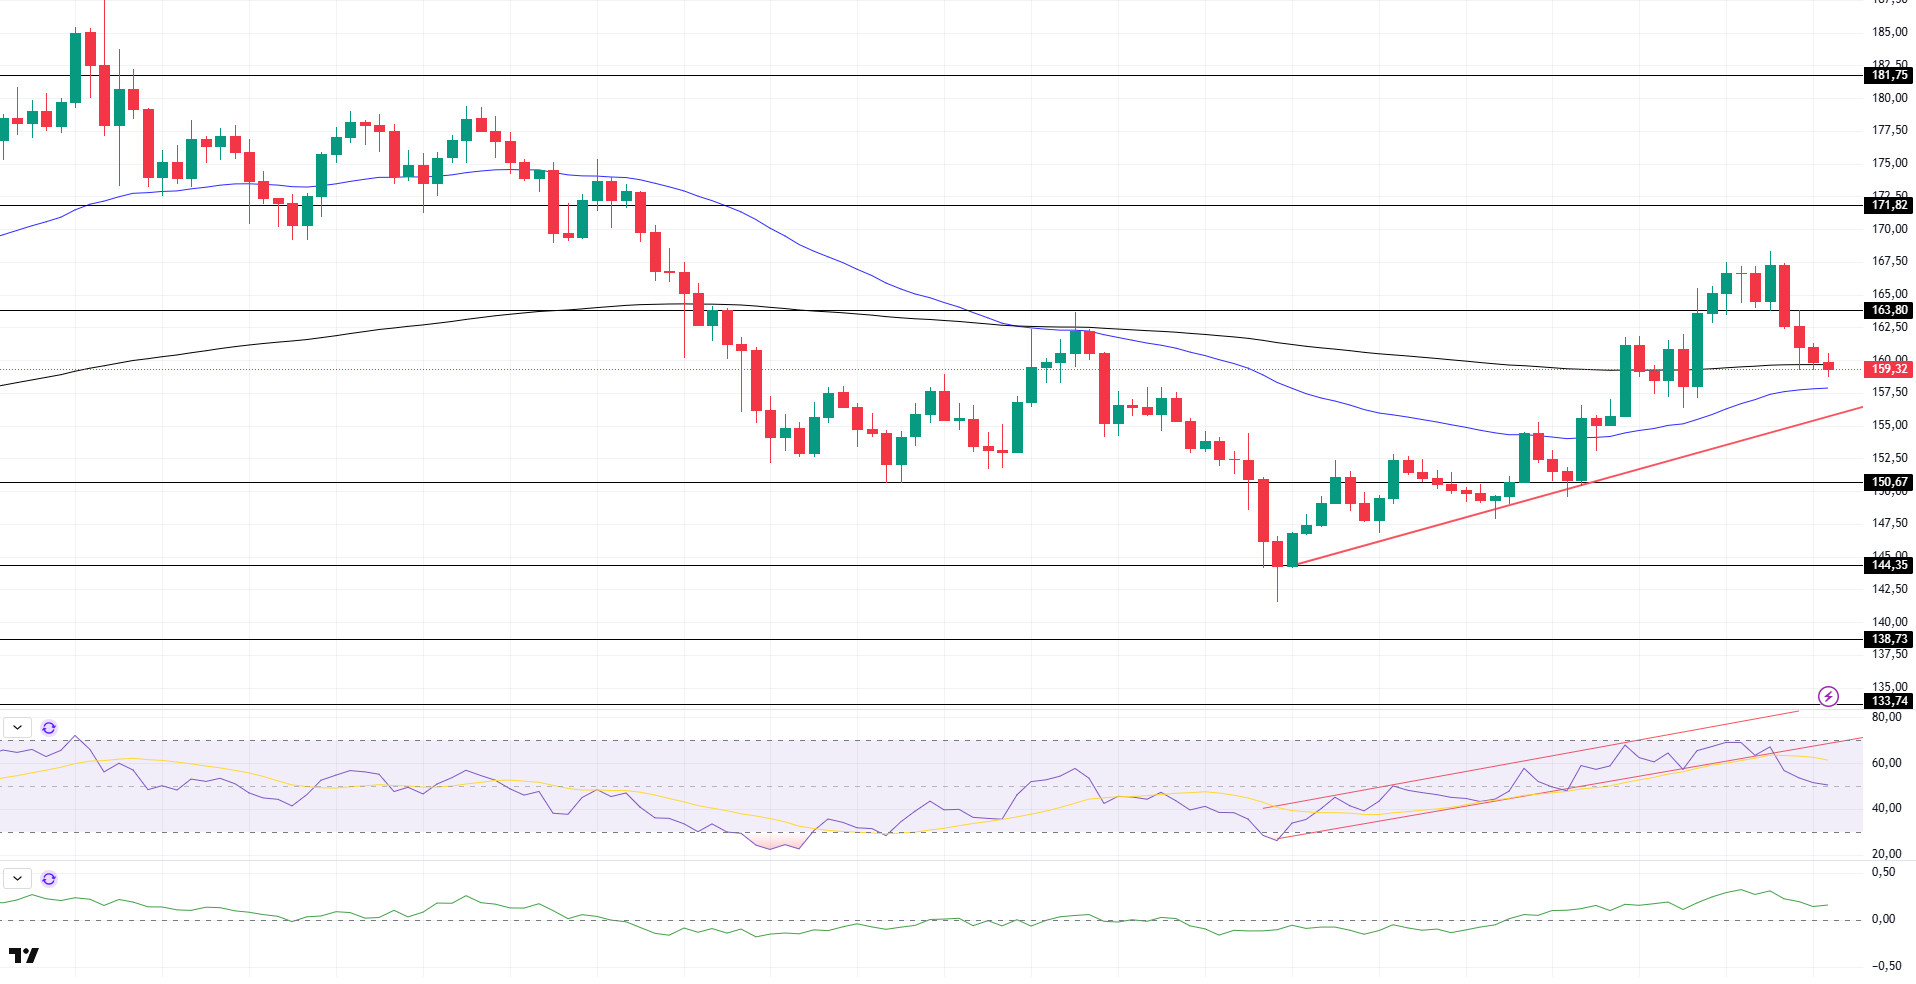
SOL price declined. The asset is currently testing the 200 EMA (Black Line) moving average as support, breaking down the strong support at $163.80. If the pullback continues, it may test the uptrend that started on June 6 as support.
On the 4-hour chart, the 50 EMA continued to be below the 200 EMA. This suggests that the bearish trend may continue in the medium term. At the same time, the fact that the price is between both moving averages suggests that the market is currently in a short-term decision-making phase. Chaikin Money Flow (CMF-20) continues to be in positive territory; in addition, a decline in daily inflows could move CMF into negative territory. Relative Strength Index (RSI-14), on the other hand, started to be in neutral territory. It also broke the uptrend that started on June 5 to the downside and retreated. The $163.80 level stands out as a strong resistance point in case of an uptrend on the back of macroeconomic data or positive news on the Solana ecosystem. If this level is broken upwards, the rise can be expected to continue. If there are pullbacks due to contrary developments or profit realizations, the $150.67 level may be retested. In case of a decline to these support levels, the increase in buying momentum may offer a potential bullish opportunity.
Supports 150.67 – 144.35 – 138.73
Resistances 163.80 – 171.82 – 181.75
DOGE/USDT
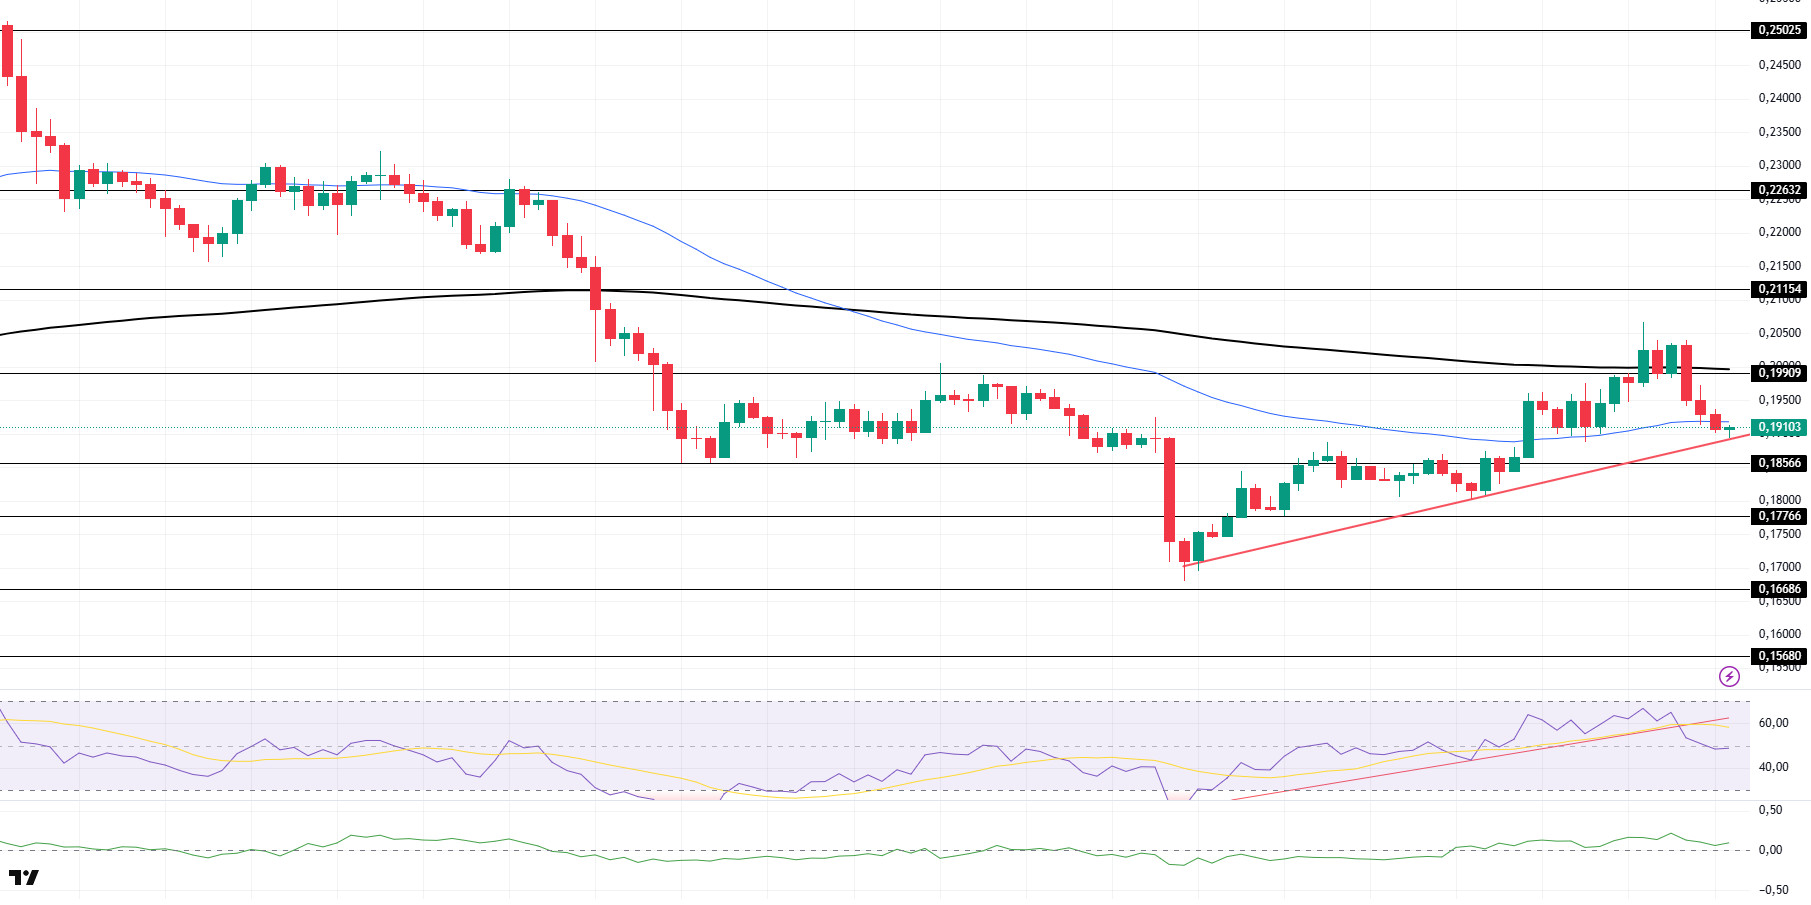
DOGE price declined. The asset, which managed to stay above the uptrend that started on June 6, saw resistance from the 200 EMA (Black Line) and retreated. It is currently testing the uptrend as support. If it breaks here, the strong support level of $ 0.18566 should be followed.
On the 4-hour chart, the 50 EMA (Blue Line) continues to be below the 200 EMA (Black Line). This suggests that the asset is bearish in the medium term. The fact that the price is below the two moving averages signals that the asset is bearish in the short term. The Chaikin Money Flow (CMF-20) indicator continued to be in positive territory. In addition, negative inflows may move CMF into negative territory. Relative Strength Index (RSI-14) moved into negative territory. At the same time, the uptrend that started on June 6 broke down and lost momentum. This may deepen the pullback. The $0.19909 level stands out as a strong resistance zone in the uptrend in line with political developments, macroeconomic data or positive news flow in the DOGE ecosystem. In the opposite case or possible negative news flow, the $0.18566 level may be triggered. In case of a decline to these levels, the momentum may increase, and a new bullish wave may start.
Supports 0.18566 – 0.17766 – 0.16686
Resistances 0.19909 – 0.21154 – 0.22632
Legal Notice
The investment information, comments and recommendations contained herein do not constitute investment advice. Investment advisory services are provided individually by authorized institutions taking into account the risk and return preferences of individuals. The comments and recommendations contained herein are of a general nature. These recommendations may not be suitable for your financial situation and risk and return preferences. Therefore, making an investment decision based solely on the information contained herein may not produce results in line with your expectations.

