
Technical Analysis
BTC/USDT
While the details of the $550 billion investment pledge in the US-Japan trade deal remain unclear, Treasury Secretary Bessent has indicated that some rates may change. The number of listed companies holding more than 1,000 BTC in Onchain data rose to 35 in the third quarter of 2025. These companies held a total of nearly 900,000 BTC, up 35% from purchases in the second quarter. Strategy announced that it increased its STRC stock issuance to $2.52 billion due to investor demand. While Galaxy Digital continues to transfer BTC to centralized exchanges, it is noteworthy that sales are turning towards altcoins.
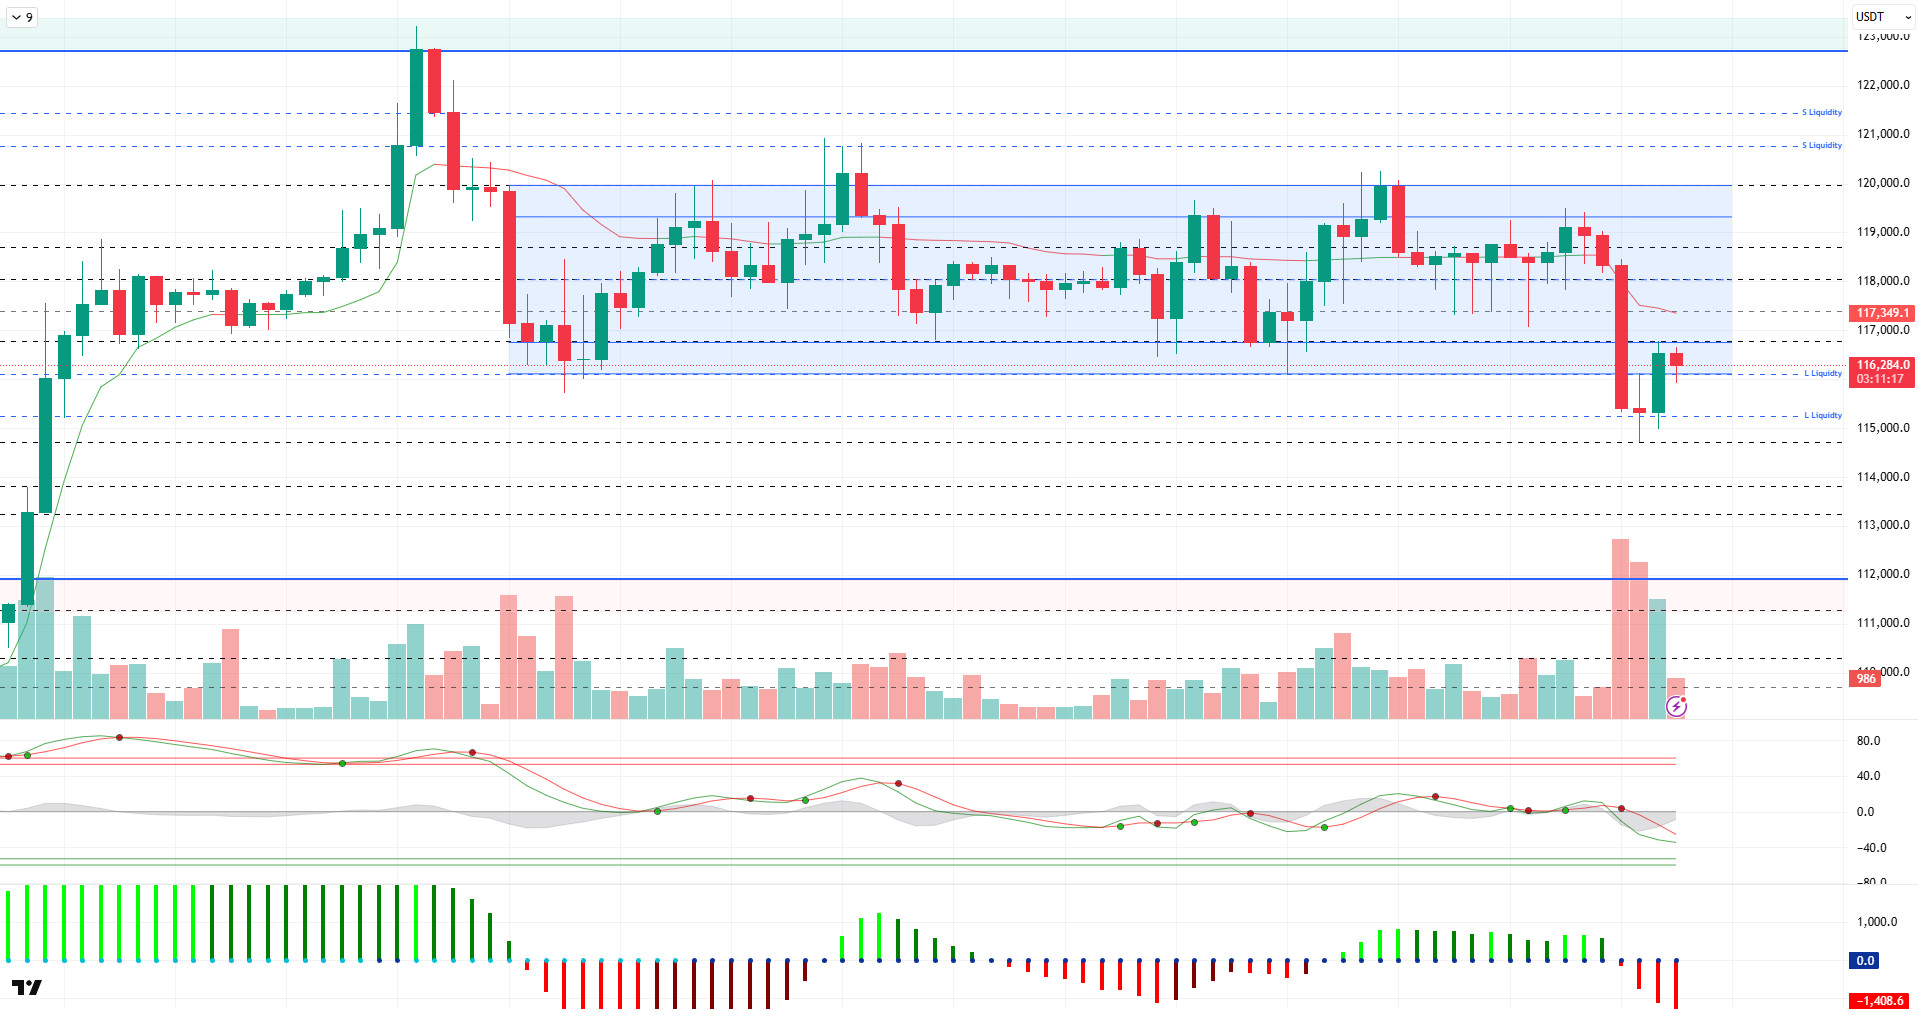
When we look at the technical outlook, it is seen that BTC has made a downward breakdown by failing to exceed the 120,000 level, despite forcing the 116,000 – 119,000 horizontal band range it has been moving in for a while. After this move, BTC fell to 115,000, the support level, while it is trading at 116,300 with the reaction it received from here.
On the technical indicators front, the Wave Trend (WT) oscillator is observed to weaken as it moves from the mid-channel band to the oversold zone with the decline. The Squeeze Momentum (SM) indicator has moved back into negative territory. The Kaufman moving average is at 117.400.
Looking at the liquidity data, it is seen that the buying levels in the 115,000 – 116,000 band were liquidated with yesterday’s decline. In the current situation, while selling positions are gaining momentum, it is noteworthy that the accumulation is above 120,000.
To summarize, BTC tested the new ATH level with fundamental developments and went through a prolonged consolidation phase in the process. However, selling pressure from recent transfer activity pushed the price down to the 115,000 level. As the technical outlook approaches the oversold zone, a rebound from this area could take BTC back to the 116,000 – 119,000 band and continue the consolidation process. Otherwise, if the selling pressure deepens, the price gap between 112,000 and 115,000 will be followed as a new test area with the break of 115,000 level.
Supports 115,000 – 113,300 – 112,000
Resistances 116,800 – 117,500 – 118,600
ETH/USDT
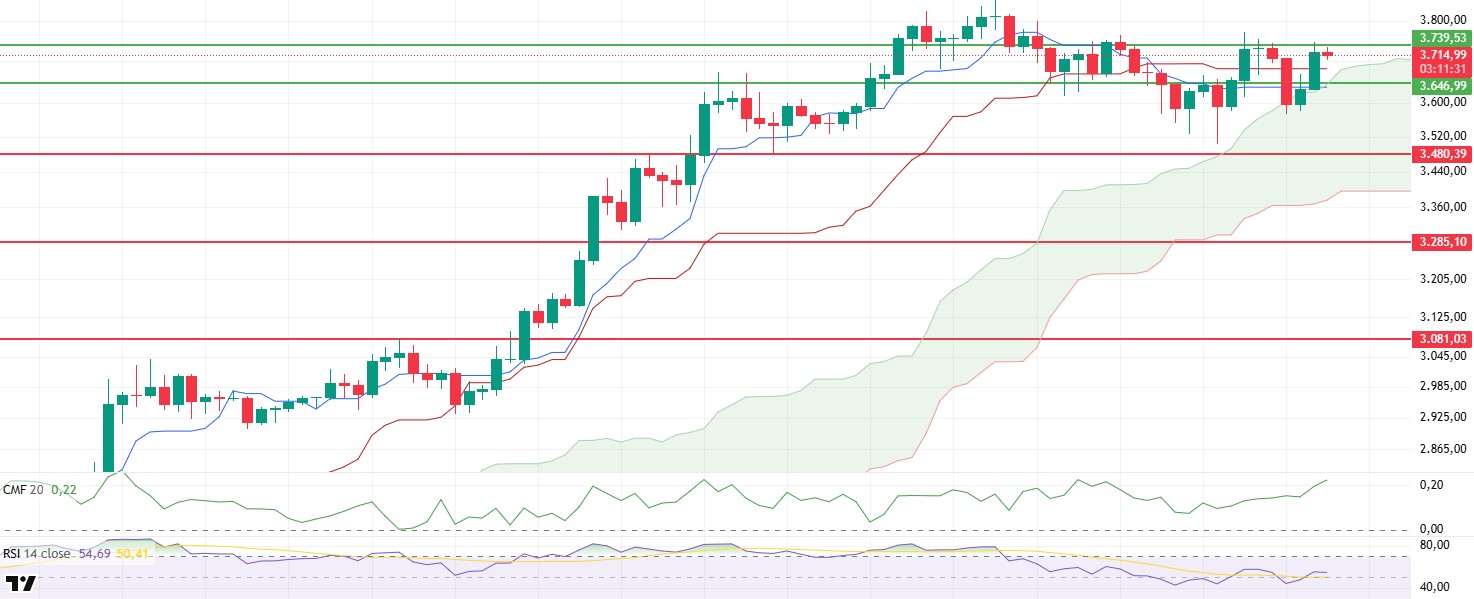
ETH regained the $3,646 level during the day, crossing a critical technical threshold. After this rise, the price rose to the resistance point at $3,739, as expected. However, it has difficulty in providing permanence above this region. While the selling pressure faced by the price at this level is noteworthy, the overall technical outlook still maintains its positive trend.
Looking at the Ichimoku indicator, the price has moved above both the tenkan and kijun levels, indicating that the short-term pressure has eased. However, the fact that the tenkan level is still below the kijun level reveals that this positive structure has not yet gained full strength. With the support from the lower band of the Kumo cloud, the upward trend is maintained, indicating that the trend continues organically.
On the liquidity front, the Chaikin Money Flow (CMF) indicator remains in positive territory. The indicator continues to trend upwards, suggesting that the current uptrend is not only technical but also supported by strong liquidity inflows. This confirms that the market structure is healthy and the price action is based on organic, not artificial, demand growth.
On the momentum side, the Relative Strength Index (RSI) has risen as high as 57 points above the based moving average. While this level indicates buying momentum, it can be considered as a positive signal that the price may continue its upward movement.
When the overall technical structure is evaluated, it is predicted that if the $3,739 level is exceeded and the price is sustained above this region, the price may start a new upward movement towards the $3,800 level. However, in the opposite scenario, that is, if the price loses the support level of $3,646 again, short-term pressure may increase again and there may be a risk that the price may retreat to the $3,500 region. In this context, although current price action is supported in terms of both momentum and liquidity, pricing above $3,739 will be decisive for the continuation of upward momentum.
Supports 3,646 – 3,480 – 3,285
Resistances 3,739 – 4,084 – 4,381
XRP/USDT
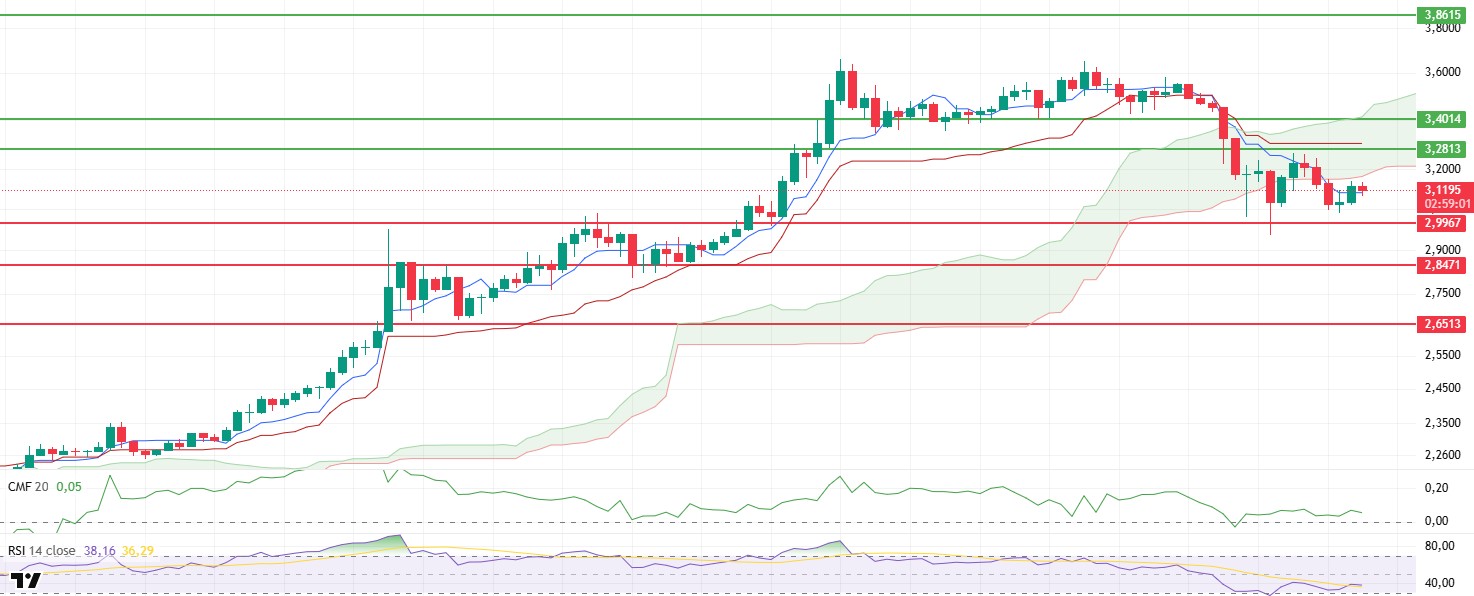
XRP price managed to rise above the $3.10 level by exhibiting an upward movement with the reaction it received from the $2.99 support zone during the day. However, despite this recovery, the overall outlook in technical indicators remains weak. While short-term recoveries remain limited, uncertainty in the market continues.
When the Ichimoku indicator is analyzed, the fact that the price has exceeded the tenkan level is considered a positive signal, but the fact that it is still pricing under the kumo cloud shows that the negative structure continues. This indicates that the upward movement needs more technical confirmation to turn into a strong trend. A break above the lower band of the Kumo cloud could be the first serious sign of a trend change.
The Relative Strength Index (RSI) indicator continues to move horizontally near the oversold zone. The inability of the indicator to react strongly in this region suggests that market momentum remains weak and buying pressure is not yet sufficient. This structure suggests that downside risks are still on the table in the short term and that lower support levels may be tested again in possible selling pressures.
Although the Chaikin Money Flow (CMF) indicator remains in positive territory, it has lost its upward momentum and is flat. This suggests that liquidity entering the market is limited and price movements are not supported by strong capital flows. The lack of upward movement in CMF raises doubts about the sustainability of the uptrend.
In general, if the price loses the $3.10 level, there may be pullbacks towards the $3 psychological support level. This level is a critical threshold for the short-term outlook. On the other hand, if the price continues its upward movement and exceeds the kumo cloud lower band, which corresponds to the $3.17 level, there may be an upward potential up to the $3.28 level as the positive technical structure gains strength. However, for this scenario to materialize, both a recovery in technical indicators and a stronger market structure supported by increased trading volume are required.
Supports 2.9967 – 2.8471 – 2.6513
Resistances 3.2813 – 3.4014 – 3.8615
SOL/USDT
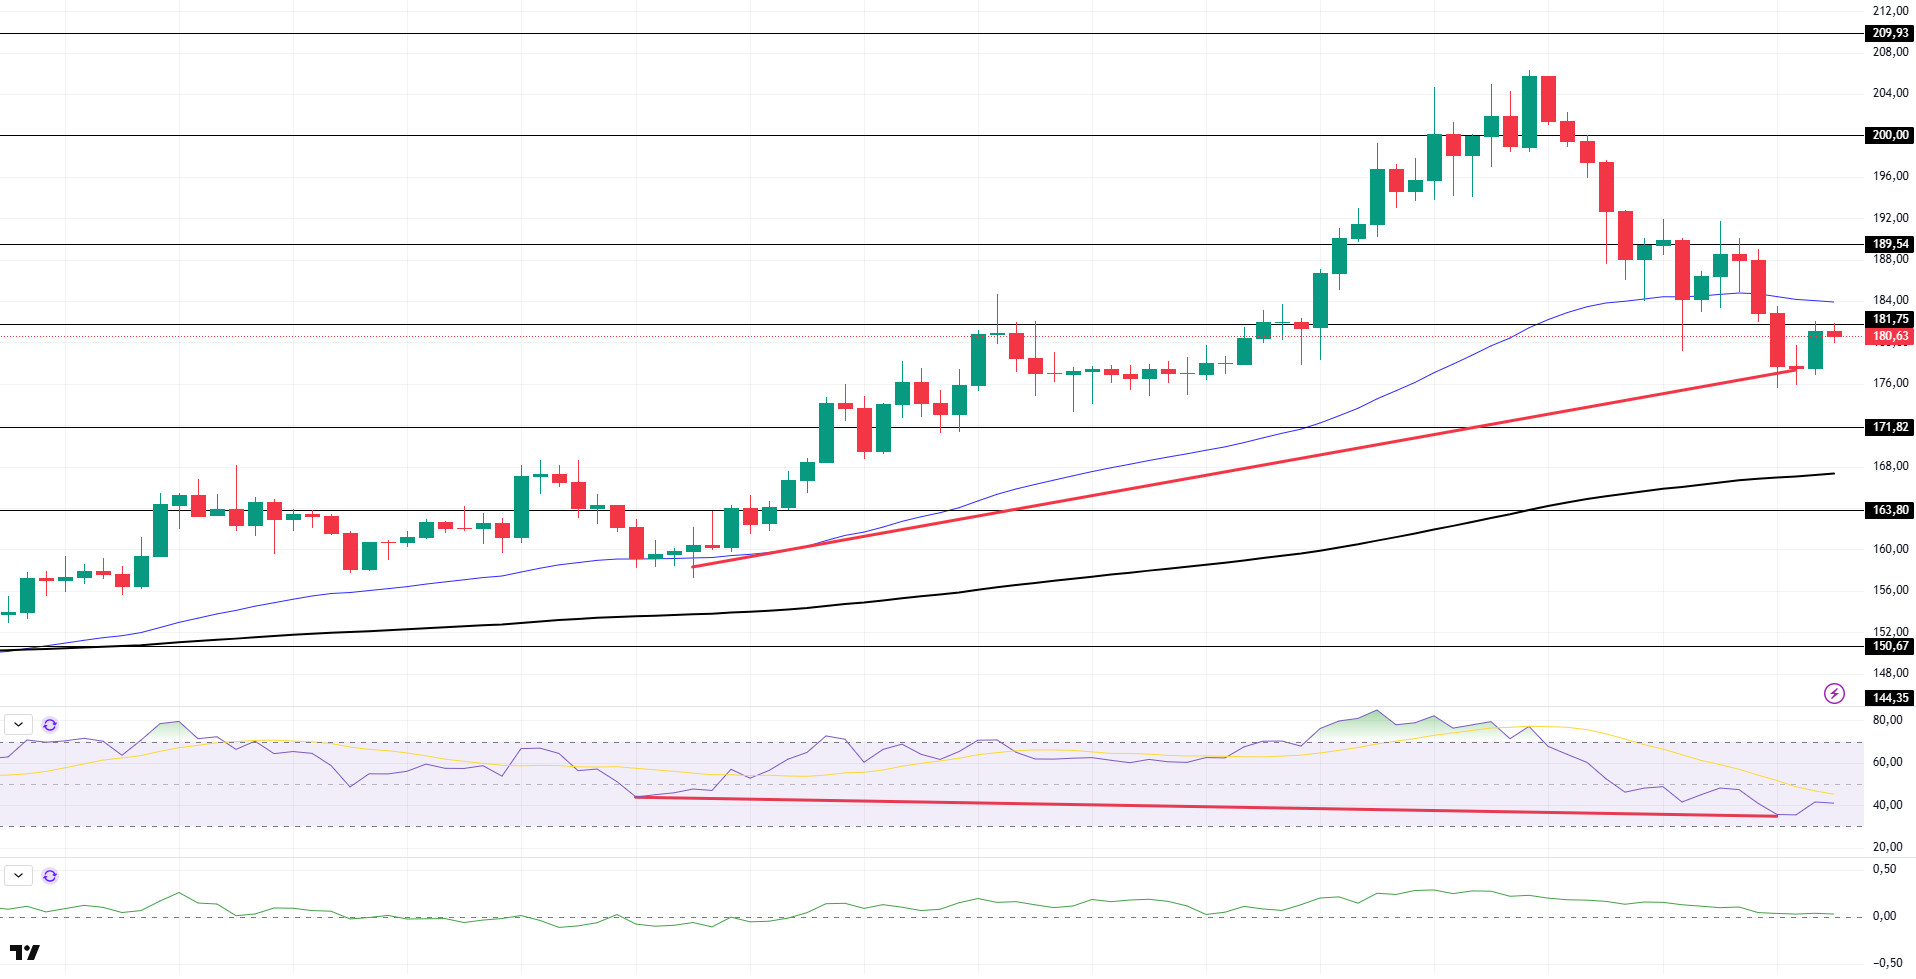
SOL price was slightly bullish during the day. After breaking the $181.75 level downwards, the asset showed a slight recovery trend and started to test this level as resistance. In case of a continuation of the rise, the $189.54 level and the 50 EMA (Blue Line) can be followed. If the retracement continues, the 200 EMA (Black Line) moving average can be followed.
On the 4-hour chart, the 50 EMA (Blue Line) continues to be above the 200 EMA (Black Line). This suggests that the uptrend may continue in the medium term. At the same time, the fact that the price is between both moving averages suggests that the market is currently in a short-term decision phase. On the other hand, a large difference between the two moving averages may trigger a bearish or sideways trend. Chaikin Money Flow (CMF-20) remained in positive territory. However, an increase in money inflows may push CMF to the upper levels of the positive zone. Relative Strength Index (RSI-14), on the other hand, remains in the mid-levels of the negative zone. However, a positive divergence has formed. This could be a bullish harbinger. The $189.54 level stands out as a strong resistance point in the event of a rise on the back of macroeconomic data or positive news on the Solana ecosystem. If this level is broken upwards, the rise can be expected to continue. If there are pullbacks due to contrary developments or profit realizations, the $171.82 level can be tested. In case of a decline to these support levels, the increase in buying momentum may offer a potential bullish opportunity.
Supports 171.82 – 163.80 – 150.67
Resistances 181.75 – 189.54 – 200.00
DOGE/USDT
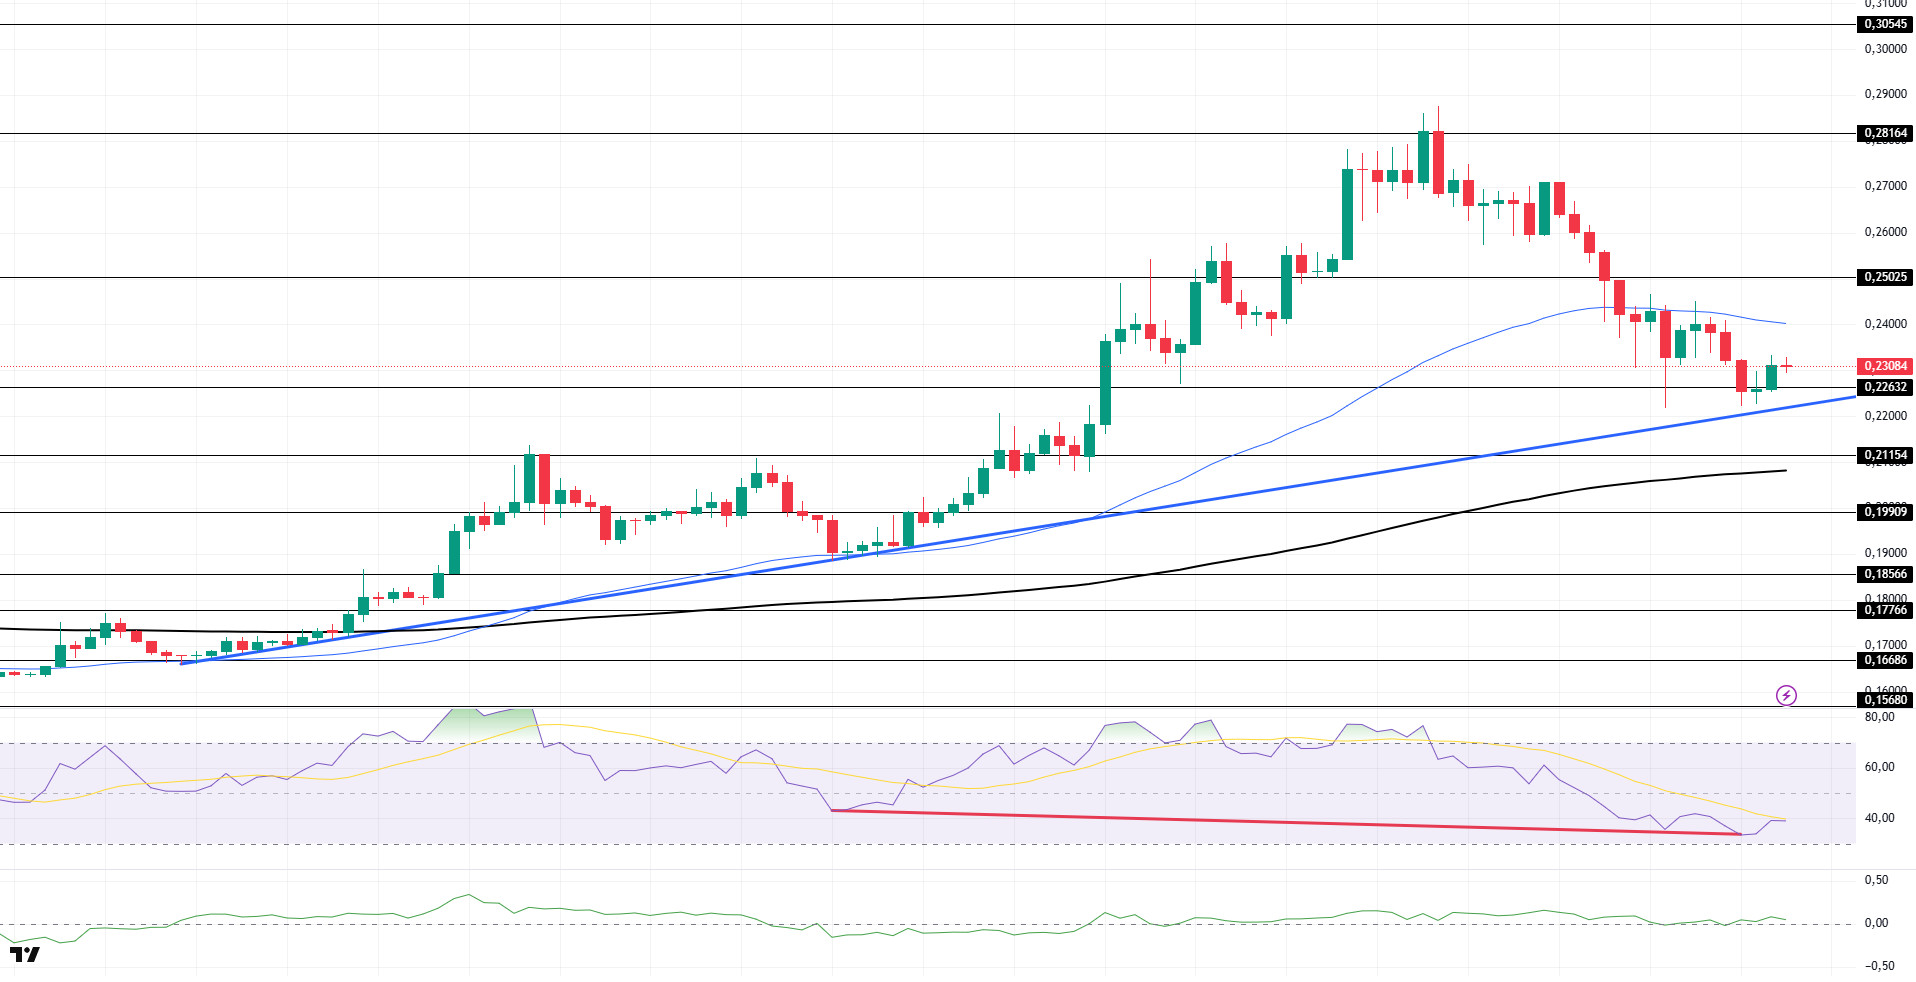
DOGE price was flat during the day. The asset continued to stay above its 200 EMA (Black Line) moving average with the uptrend that started on July 7. The price, which was supported at $0.22632, rose slightly from there. If the upward momentum continues, it may test the $0.25025 level. In case of continued retracement, the 200 EMA (Black Line) moving average should be followed as a support level.
On the 4-hour chart, the 50 EMA (Blue Line) continues to be above the 200 EMA (Black Line). This suggests that the asset is bullish in the medium term. The fact that the price is between both moving averages indicates that the asset is in the decision phase in the short term. A large difference between the two moving averages may cause the price to follow a bearish or sideways trend. Chaikin Money Flow (CMF-20) is in positive territory. In addition, negative money inflows may move CMF into negative territory. Relative Strength Index (RSI-14) continued to be in the middle of the negative zone. In addition, there is a positive mismatch pattern. This could push the price higher. The $0.25025 level stands out as a strong resistance zone in the event of a rally in line with political developments, macroeconomic data or positive news flow in the DOGE ecosystem. In the opposite case or possible negative news flow, the $0.21154 level may be triggered. In case of a decline to these levels, the momentum may increase and a new bullish wave may start.
Supports 0.22632 – 0.21154 – 0.19909
Resistances 0.25025 – 0.28164 – 0.30545
Legal Notice
The investment information, comments and recommendations contained herein do not constitute investment advice. Investment advisory services are provided individually by authorized institutions taking into account the risk and return preferences of individuals. The comments and recommendations contained herein are of a general nature. These recommendations may not be suitable for your financial situation and risk and return preferences. Therefore, making an investment decision based solely on the information contained herein may not produce results in line with your expectations.