Technical Analysis – September 25, 2025
BTC/USDT
Initial jobless claims in the US for the week ending September 20 came in at 218K, below expectations. Second-quarter final GDP growth was confirmed at 3.8%. The core PCE price index came in at 2.6%, in line with expectations. Fed Governor Milan stated that he finds the current interest rate range overly restrictive and called for a rapid 50 basis point interest rate cut.
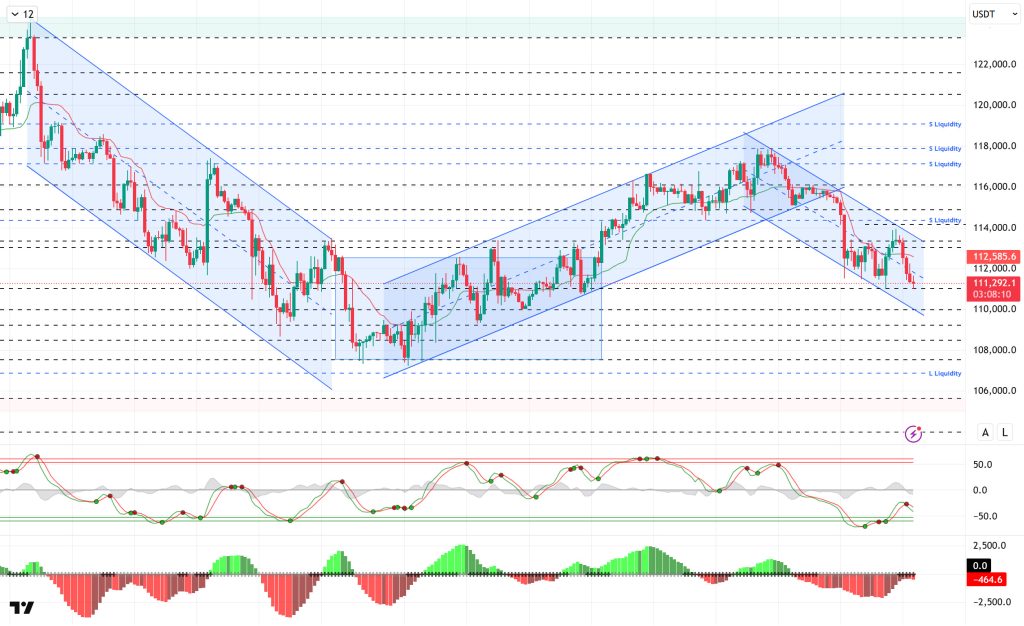
Looking at the technical picture, although BTC occasionally fell below the 111,400 level, it continued to move around the critical support level of 111,400, maintaining its bearish outlook during the day.
Technical indicators, with the Wave Trend oscillator (WT) giving a buy signal in the oversold zone, returned to selling after the trend reversal. The Squeeze Momentum (SM) indicator’s histogram is gaining momentum in the negative zone. The Kaufman moving average is currently trading above the price at the 112,500 level.
Looking at liquidation data, although short-term buy-side transactions have regained intensity at the 111,000 level, positions in this region were liquidated during the day. While buying activity has slowed down, a clear accumulation has formed at the 110,700 level. On the selling side, the 114,200 band stands out as a short-term accumulation zone. In the longer term, a notable concentration has been recorded in the 117,800 – 119,000 range.
In summary, while there is no clear fundamental catalyst for recent sales, the decline in futures-driven selling pressure appears to be deepening the downturn. Overall, the market continues to maintain a positive outlook in the medium term. On the technical side, a minor descending channel is being tracked, and a break above the upper level of the channel could signal a new uptrend. In terms of liquidity data, the recent decline has completely cleared the buying levels, while a significant increase in selling levels stands out. In this context, for the price to recover, it may be necessary to regain the 114,000 level in the first stage, followed by closes above 115,000. However, if selling pressure persists, the 111,400 level will be monitored, and if this level is lost, the 110,000 level will emerge as a new support area.
Support levels: 111,400 – 110,000 – 108,000
Resistance levels: 112,600 – 114,000 – 115,000
ETH/USDT
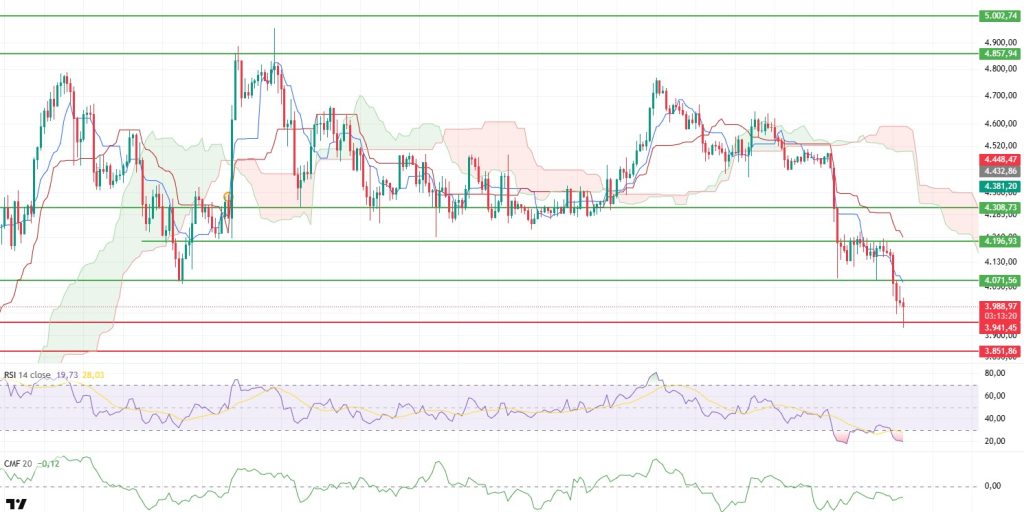
The ETH price experienced quite volatile movements during the day as evening hours approached. With the loss of the 4,071 support level highlighted in the morning analysis, selling pressure intensified and the price retreated to the $3,941 level. Although buying from this area briefly stabilized the price, technical indicators and on-chain data show that the price still has a negative outlook.
On the momentum side, the Relative Strength Index (RSI) indicator remaining in the oversold zone and even continuing its downward movement confirms that heavy selling is still active. This scenario indicates that upward attempts in the short term may remain limited and that selling pressure re-emerges with every recovery attempt. In the Ichimoku indicator, the price trading below both the kumo cloud and the tenkan and kijun levels reveals that the short- and medium-term trend has turned completely negative and that the market continues to be weak. This outlook clearly shows that even if ETH recovers, it will face strong technical resistance.
On the futures side, the sharp decline in open interest reflects accelerated position exits from the market. However, despite this, the funding rates remaining positive is noteworthy. This situation reveals that long positions continue to be opened even as prices fall, indicating that the market has taken on an unbalanced structure. Typically, an increase in long positions in such scenarios can be seen as a negative signal for prices because the market positioning in the opposite direction while selling pressure persists increases the risk of liquidation. The fact that sell-side transactions predominantly dominated throughout the day in the Cumulative Volume Delta (CVD) data supports this weak picture.
Critical price levels continue to be decisive in determining the short-term direction. Although the $3,941 level was tested during the day and received a quick response, it is likely that the price will retest this level in the evening hours. If this support is broken, selling could accelerate and deepen to $3,850 . Losing this region in particular could trigger a stronger wave of selling. On the other hand, in a recovery scenario, the $4.070 level stands out as a critical threshold. If the price breaks above this level and manages to close above it, it could negate the current negative outlook and trigger a rebound towards the $4.196 resistance.
Top of Form
Below the Form
Support levels: 3,941 – 3,851 – 3,672
Resistance levels: 4,071 – 4,196 – 4,308
XRP/USDT
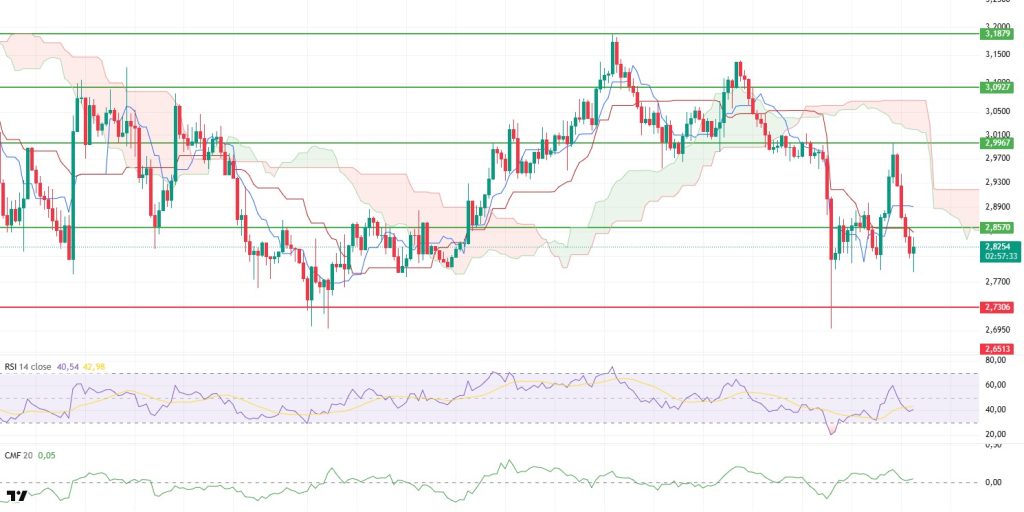
The XRP price fluctuated throughout the day as evening approached. The $2.85 support level highlighted in the morning analysis was lost during the day, causing the price to fall to $2.78. With buying from this area, the price showed a partial recovery and reached the $2.83 level. However, the price remaining below the critical support level indicates that the overall outlook remains negative.
Technical indicators show limited signs of recovery. The Chaikin Money Flow (CMF) indicator rising above the zero line suggests that there is some liquidity entering the market, albeit modestly. This indicates that a completely bearish structure has not formed and that buyers are attempting to assert themselves at certain points. Recovery signals in the Relative Strength Index (RSI) similarly reveal that momentum has begun to gain strength to some extent. However, despite these signs, the fact that the price is still trading below the 2.85 level raises questions about the sustainability of these recoveries.
In the Ichimoku indicator, the price remaining below the Tenkan and Kijun levels indicates that the short-term trend is shaping in favor of sellers. The price, unable to approach the Kumo cloud, is likely to encounter resistance in these areas. Therefore, for the price to regain buyers’ control in the short term, it must first break above the 2.85 level.
Looking at critical levels, as long as the price remains below $2.8570, the market’s weak trend may continue. If this region starts to act as resistance, selling pressure may increase, and the price is likely to test the $2.73 support level. On the other hand, if the $2.85 level is regained and sustained, the possibility of a short-term recovery towards the $2.92 and then $2.99 targets will strengthen.
Support levels: 2.7306 – 2.6513 – 2.4710
Resistance levels: 2.8570 – 2.9967 – 3.0927
SOL/USDT
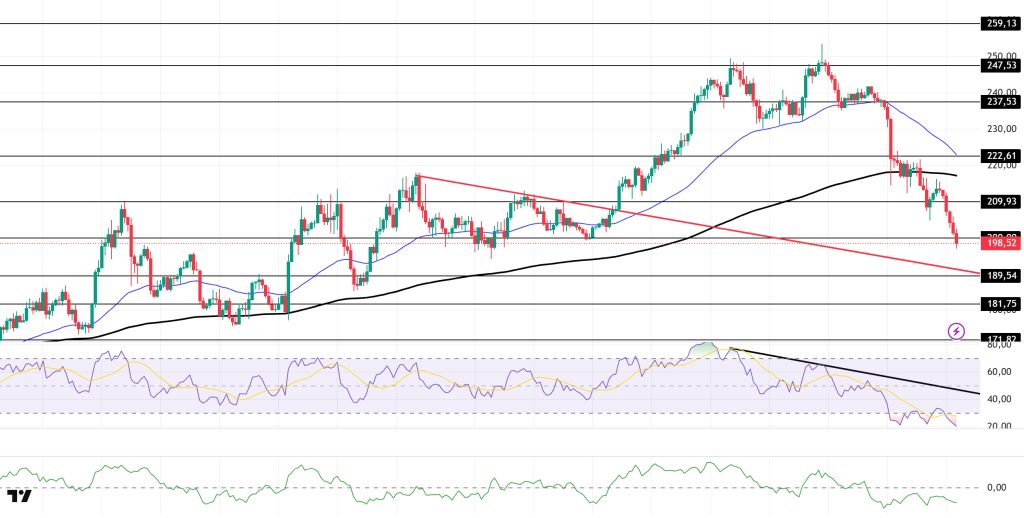
The SOL price continued its decline during the day. The asset remains in the upper region of the downtrend that began on August 29. Currently testing the strong support level of $200.00, the price may test the downtrend as support if the pullback continues. If the price closes above the 200 EMA, the $222.61 level can be monitored.
The price remained above the 50 EMA (Exponential Moving Average – Blue Line) and 200 EMA (Black Line) on the 4-hour chart. This indicates that the upward trend may continue in the medium term. At the same time, the price being below both moving averages shows us that the market is trending downward in the short term. The Chaikin Money Flow (CMF-20) remained in negative territory. However, a decrease in cash inflows could push the CMF deeper into negative territory. The Relative Strength Index (RSI-14) remained in oversold territory. This could lead to minor corrections. At the same time, it continued to remain below the downward trend that began on September 14, indicating that selling pressure continues. In the event of an upturn due to macroeconomic data or positive news related to the Solana ecosystem, the $222.61 level stands out as a strong resistance point. If this level is broken upwards, the uptrend is expected to continue. If there are pullbacks due to developments in the opposite direction or profit-taking, the $200.00 level could be tested. A decline to these support levels could increase buying momentum, presenting a potential upside opportunity.
Support levels: 200.00 – 189.54 – 181.75
Resistance levels: 209.93 – 222.61 – 237.53
DOGE/USDT
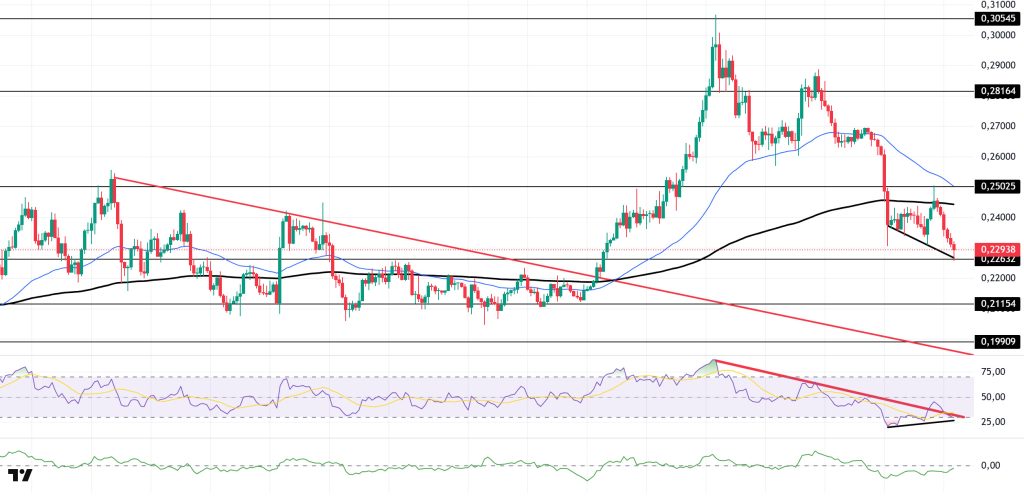
The DOGE price continued to pull back during the day. The asset remained above the downtrend line that began on August 14. Testing the strong support level of $0.25025 as resistance, the price failed to break through and experienced a pullback, moving below the 200 EMA (Exponential Moving Average – Black Line) moving average. Currently testing the $0.22632 level as support, the price may test the downward trend as support in the event of candle closes below this level. If an uptrend begins, it may target the $0.25025 level.
On the 4-hour chart, the 50 EMA (Exponential Moving Average – Blue Line) remained above the 200 EMA (Black Line). This indicates that the medium-term upward trend is continuing. The price being below both moving averages, however, suggests a short-term downward trend. The Chaikin Money Flow (CMF-20) remained in negative territory. Additionally, a decrease in money inflows could push the CMF deeper into negative territory. The Relative Strength Index (RSI-14) rose from the oversold zone to the middle of the negative zone. However, it signaled selling pressure by moving into the lower region of the downtrend that began on September 13. That said, positive divergence could strengthen the upward movement. In the event of an upturn driven by political developments, macroeconomic data, or positive news flow in the DOGE ecosystem, the $0.28164 level stands out as a strong resistance zone. Conversely, in the event of negative news flow, the $0.21154 level could be triggered. A decline to these levels could increase momentum and initiate a new wave of growth.
Support levels: $0.22632 – $0.21154 – $0.19909
Resistance levels: 0.25025 – 0.28164 – 0.30545
Legal Notice
The investment information, comments, and recommendations contained herein do not constitute investment advice. Investment advisory services are provided individually by authorized institutions taking into account the risk and return preferences of individuals. The comments and recommendations contained herein are of a general nature. These recommendations may not be suitable for your financial situation and risk and return preferences. Therefore, making an investment decision based solely on the information contained herein may not produce results in line with your expectations.


