
Technical Analysis
BTC/USDT
According to Coin Shares data, digital asset funds saw a net inflow of $2.48 billion last week, bringing the August total to $4.37 billion. However, assets under management fell by 10% to $219 billion. Ethereum stood out during this period with $3.95 billion in inflows, while Bitcoin experienced a net outflow of $301 million. Glassnode data showed that long-term Bitcoin holders sold approximately 97,000 BTC last Friday, marking the largest single-day sell-off of 2025. El Salvador is preparing to host its first government-backed Bitcoin conference.
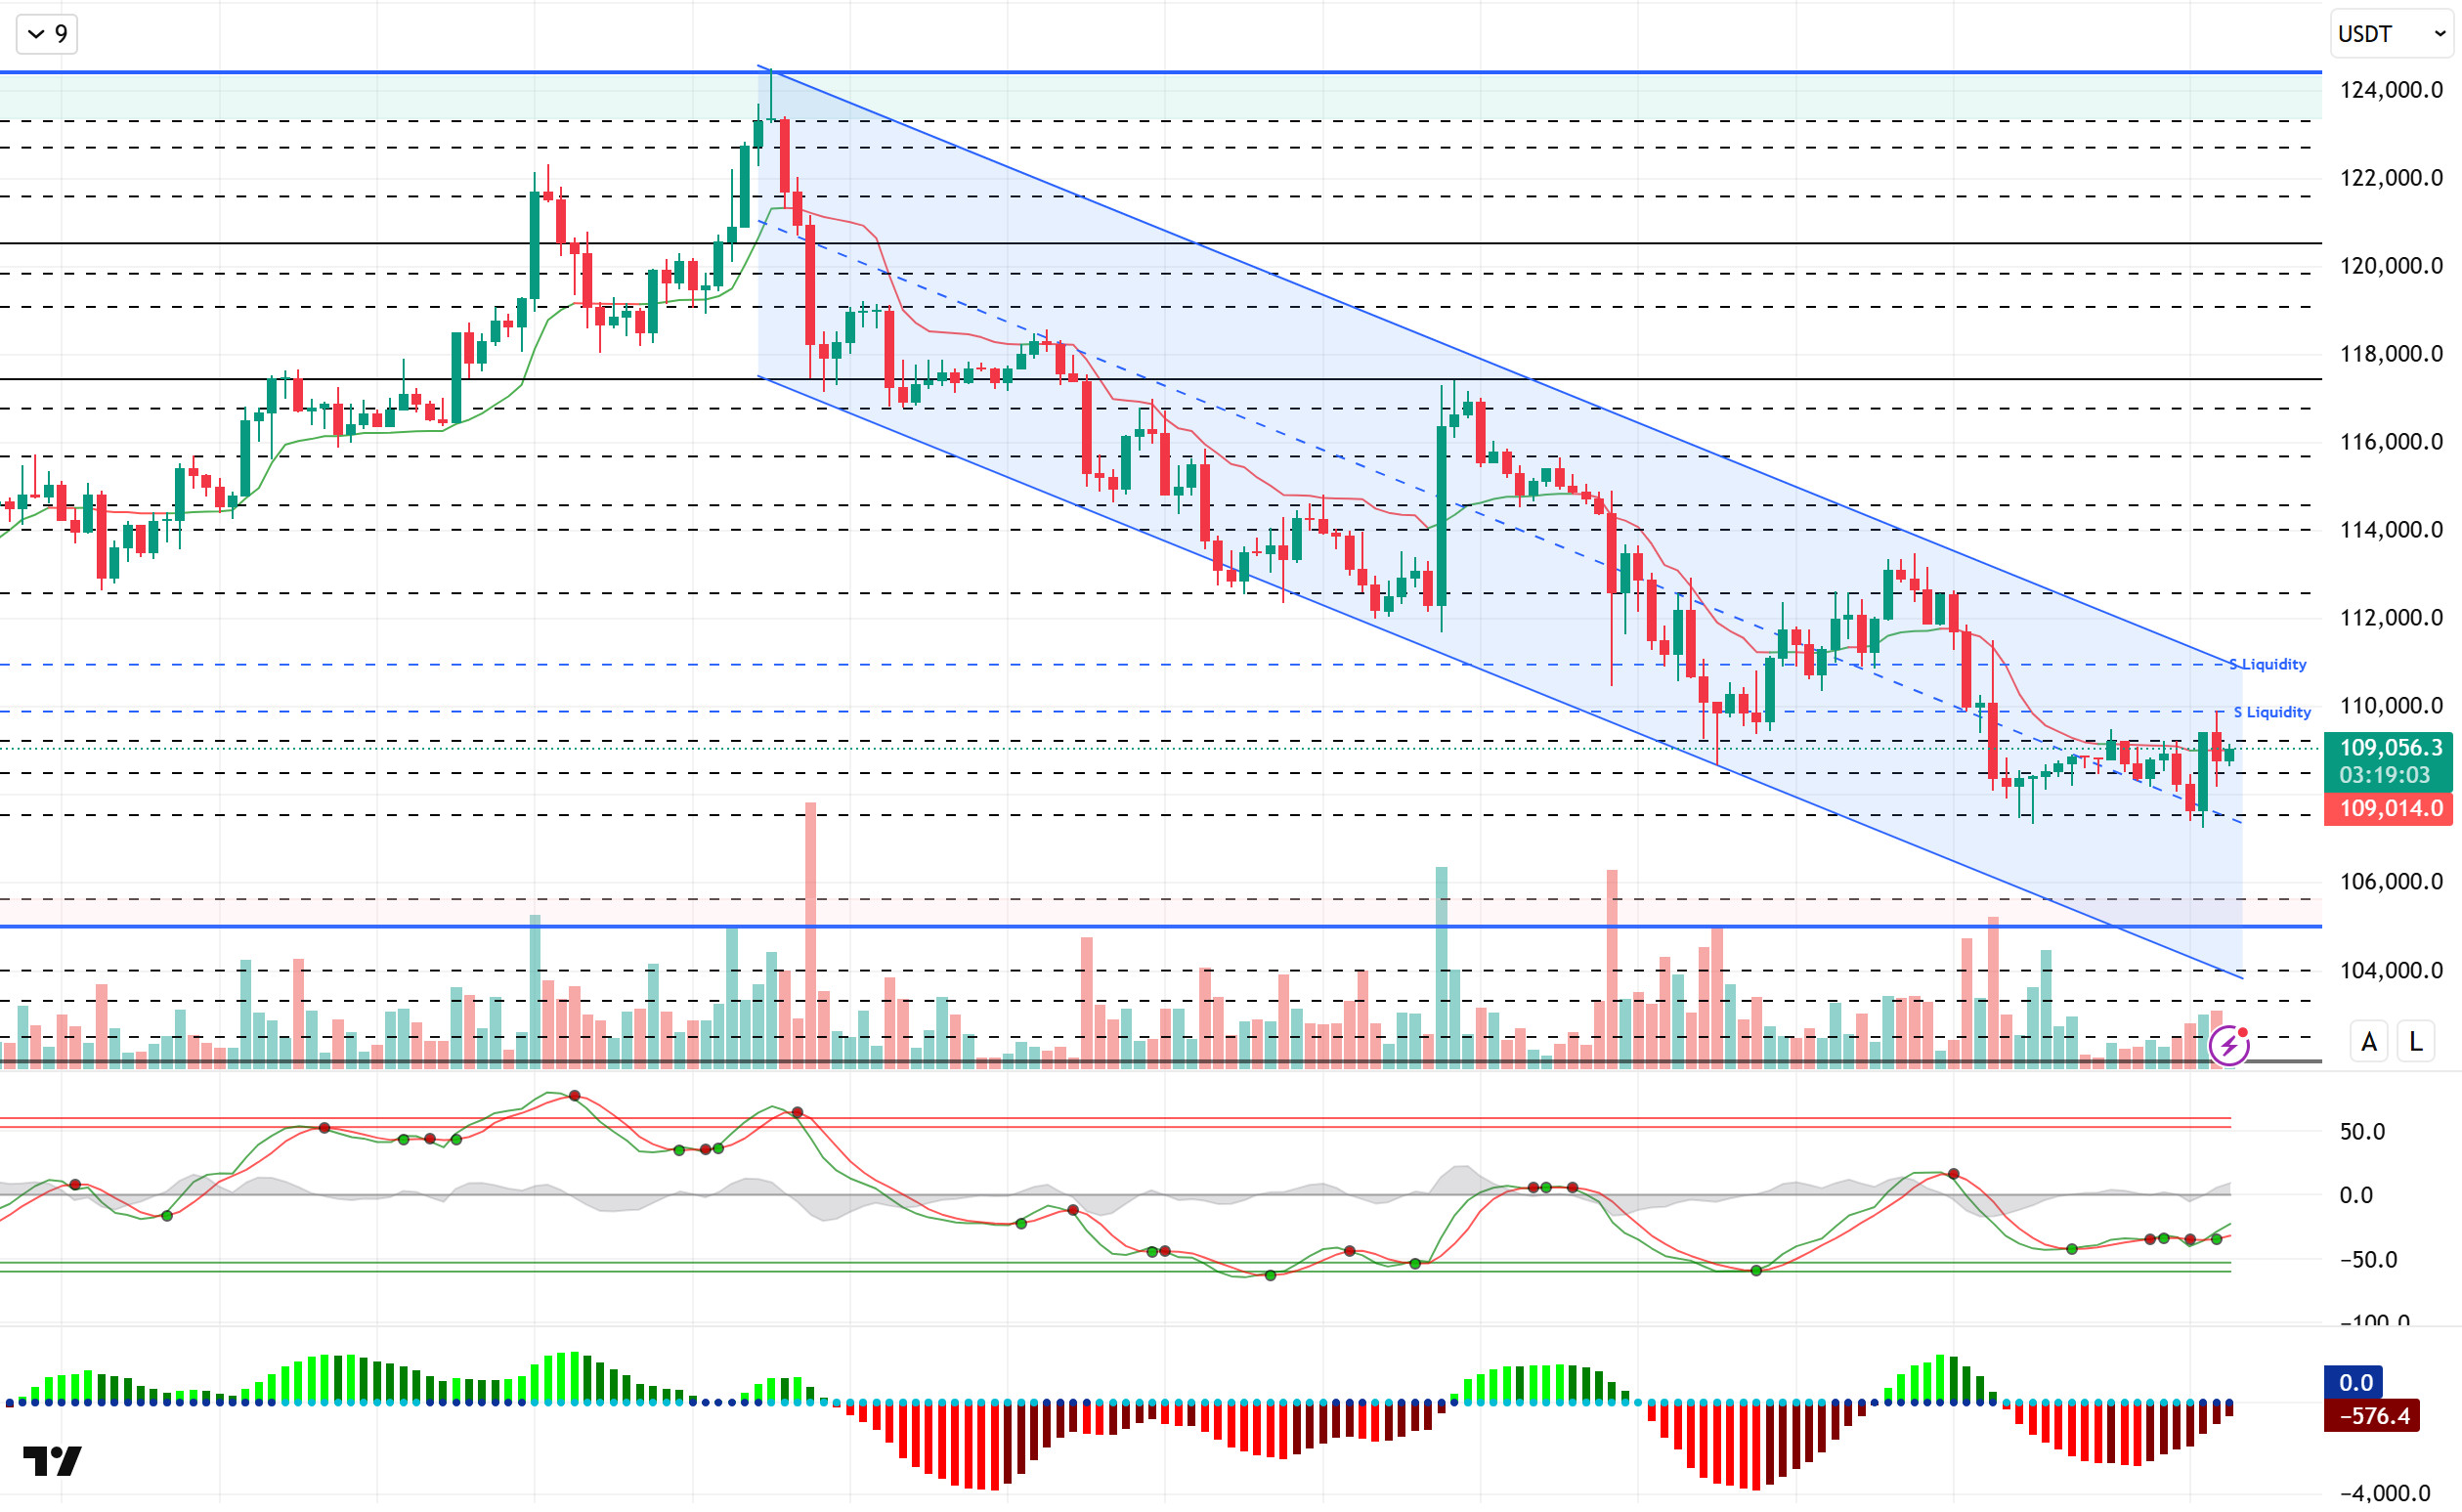
Looking at the technical picture, the price started the day around 108,000 within a falling trend channel and tested the 109,900 level. BTC, which is currently facing rejection from this level, continues to trade around 109,000 at the time of writing.
Technical indicators reveal the price’s indecisive nature, with the Wave Trend oscillator (WT) giving buy/sell signals in the oversold zone, while the Squeeze Momentum (SM) indicator’s histogram is attempting to gain strength within the negative zone. The Kaufman moving average is currently trading above the price at the 109,000 level.
Looking at liquidity data, we see that short-term sell-side transactions are being liquidated intensively within the 109,000–110,000 band, while the next sell level is accumulating at the 114,000 level. Buy-side transactions, on the other hand, are concentrated around 107,000.
In summary, the disappearance of the recent optimistic mood amid fundamental developments, coupled with discussions among Fed members about interest rate cuts and new task allocations, and the continued focus on tariffs, are emerging as factors exerting downward pressure on prices. Technically, the formation of a suitable ground for a new upward movement, supported by sell-side positions in liquidity data, could initiate a new upward trend for BTC following the bottoming movement. In this context, the re-emergence of catalysts in the market is expected to create a driving force on the price. In a potential upward movement, the 110,000 level stands out as a liquidity area, and we will follow the 112,000 level along with momentum. In the event of a deepening decline, the 105,000 level stands out as a reference area that has been tested many times before.
Supports 107,400 – 105,000 – 103,000
Resistance levels 108,500 – 110,000 – 112,000
ETH/USDT
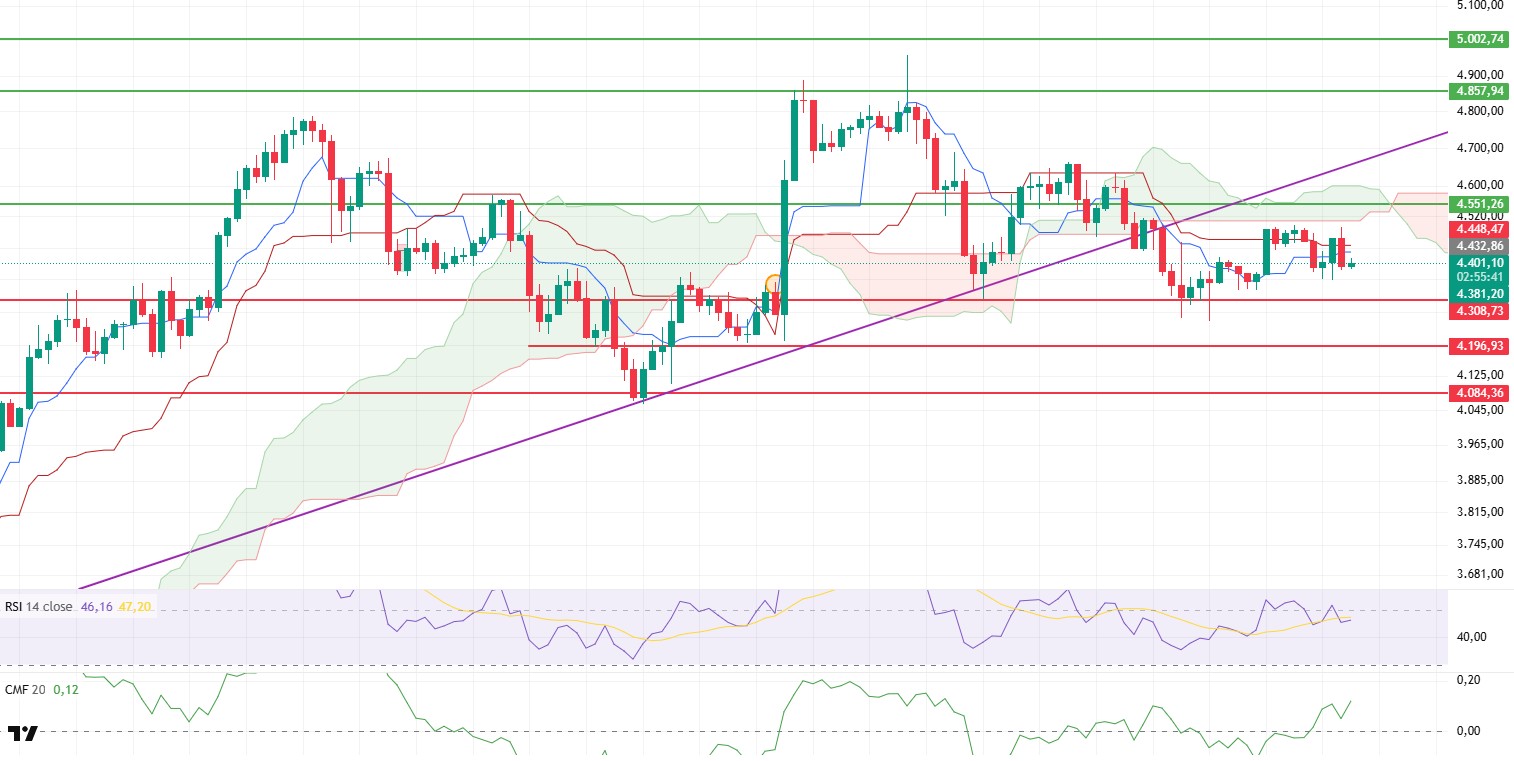
ETH rose to $4,490 during the day, then experienced a pullback amid increased selling pressure in this region and fell below the $4,400 level. While it is currently attempting to hold in this region, it is noteworthy that price movements are showing a more balanced appearance accompanied by weakening momentum. In particular, the recent sideways movement indicates increased short-term uncertainty.
Technical indicators support this price consolidation. The Chaikin Money Flow (CMF) indicator maintaining its upward trend in positive territory signals continued strong liquidity inflows into the market and high appetite among buyers. This outlook paves the way for limited declines in the short term and stronger rebound buying.
In the Ichimoku indicator, the price breaking above the Tenkan and Kijun levels during the day and then falling back below these levels indicates that buyers are losing strength. However, the gap between Tenkan and Kijun gradually closing signals that the positive trend is maintained in the short term. However, for the upward momentum to gain clear strength, it is critical for the price to break above the $4.508 level, which is the lower resistance of the kumo cloud.
On the momentum side, the Relative Strength Index (RSI) indicator is moving horizontally at the 50 level based on the moving average. This outlook reveals that uncertainty persists in the market and that the weakening momentum has not yet broken. A clear rise above the 50 level of the RSI could be interpreted as a signal that the buying side is regaining strength.
In the overall outlook, it appears likely that the price will retest the $4,508 level in the evening hours. A break above this level with high volume could accelerate the upward momentum and trigger a new wave of gains toward the $4,600 range. In the opposite scenario, if prices remain below $4,400 and selling pressure intensifies, a pullback to the $4,308 support level could occur. Closely monitoring these levels in the short term is critical to gaining a clearer understanding of the market’s direction.
Support levels: 4,308 – 4,196 – 4,084
Resistance levels: 4,551 – 4,857 – 5,000
XRP/USDT
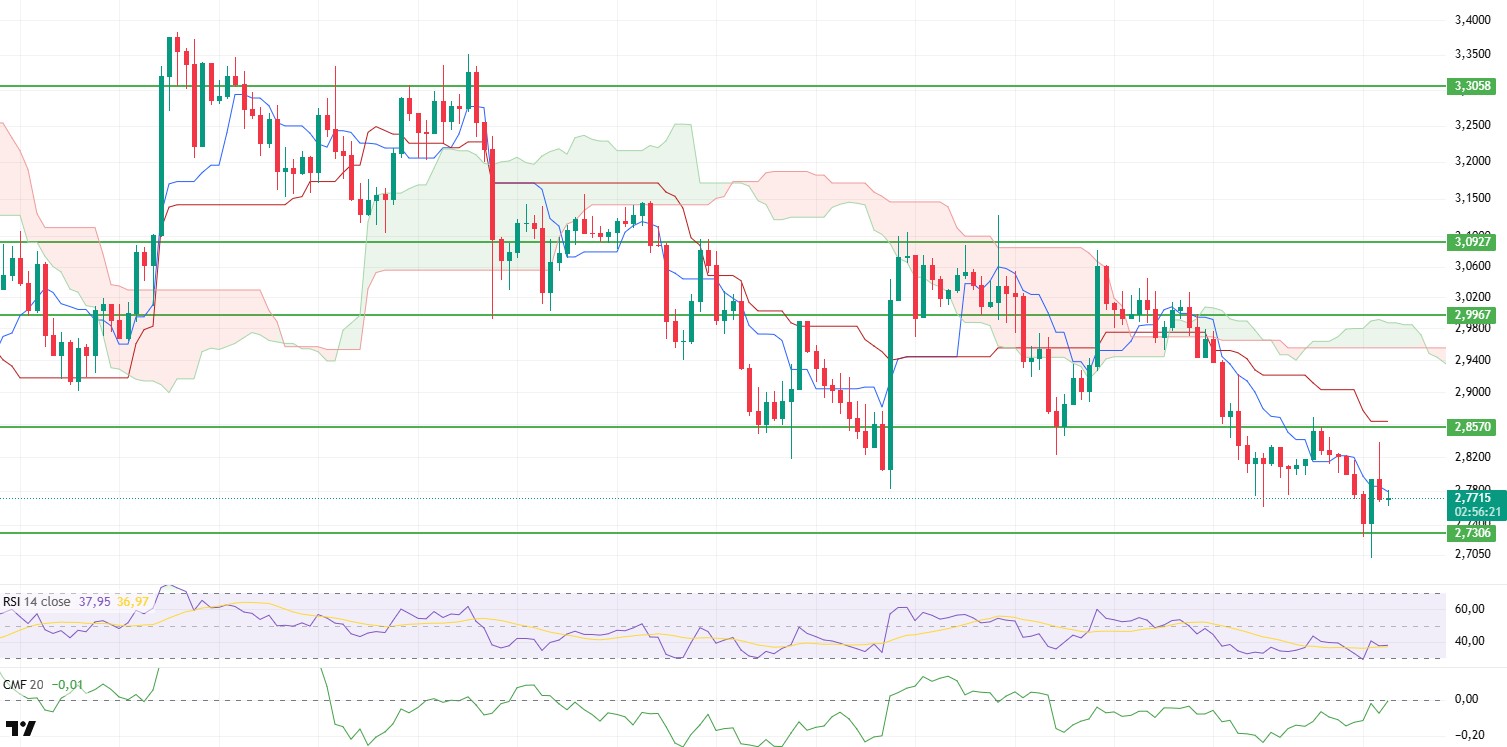
XRP rose to $2.84 during the day. However, selling pressure from this region reversed the price direction and caused it to fall back to $2.77. This movement shows that the price is still fluctuating within a weak band and that buyers have not been able to step in strongly. Although the price movement appears stuck in the short term, testing critical levels remains important for clarifying the direction.
The Chaikin Money Flow (CMF) indicator has risen to the zero line despite remaining in negative territory. This suggests that the amount of liquidity entering the market is increasing and that buyers are gradually starting to strengthen the market. If these liquidity inflows continue, upward price reactions could gain momentum. However, if inflows weaken, the risk of renewed sharp sell-offs remains.
Relative Strength Index (RSI) is also showing clearer signs of recovery. The RSI rose to 38, crossing above the MA line. This indicates that momentum has strengthened somewhat and opens the way for upward price reactions. However, for this recovery to become permanent, the RSI needs to approach or exceed the 50 level. Until this happens, the likelihood of the upturns remaining weak and short-lived is higher.
In the Ichimoku indicator, the price is still moving below the tenkan, kijun, and kumo cloud levels. This structure indicates that the trend is generally negative and is causing upward reactions to remain limited for now. If the price rises above these levels, a significant recovery could begin in the short-term outlook, and the downward pressure in the market could be broken.
In the short term, the $2.85 level is a critical resistance point. If prices sustain above this level, the upward momentum could strengthen, potentially triggering a rise toward the $2.99 level. On the downside, the $2.65 level stands out as the main support. If this region is lost, selling pressure could accelerate, and the price could retreat first to the $2.50 level and then to lower support regions.
Support levels: 2.7306 – 2.6513 – 2.4730
Resistance levels: 2.8570 – 2.9967 – 3.0927
SOL/USDT
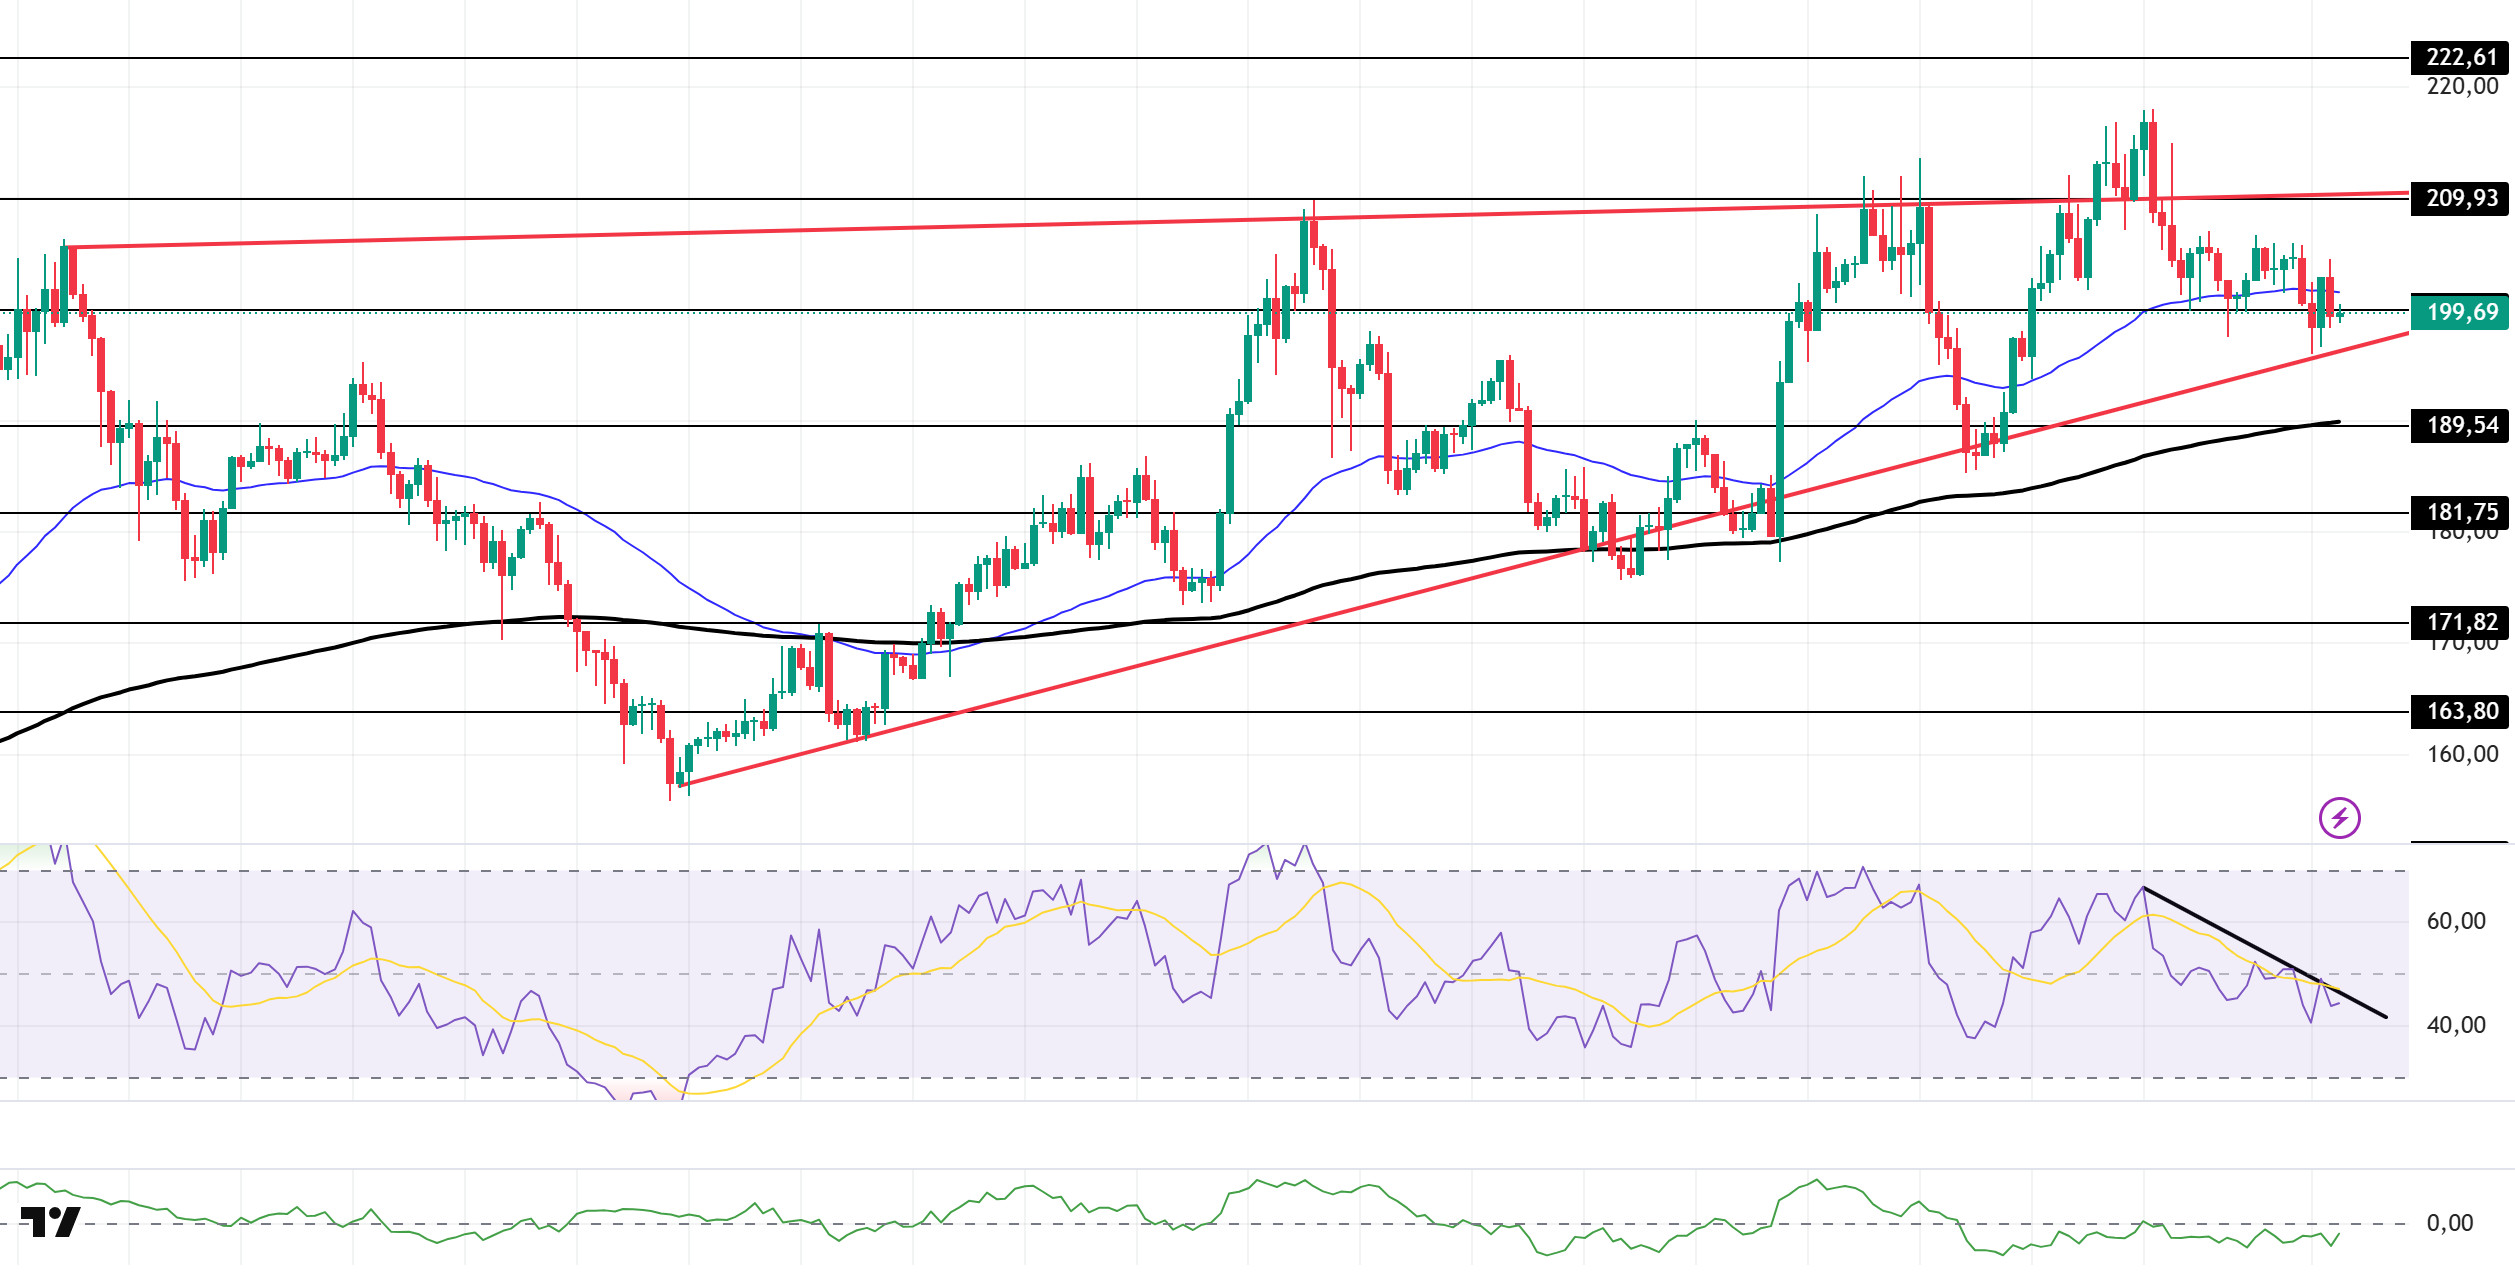
The SOL price remained flat during the day. The asset continued to trade within the ascending wedge formation that began on August 2. Currently trading below the 50 EMA (Exponential Moving Average – Blue Line), the price is testing the $200.00 level as resistance. A candle close above this level could test the formation’s ceiling. If the pullback continues, the $189.54 level could be monitored.
On the 4-hour chart, the 50 EMA (Blue Line) remained above the 200 EMA (Black Line). This indicates that the medium-term upward trend may continue. At the same time, the price being between the two moving averages shows us that the market is in a decision-making phase in the short term. The Chaikin Money Flow (CMF-20) remained in negative territory. However, a decrease in money inflows could push the CMF deeper into negative territory. The Relative Strength Index (RSI-14) remained in negative territory. This signaled that selling pressure was continuing. At the same time, it is currently testing the downtrend that began on August 29. A breakout to the upside could trigger an uptrend. If an uptrend occurs due to macroeconomic data or positive news related to the Solana ecosystem, the $209.93 level stands out as a strong resistance point. If this level is broken to the upside, the uptrend is expected to continue. In the event of pullbacks due to adverse developments or profit-taking, the $189.54 level could be tested. A decline to these support levels ( ) could increase buying momentum, presenting a potential upside opportunity.
Supports: 189.54 – 181.75 – 171.82
Resistances: 200.00 – 209.93 – 222.61
DOGE/USDT
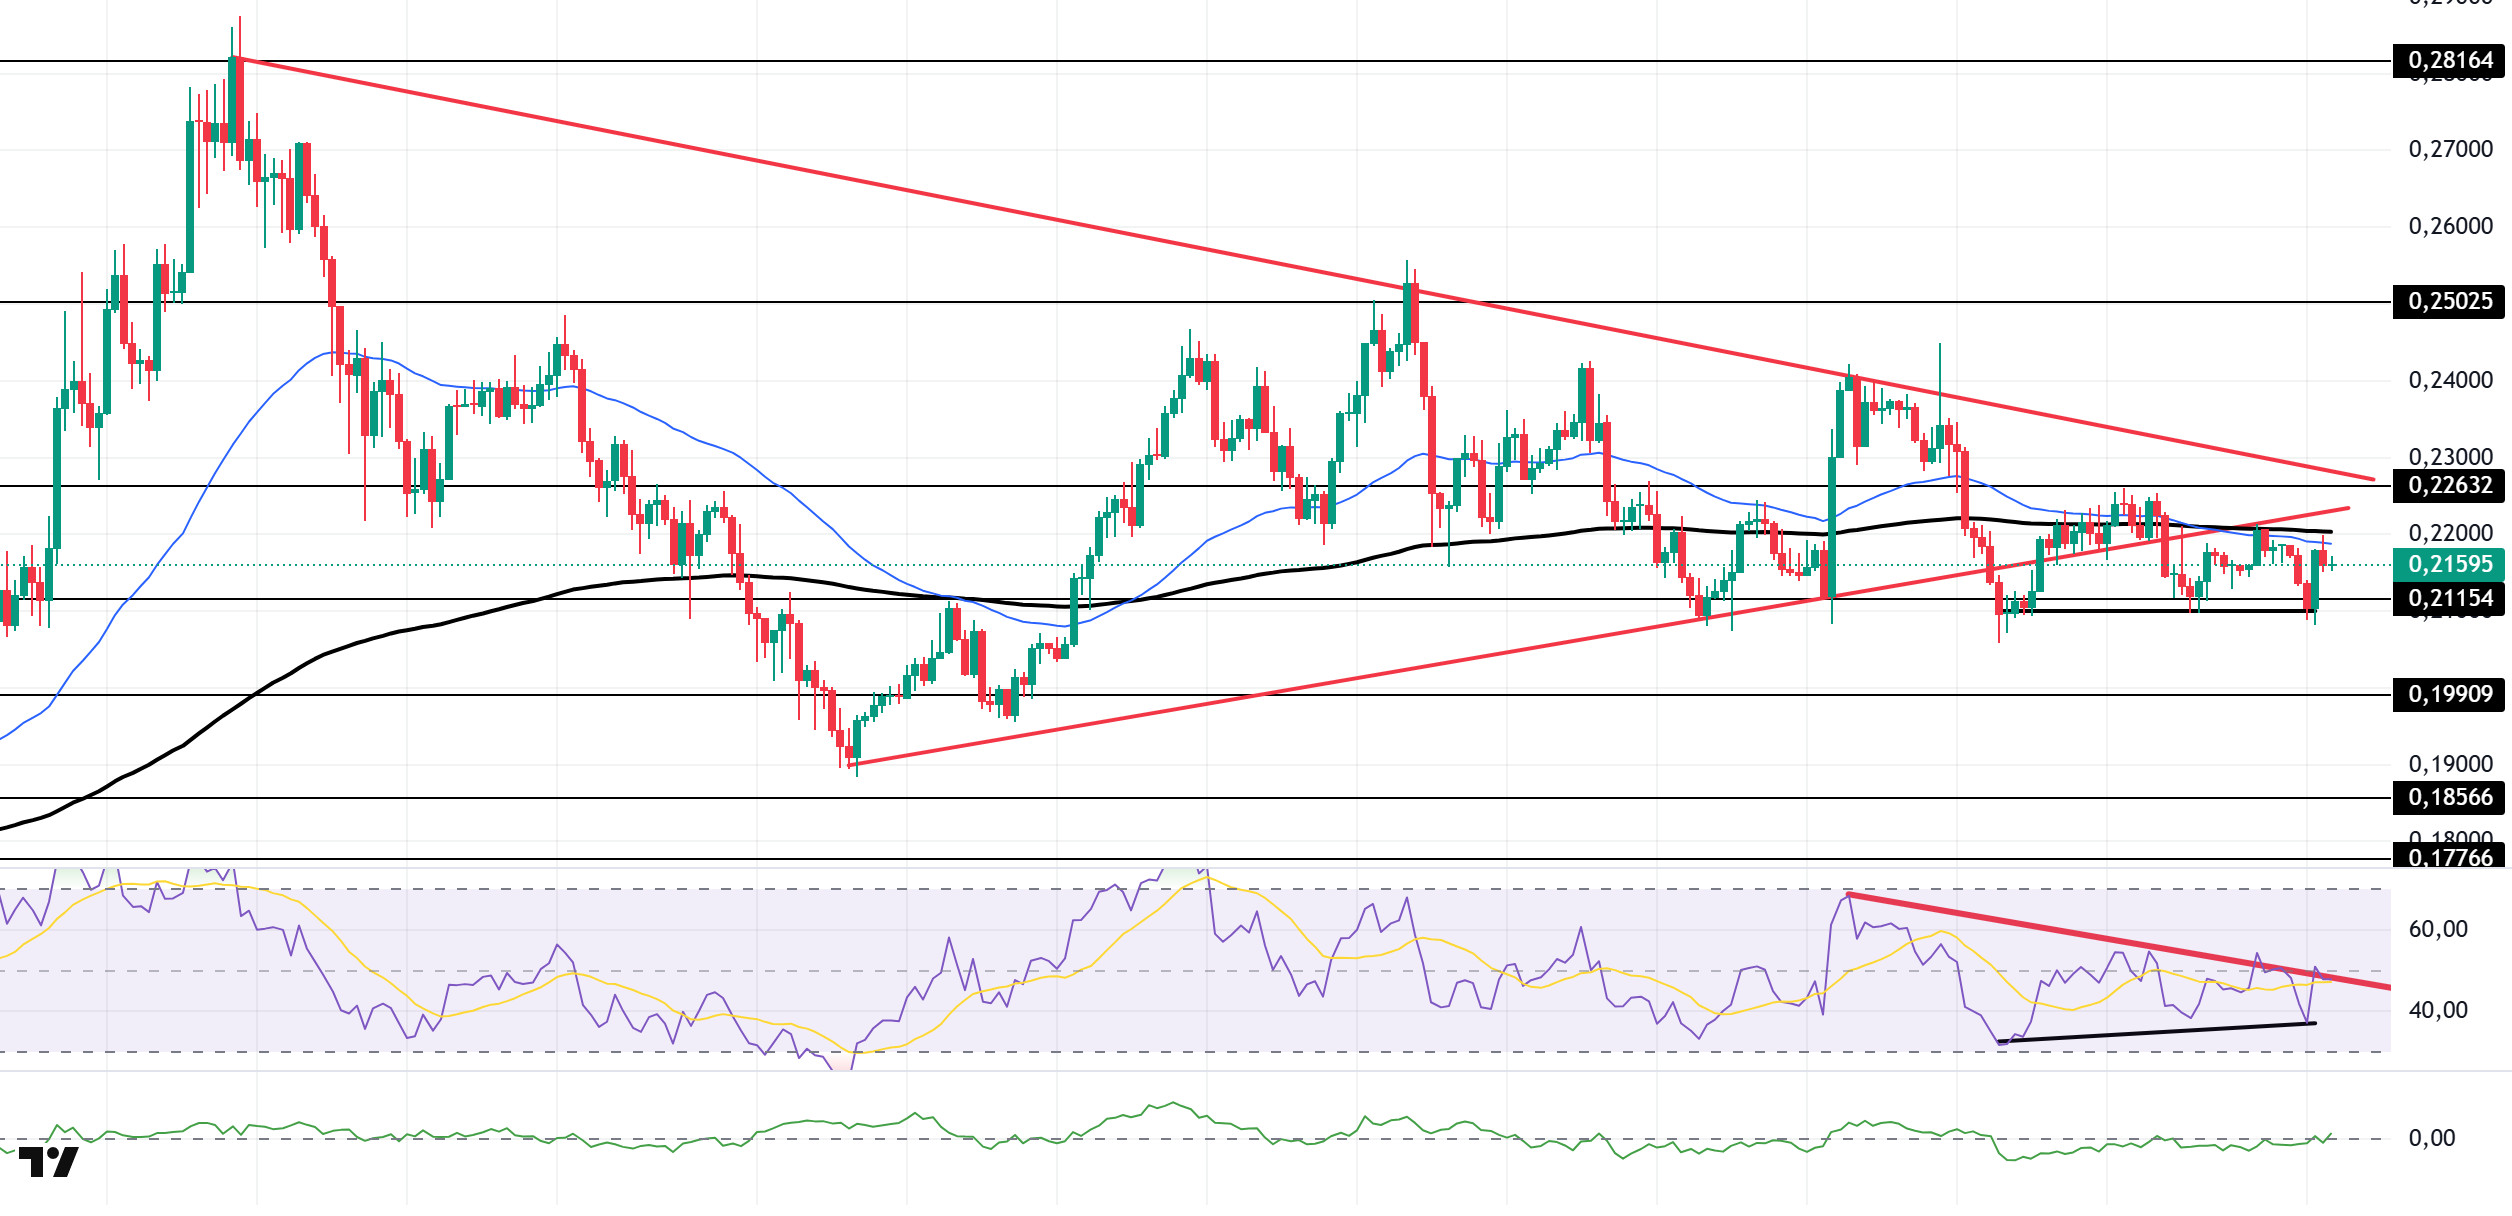
The DOGE price traded sideways during the day. The asset continued to trade below the base level of the symmetrical triangle formation that began on August 2. Currently facing resistance from the 50 EMA (Exponential Moving Average – Blue Line) and 200 EMA (Black Line) moving averages, the price could test the strong support level of $0.21154 if it experiences a pullback. If the uptrend begins, the $0.22632 level should be monitored.
On the 4-hour chart, the 50 EMA (Blue Line) has started to fall below the 200 EMA (Black Line). This indicates that a medium-term downward trend has begun. The price being below both moving averages also shows that the asset is in a downward trend in the short term. The Chaikin Money Flow (CMF-20) remained at a neutral level. Additionally, a decrease in money inflows could push the CMF into negative territory. The Relative Strength Index (RSI-14) continues to be in negative territory. It also remains below the downward trend that began on August 22. This indicates that selling pressure continues. Furthermore, bullish divergence could bring an uptrend. In the event of an uptrend driven by political developments, macroeconomic data, or positive news flow in the DOGE ecosystem, the $0.22632 level stands out as a strong resistance zone. Conversely, in the event of negative news flow, the $0.19909 level could be triggered. A decline to these levels could increase momentum and potentially initiate a new upward wave.
Supports: 0.21154 – 0.19909 – 0.18566
Resistances: 0.22632 – 0.25025 – 0.28164
TRX/USDT
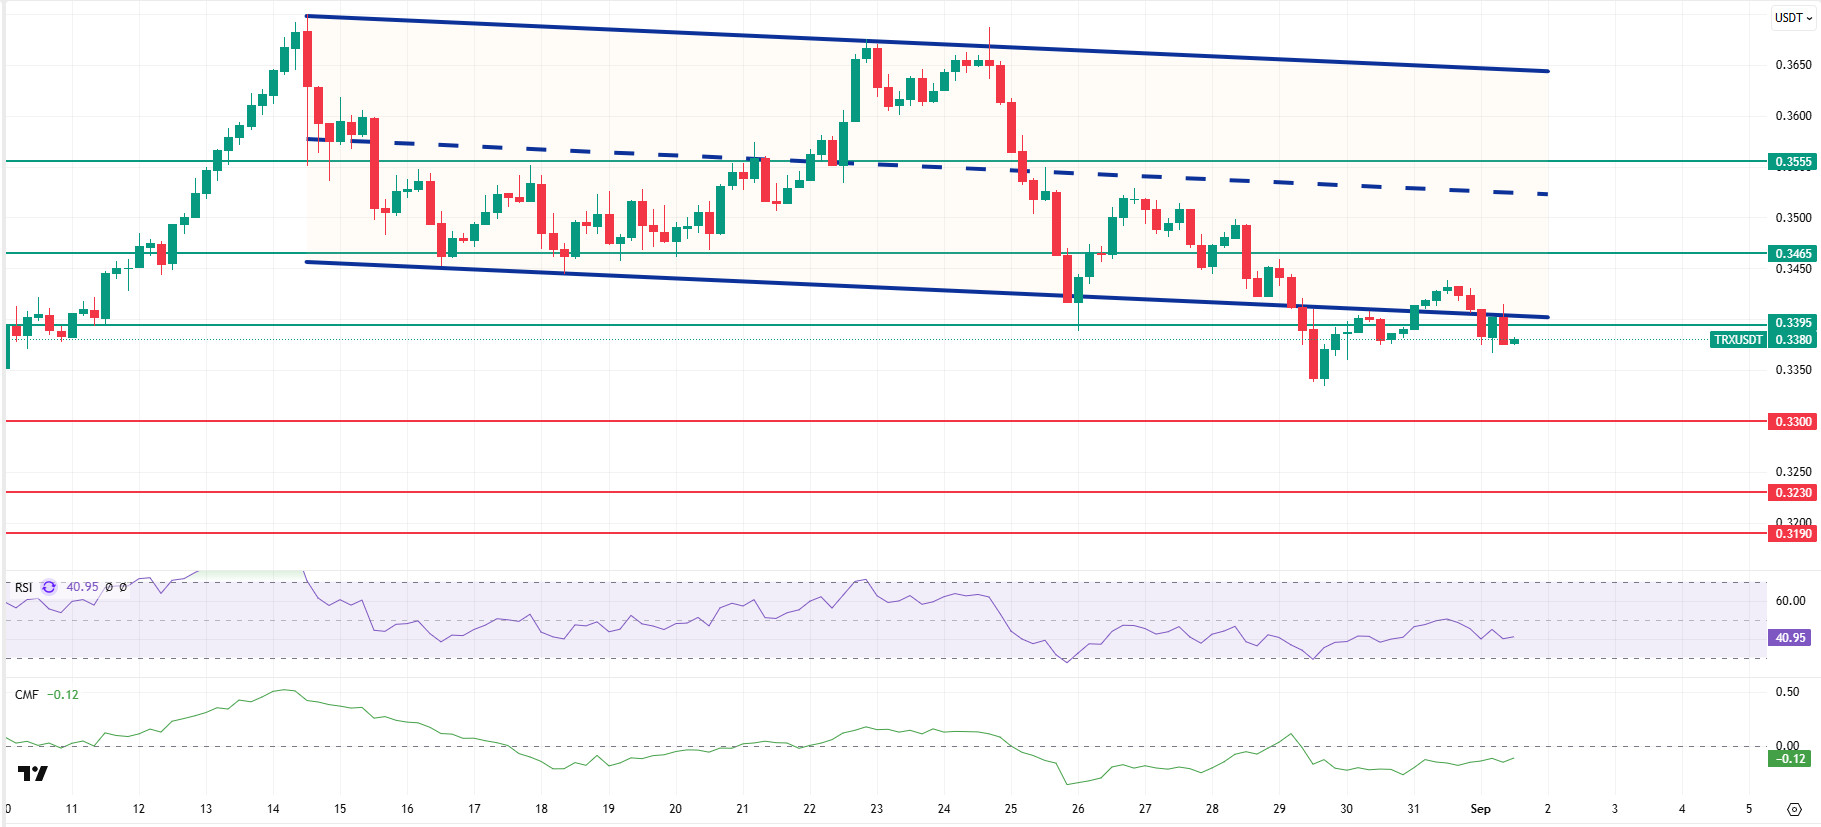
As mentioned in this morning’s analysis, TRX failed to stay above the 0.3395 support level after the rally and is currently trading at 0.3380 under selling pressure from the lower band of the bearish channel. Currently just below the bearish channel, TRX is hovering near the 0.3395 resistance level on the 4-hour chart. The Relative Strength Index (RSI) value of 40 indicates that it is in the sell zone. In addition, the Chaikin Money Flow (CMF) indicator continues to remain below zero with a value of -0.12, indicating that money outflows are continuing. The CMF remaining in negative territory can be considered an indicator that the decline may continue.
In light of all these indicators, TRX may rise slightly in the second half of the day and move towards the bearish channel. It may then test the 0.3395 resistance level. If it closes above this resistance level, it may continue to rise and then move towards the middle band of the channel, testing the 0.3465 resistance level. If it fails to close above the 0.3395 resistance level, it may move away from the channel downward due to the continuation of capital outflows that may occur with the CMF remaining in negative territory. As a result, it may test the 0.3300 and 0.3230 support levels in sequence.
On the 4-hour chart, 0.3190 is an important support level, and as long as it remains above this level, the upward momentum is expected to continue. If this support is broken, selling pressure may increase.
Supports: 0.3300 – 0.3230 – 0.3190
Resistances 0.3395 – 0.3465 – 0.3555
LTC/USDT
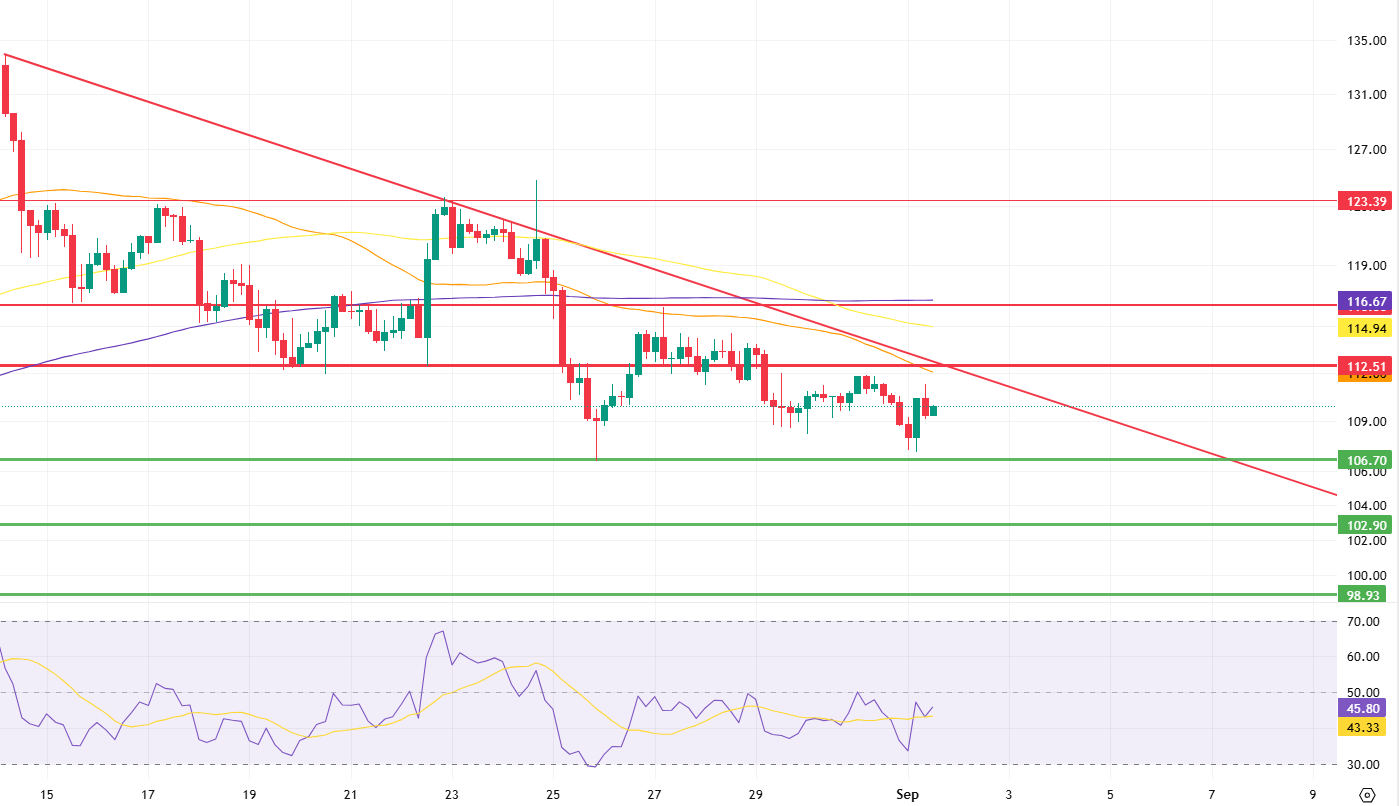
Currently trading at 109.86, LTC is showing a positive outlook, rising 0.92% against USDT and 0.30% against BTC since the start of the day. However, the current picture shows that the classic short-term downward trend is continuing. The price continues to move steadily within a relatively wide band in the horizontal support-resistance range.
Firstly, the 112.51 level is the most important threshold for the start of an uptrend, as it is close to both the falling trend line and the 50-period moving average (orange line); sustained closes above this area would be the first confirmation that buyers are gaining strength. If resistance is broken with high volume, the short-term target will be 116.36, and this area will be a critical test for the sustainability of the uptrend; the price reaction here could determine the direction of the trend. If a strong hold is achieved above this level, the next focus will be the 123.39 level, and this area will stand out as a zone where buyer intensity may weaken and selling pressure may re-emerge.
If the 106.70 level is broken downwards, the probability of selling pressure gradually increasing and pulling the price back to the next support point at 102.90 will rise. The most critical factor to consider at this point will be the direction of the reaction from the 102.90 level; the reaction will play an important role in determining the short-term market trend. However, if a permanent break occurs below this band, the technical outlook will weaken significantly, and the possibility of selling deepening to the 98.93 level will increase.
Supports: 106.70 – 102.90 – 98.93
Resistances: 112.51 – 116.36 – 123.39
SUI/USDT
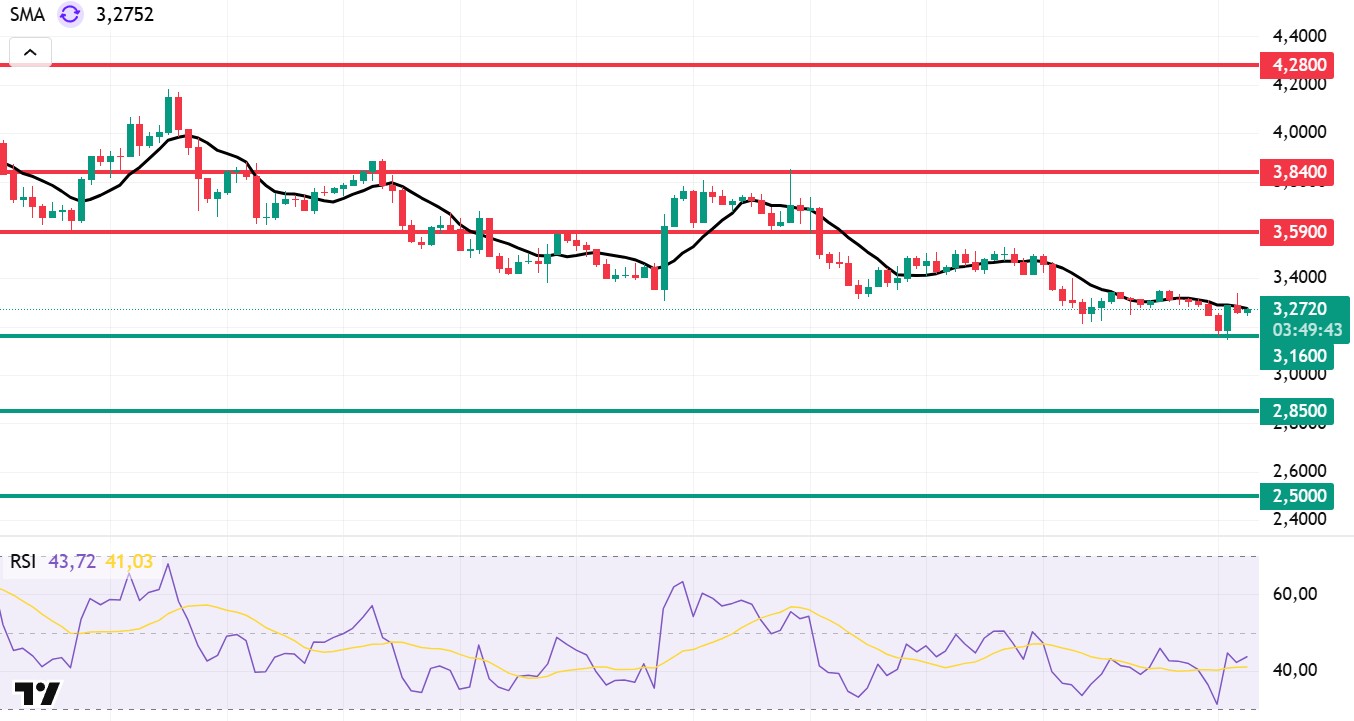
Looking at Sui’s technical outlook, we see that the price has declined on a weekly basis to around $3.27, influenced by fundamental developments. The Relative Strength Index (RSI) is currently in the range of 43.72 – 41.03. This range indicates that the market is trading close to the sell zone; however, if the RSI weakens and falls to the 30.00 – 35.00 range, it could signal a potential buying point. If the price moves upward, the resistance levels of $3.59, $3.84, and $4.28 can be monitored. However, if the price falls to new lows, it could indicate that selling pressure is intensifying. In this case, the $3.16 and $2.85 levels stand out as strong support zones. In particular, in the event of a sharp sell-off, a pullback to $2.50 appears technically possible.
According to Simple Moving Averages (SMA) data, Sui’s average price is currently at the $3.27 level. The price remaining below this level indicates that the current downtrend could technically continue. The downward trend of the SMA also supports this situation.
Support levels: 2.50 – 2.85 – 3.16
Resistances: 3.59 – 3.84 – 4.28
Legal Notice
The investment information, comments, and recommendations contained herein do not constitute investment advice. Investment advisory services are provided individually by authorized institutions taking into account the risk and return preferences of individuals. The comments and recommendations contained herein are of a general nature. These recommendations may not be suitable for your financial situation and risk and return preferences. Therefore, making an investment decision based solely on the information contained herein may not produce results in line with your expectations.


