
Technical Analysis
BTC/USDT
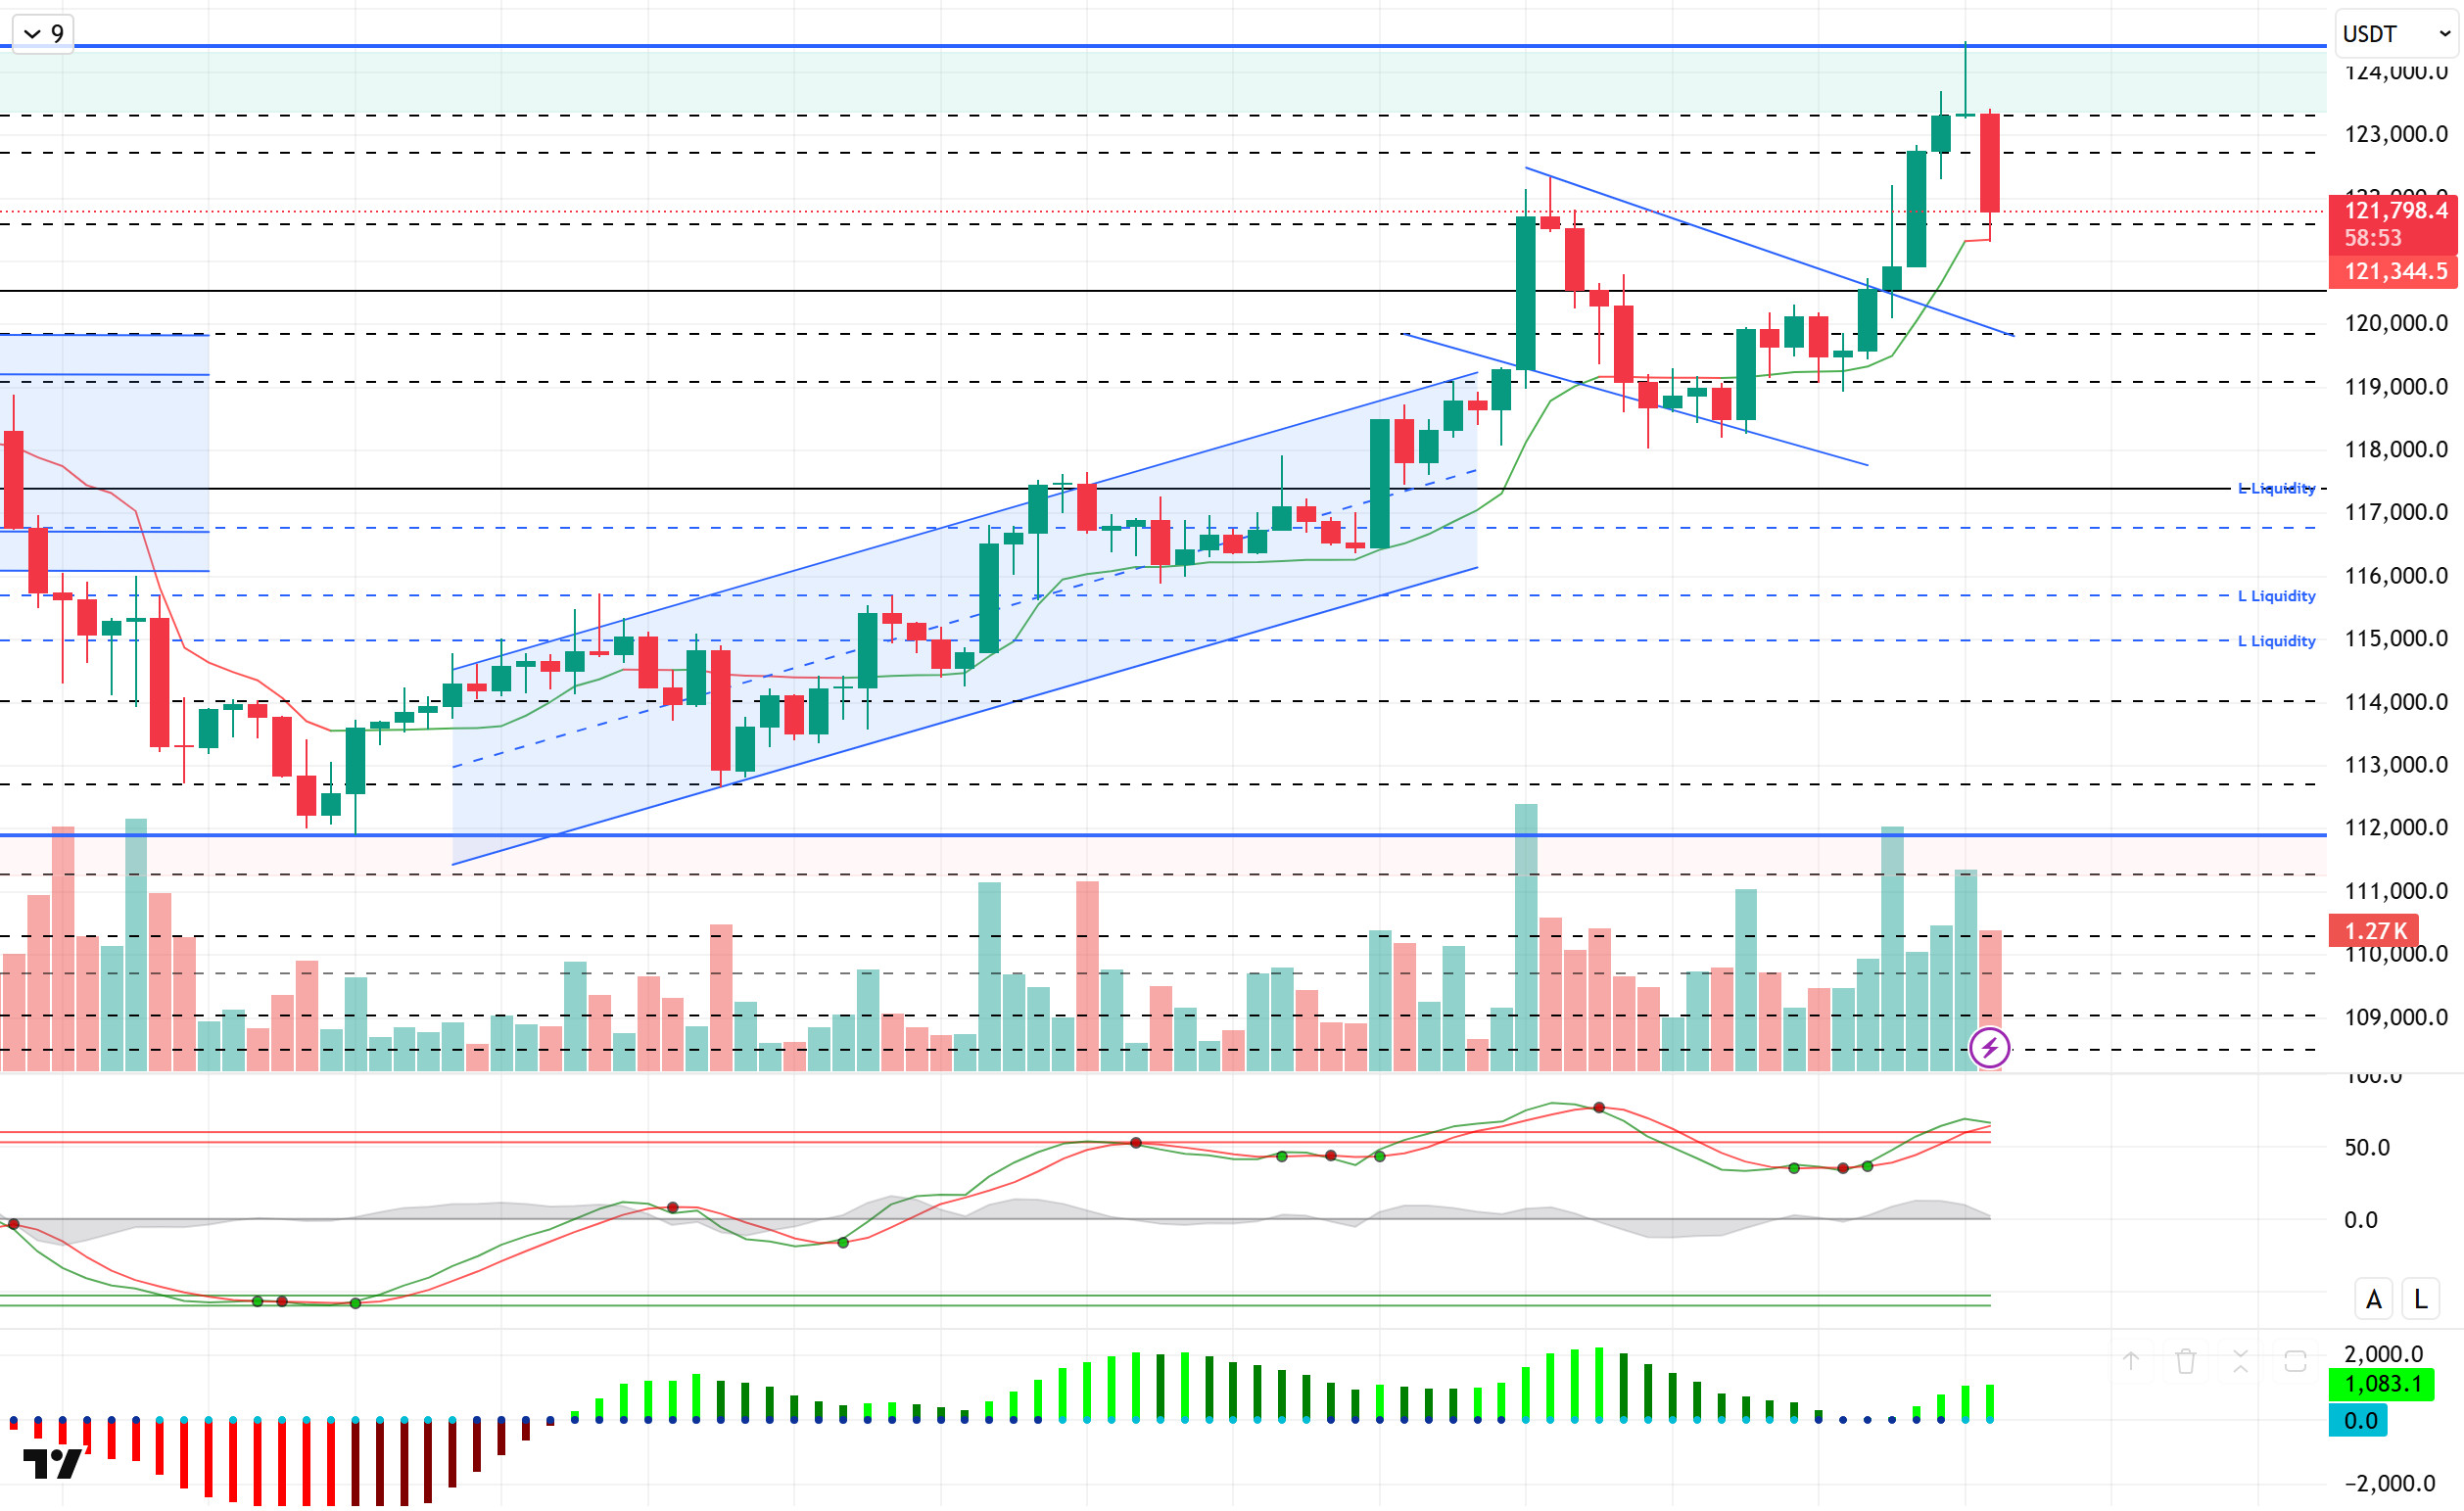
Bitcoin surged by 3.58% to briefly surpass $124,000, reaching an all-time high, with its market capitalization climbing to $2.457 trillion. U.S. Treasury Secretary Bessent reiterated that interest rates should be cut by 150–175 basis points, stating that there is a high likelihood of a 50-basis-point cut in September. The Trump administration has postponed the announcement of tariff decisions on pharmaceuticals and certain sectors by several weeks. China’s July credit data exceeded expectations, with M2 money supply increasing by 8.8% year-on-year. President Trump stated that he had reached an agreement with European leaders on Ukraine and that Putin would face serious consequences if he did not accept a ceasefire by the end of the week. Today’s data set includes US jobless claims and PPI data, while Fed member Barkin will be closely watched.
Looking at the technical picture, compared to the previous analysis, BTC regained momentum, broke the minor downtrend line, and reached a new ATH level of 124,400 with closes above 120,000. With low momentum in this region and facing selling pressure, the price fell back to 121,300. At the time of writing, it continues to trade at the 121,800 level in a bearish manner.
Technical indicators show that the Wave Trend oscillator (WT) is preparing for a trend reversal in the overbought zone, while the Squeeze Momentum (SM) indicator has regained momentum and the histogram continues to hold in the positive zone. The Kaufman moving average is currently acting as support at the 121,300 level below the price.
Looking at liquidity data, short-term sell positions are being liquidated at the 121,000 and 123,000 levels, while buy transactions continue to show aggressive concentration at the 117,000 and 115,000 levels.
In summary, in the key developments section, calls for interest rate cuts continue alongside measures targeting tariffs. Whether Trump’s calls for a ceasefire with Putin will be heeded is the key development to watch from a market perspective. The technical structure points to a trend reversal at the saturation point, while liquidity data shows that 115,000 is still an important accumulation zone. After the price moved to the 124,000 band, selling pressure increased, supported by technical and liquidity factors. However, positive developments on the fundamental side continue to be a driving factor for upward attacks. In this context, the levels to watch for a continuation of upward momentum are 122,000 followed by 123,300, which could serve as key levels for regaining momentum and pushing the price above the ATH level. In case of a pullback, 121,300 acts as an intermediate support level, while a break below this level would bring 120,000 into focus as a new reference area.
Support levels: 121,500 – 120,000 – 119,000
Resistance levels: 122,000 – 123,300 – 124,400
ETH/USDT
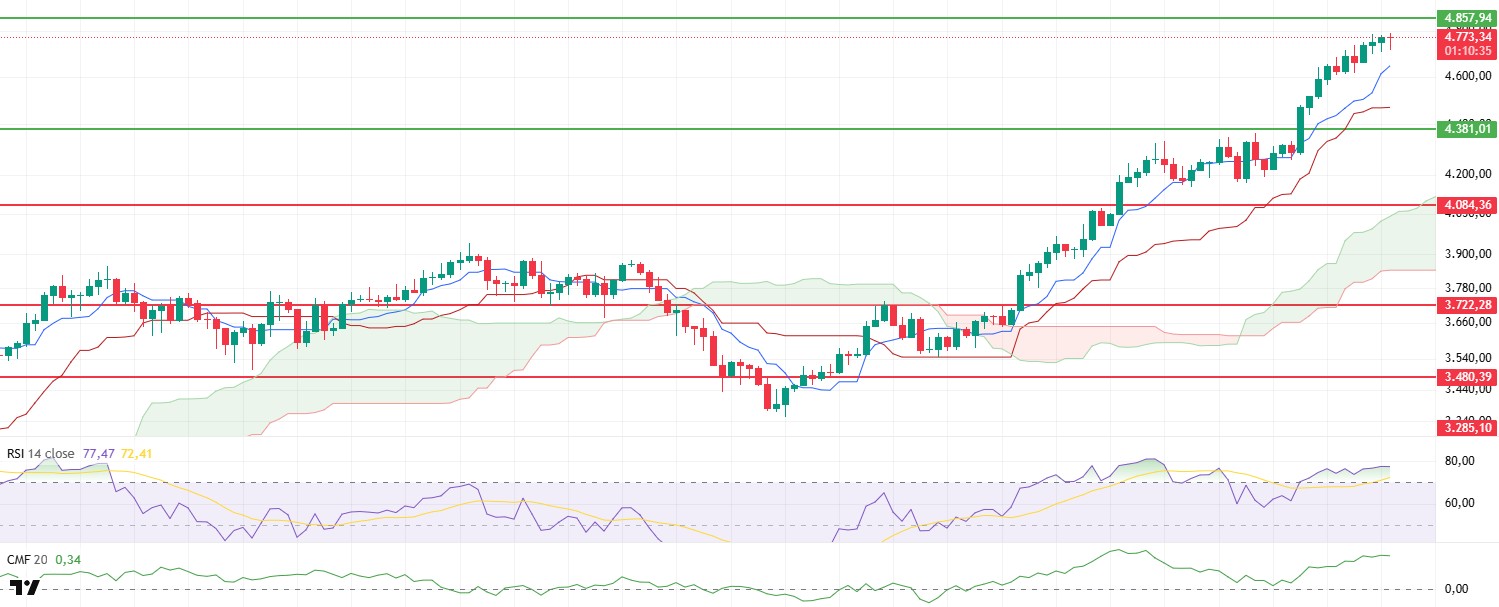
ETH initiated a strong rebound yesterday evening by maintaining its intermediate support level at $4,600. Buying activity in this region enabled the price to settle above the $4,700 level and continue its upward trend toward the all-time high (ATH) of $4,868.
On-chain data shows that open interest has reached 34.5 billion dollars, while the funding rate has risen to 0.0296. These figures indicate a significant increase in leveraged long positions and a notable rise in investors’ risk appetite.
On the liquidity side, the Chaikin Money Flow (CMF) indicator continues to rise in positive territory. This indicates that capital inflows into the market are strengthening and that buyers remain dominant. Increasing liquidity supports upward price movement while also contributing to limited selling pressure.
In the Ichimoku indicator, the upward movement of the Tenkan and Kijun levels alongside the price, the expansion of the Kumo cloud, and its maintenance of a positive slope reflect a strong trend structure in the technical outlook.
On the momentum side, the Relative Strength Index (RSI) is moving sideways in the overbought zone. This pattern confirms that buying interest remains high, while also indicating that the price is vulnerable to short-term volatility and potential correction risks. In particular, the rise in the funding rate increases the likelihood of sudden liquidation due to the concentration of leveraged positions. In such a scenario, market balance could shift rapidly, leading to sharp price movements.
The overall outlook indicates a strong upward trend supported by technical and on-chain data. There is a possibility that the price could reach the ATH level of $4,868 during the day. However, if the $4,600 support level is broken, selling pressure could increase along with the unwinding of leveraged positions, causing the price to retreat to the $4,381 range.
Support levels: 4,550 – 4,381 – 4,084
Resistance levels: 4,857 – 5,000 – 5,350
XRP/USDT
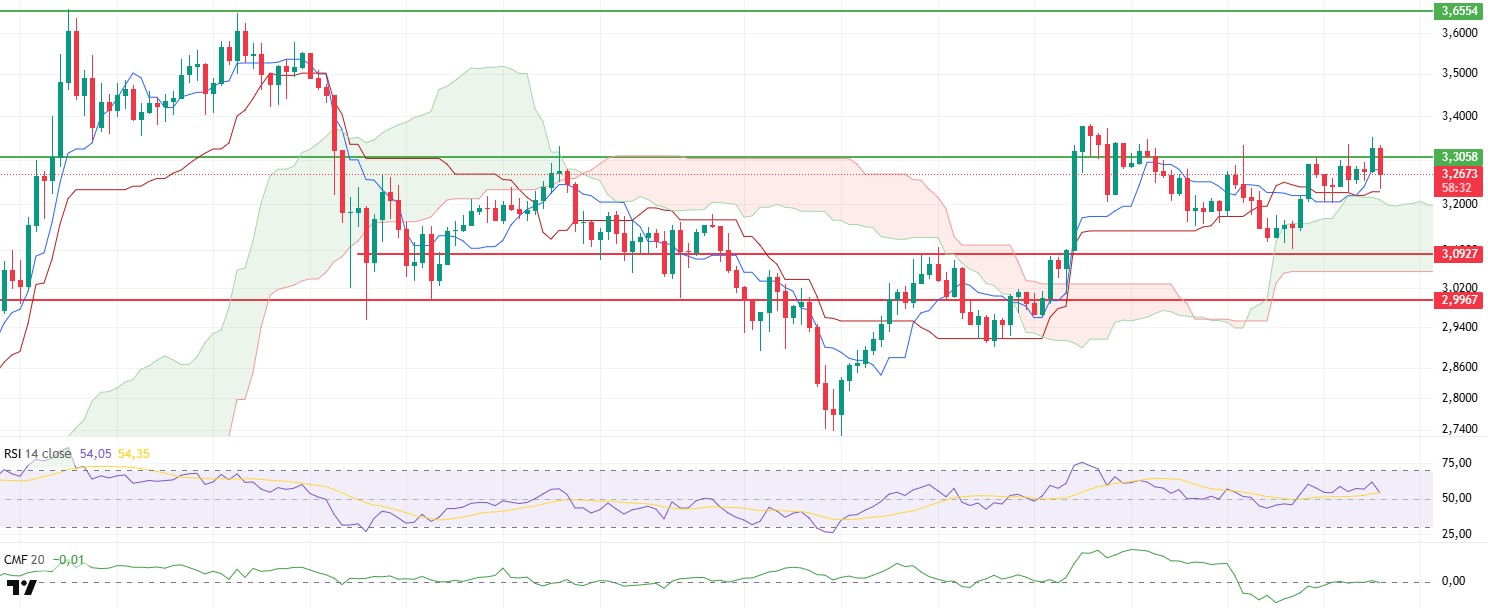
XRP tested the $3.3058 level multiple times yesterday evening but struggled to break above this level due to selling pressure on each attempt. The price’s inability to achieve a sustained breakout in this region indicates that market participants lack strong buying interest and that sufficient volume has not yet formed to overcome the current resistance level. In particular, the weakness in trading volume in the short term is limiting upward momentum.
The Chaikin Money Flow (CMF) indicator, which measures liquidity flow, continues to move horizontally near the zero line. This indicates that the liquidity entering and exiting the market is balanced, with no net capital inflow or outflow yet forming. The Relative Strength Index (RSI) indicator also moving sideways confirms that buyers and sellers are currently in balance, while low volume data sets the stage for the price to continue its range-bound movement within the current band.
When examining the Ichimoku indicator, the Tenkan level crossing above the Kijun level has produced a short-term positive signal. However, for this signal to turn into a sustained upward trend, the price must break through the $3.3058 level with strong volume. If this occurs, more aggressive buying could open the door to sharper increases.
The overall outlook indicates a high probability that the price will retest the $3.3058 level during the day. However, if the price fails to remain above this level, increased selling pressure could cause the price to retreat toward the upper band of the Ichimoku cloud, leading to short-term negative price movements. The current chart indicates a critical threshold where the direction of the breakout will be decisive.
Supports: 3.0927 – 2.9967 – 2.7355
Resistances: 3.3058 – 3.6554 – 4.0055
SOL/USDT
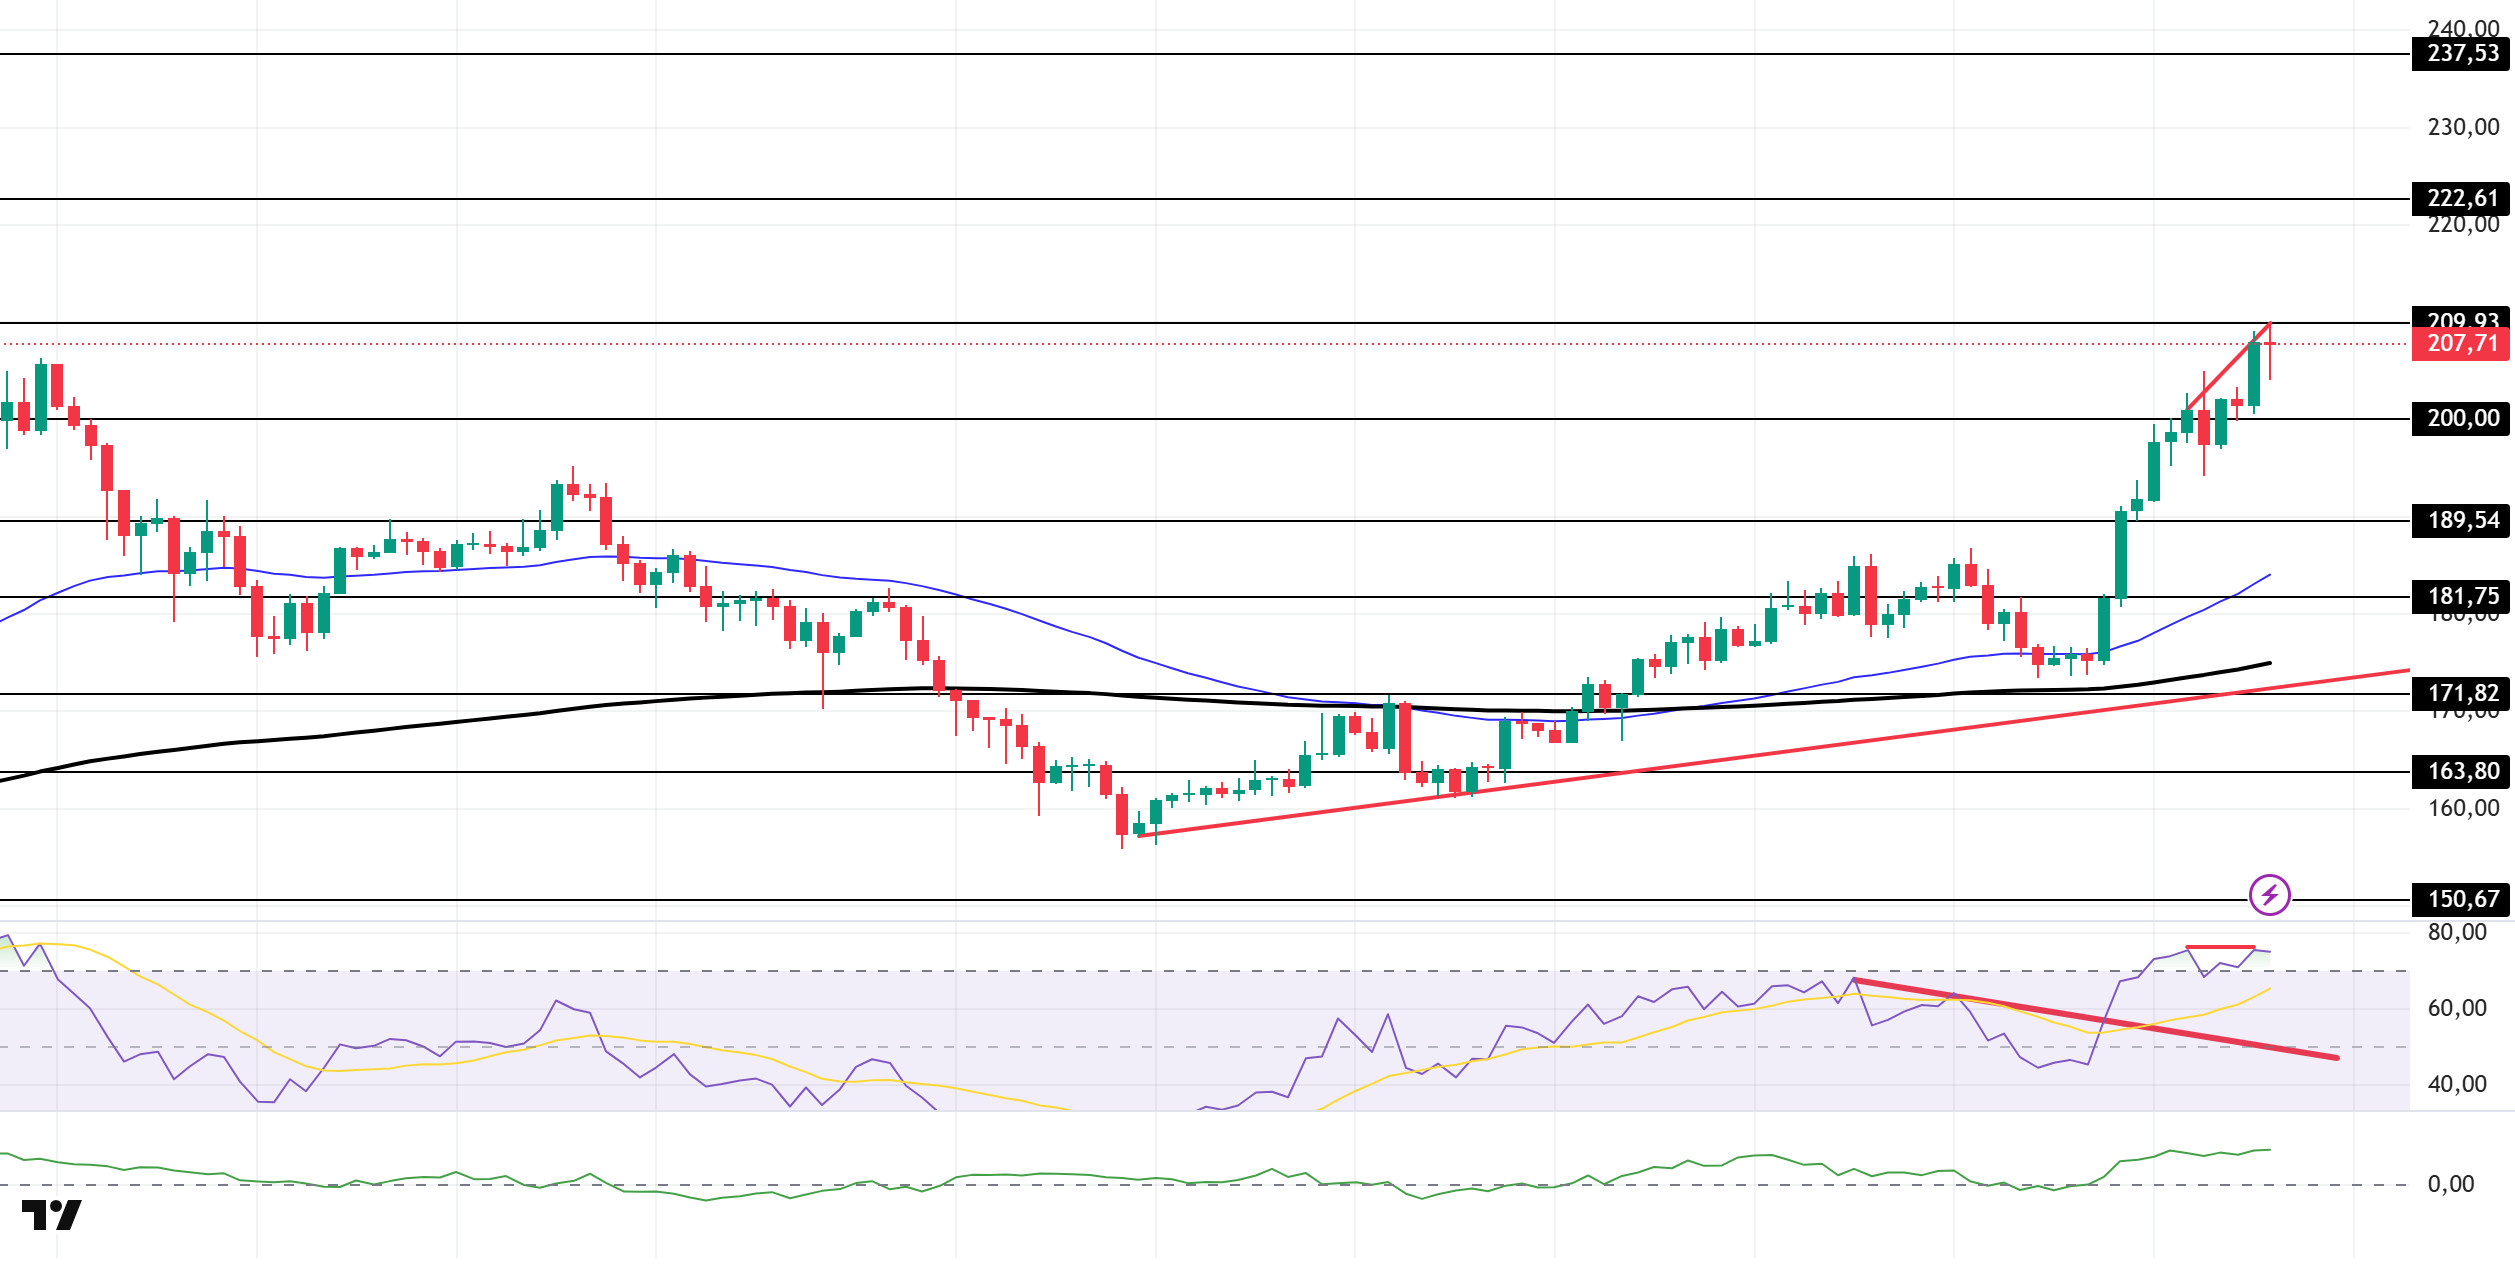
The SEC has approved Invesco Galaxy Spot Solana ETF’s application.
SOL price continues to rise. The asset has remained above the upward trend line that began on August 2, while also managing to stay above the strong psychological resistance level of $200.00. As of now, it is testing the 209.93 dollar level as resistance. If the upward trend continues, the 222.61 dollar level should be monitored. In the event of a pullback, it may test the 200.00 dollar level.
On the 4-hour chart, the 50 EMA (Blue Line) remains above the 200 EMA (Black Line). This indicates that the upward trend may continue in the medium term. Additionally, the price being above both moving averages suggests that the market is in an upward trend in the short term. The Chaikin Money Flow (CMF-20) is in the upper levels of the positive zone. Additionally, an increase in money inflows could push the CMF to the upper levels of the positive zone. The Relative Strength Index (RSI-14) remains above the downward trend that began on August 10. This indicates that buying pressure is continuing. However, the indicator being in the overbought zone could lead to profit-taking. On the other hand, there is a bearish divergence. If there is an upward movement due to macroeconomic data or positive news related to the Solana ecosystem, the $222.61 level emerges as a strong resistance point. If this level is broken to the upside, the upward trend is expected to continue. In case of pullbacks due to developments in the opposite direction or profit-taking, the $200.00 level could be tested. A decline to these support levels could see an increase in buying momentum, presenting a potential opportunity for an upward move.
Support levels: 200.00 – 189.54 – 181.75
Resistance levels: 209.93 – 222.61 – 237.53
DOGE/USDT
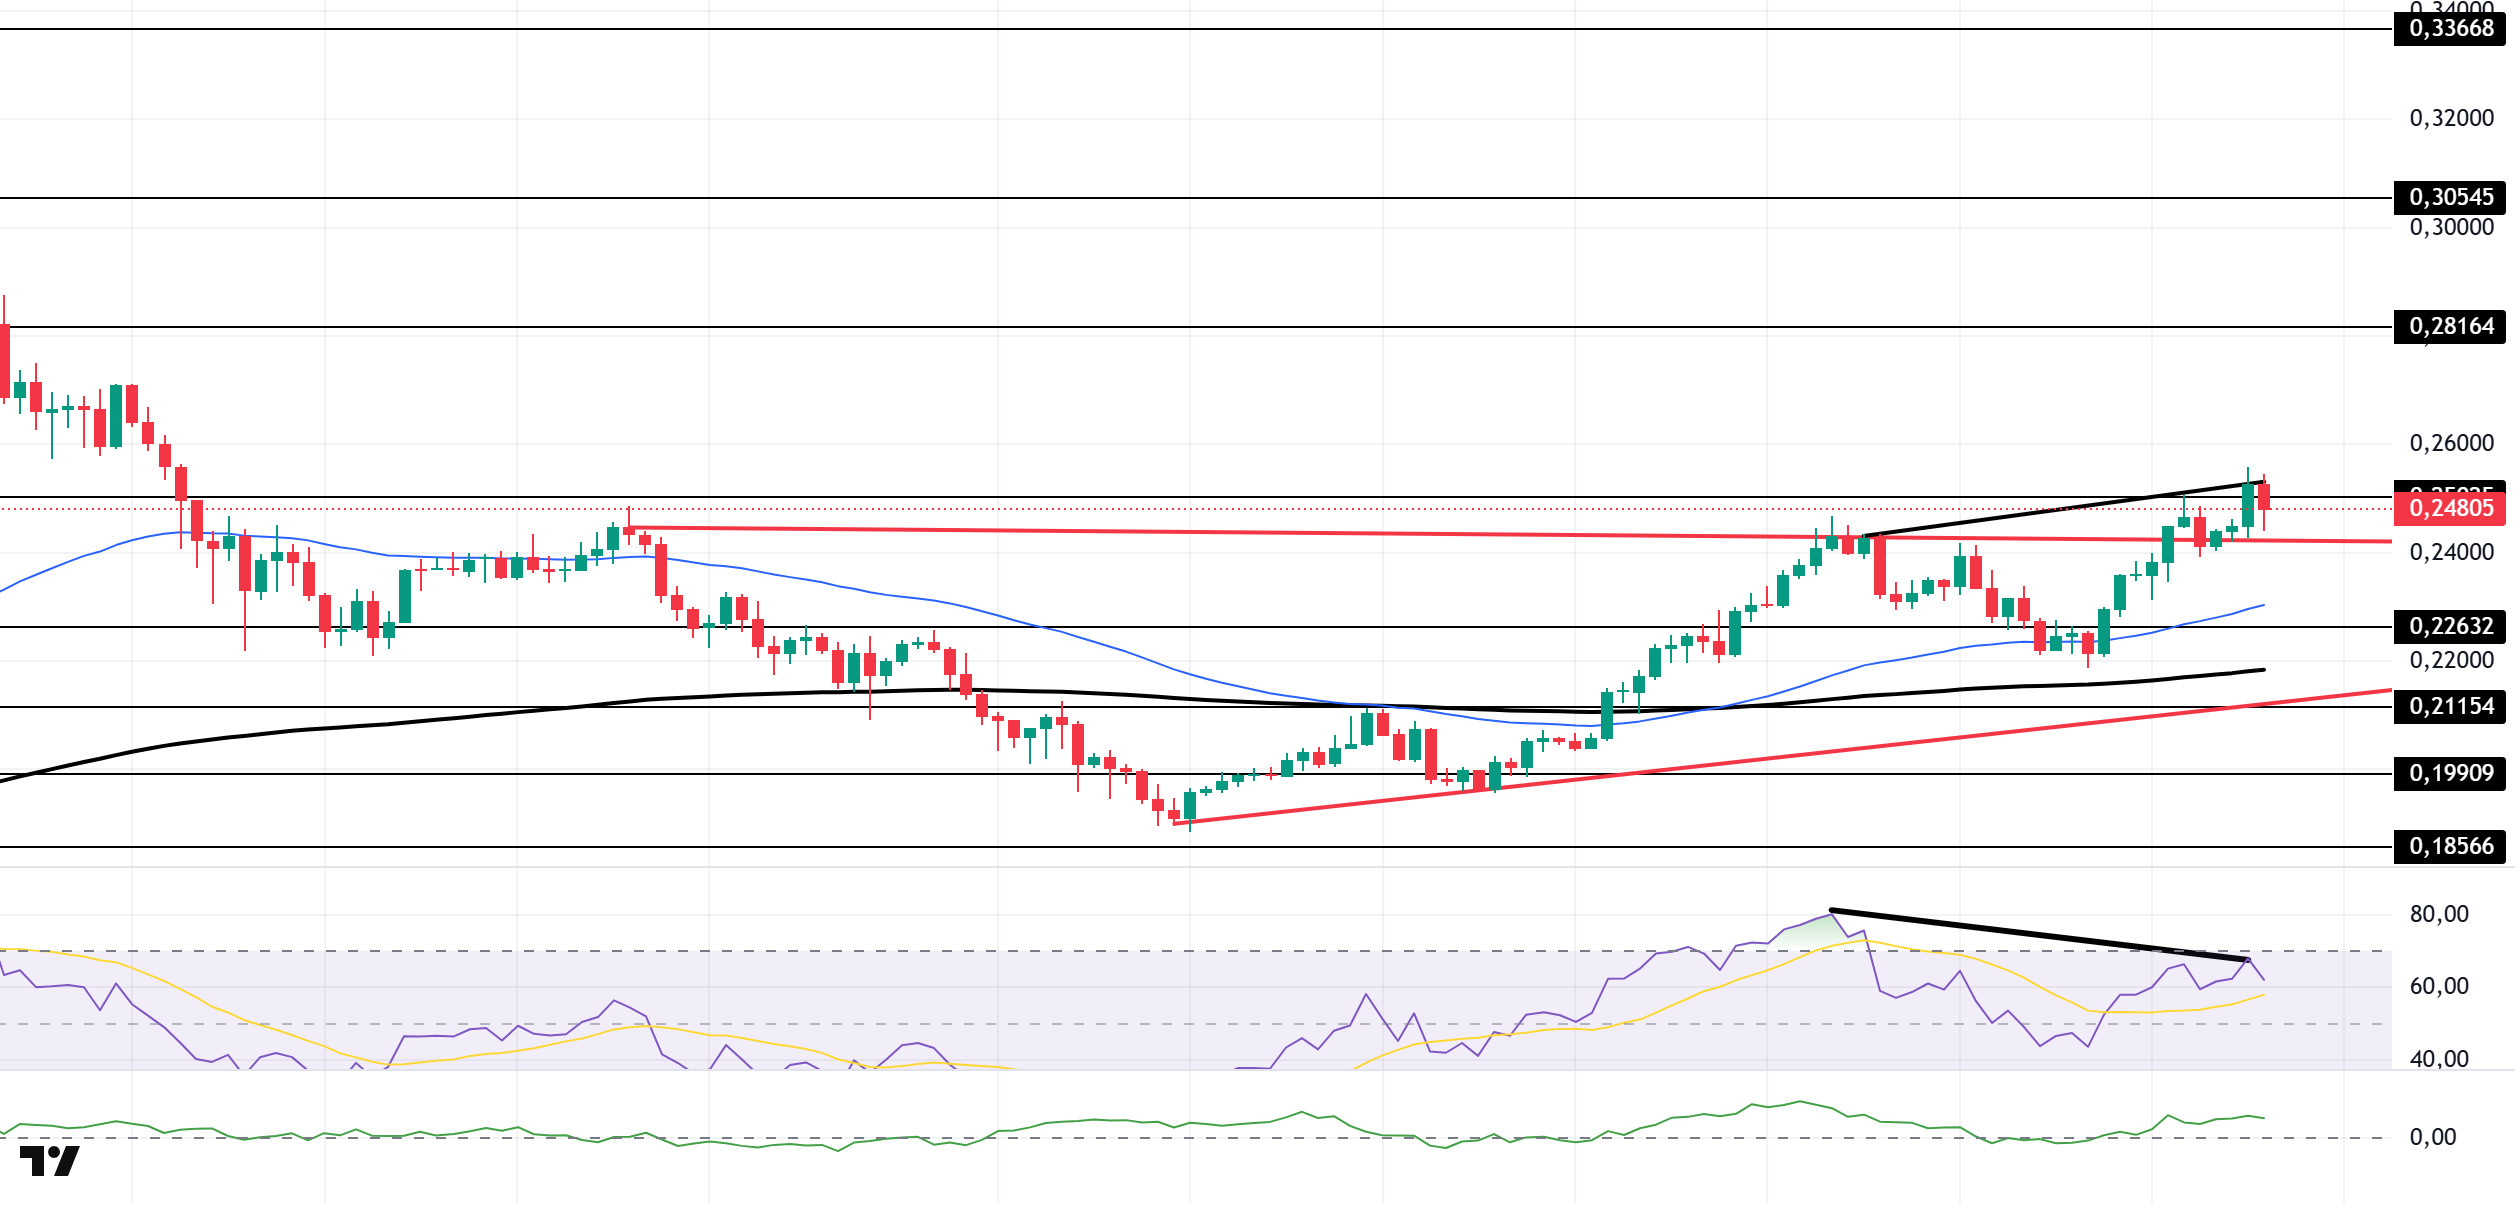
The DOGE price showed a slight increase. The asset broke the ceiling level of the symmetrical triangle formation that began on August 2 and then tested the ceiling level of the symmetrical triangle formation as support and continued its acceleration. As of now, it is testing the 0.25025 dollar level as support. If the upward trend continues, the 0.28164 dollar level can be monitored. In case of a pullback, the 50 EMA (Blue Line) should be monitored.
On the 4-hour chart, the 50 EMA (blue line) remains above the 200 EMA (black line). This indicates that the asset is in an upward trend in the medium term. The price being above both moving averages also indicates that the asset is in an upward phase in the short term. The Chaikin Money Flow (CMF-20) continues to accelerate in the positive zone. Additionally, positive cash inflows could push the CMF to higher levels in the positive zone. The Relative Strength Index (RSI-14) is in the positive zone. At the same time, a negative divergence could lead to a decline. In the event of an upward movement driven by political developments, macroeconomic data, or positive news flow within the DOGE ecosystem, the $0.28164 level emerges as a strong resistance zone. In the opposite scenario or in the event of negative news flow, the 0.22632 dollar level could be triggered. A decline to these levels could increase momentum and potentially initiate a new upward wave.
Support levels: 0.25025 – 0.22632 – 0.21154
Resistances: 0.28164 – 0.30545 – 0.33668
SHIB/USDT
A significant increase in whale activity was observed in the Shiba Inu ecosystem today. According to on-chain data, the trading volume of large investors has increased by 188% over the past two days, rising from 1.28 trillion to 3.69 trillion SHIB. Approximately 3.4 billion tokens were withdrawn from exchanges. This situation can be interpreted as a long-term confidence signal, as whales moving tokens off exchanges typically reduces selling pressure.
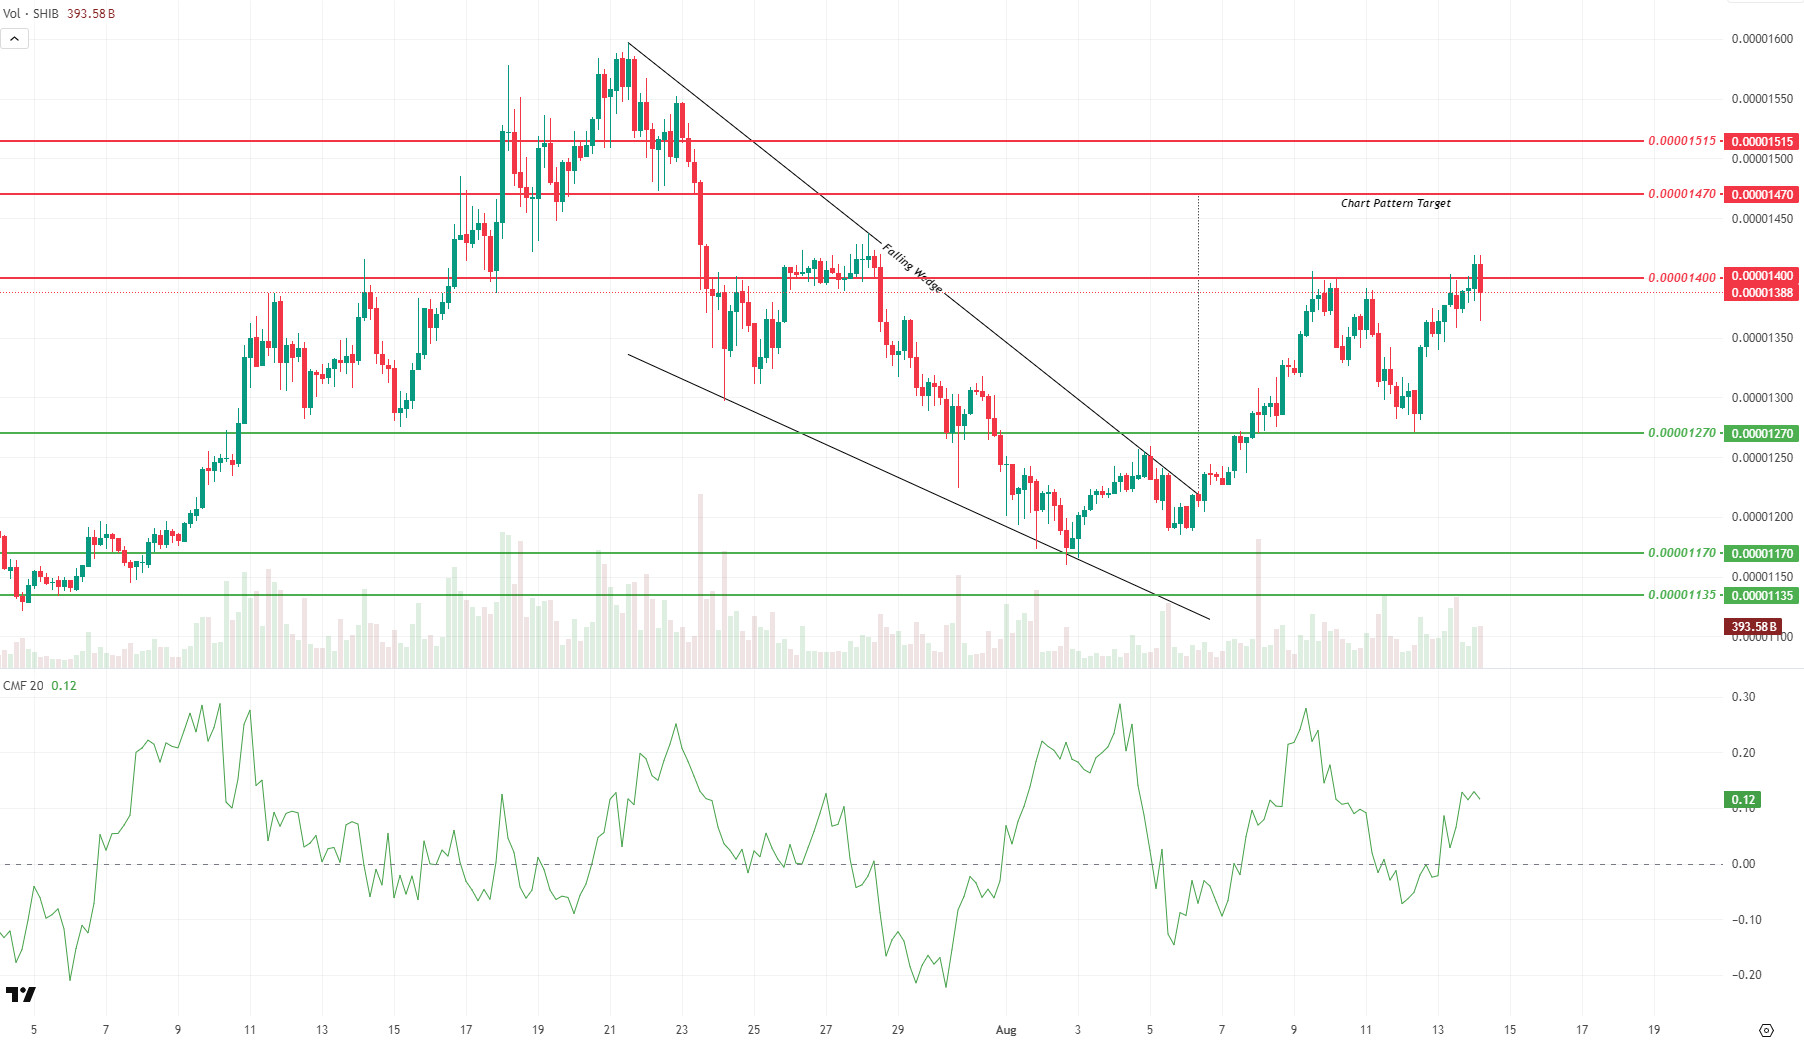
The price recovered from the 0.00001270 dollar support level and is currently holding at the 0.00001400 dollar resistance level. If there are volume-supported four-hour closes above this level, the 0.00001470 dollar level remains the target, and if it extends further, the 0.00001515 dollar level could come into focus. However, if the rejection from this area continues, the 0.00001350 dollar level becomes an intermediate support, and the risk of a decline to the 0.00001320 dollar level increases. The 0.00001270 dollar level remains the main support. Chaikin Money Flow (CMF) is at 0.12 in the positive zone and trending upward, indicating that the buying side is strengthening but that an increase in trading volume is needed to confirm the breakout.
The most important factor supporting the medium-term technical outlook is the breakout of the Falling Wedge formation that formed on July 21 and the fact that the formation target of 0.00001470 dollars remains valid. This formation structurally helps maintain upward momentum, while the market’s reaction at critical resistance levels will determine the short-term trend direction. Additionally, the possibility of a double top forming around the 0.00001400 dollar level should not be overlooked. Therefore, closing levels and volume dynamics should be closely monitored.
Support levels: 0.00001270 – 0.00001170 – 0.00001135
Resistances: 0.00001400 – 0.00001470 – 0.00001515
LINK/USDT
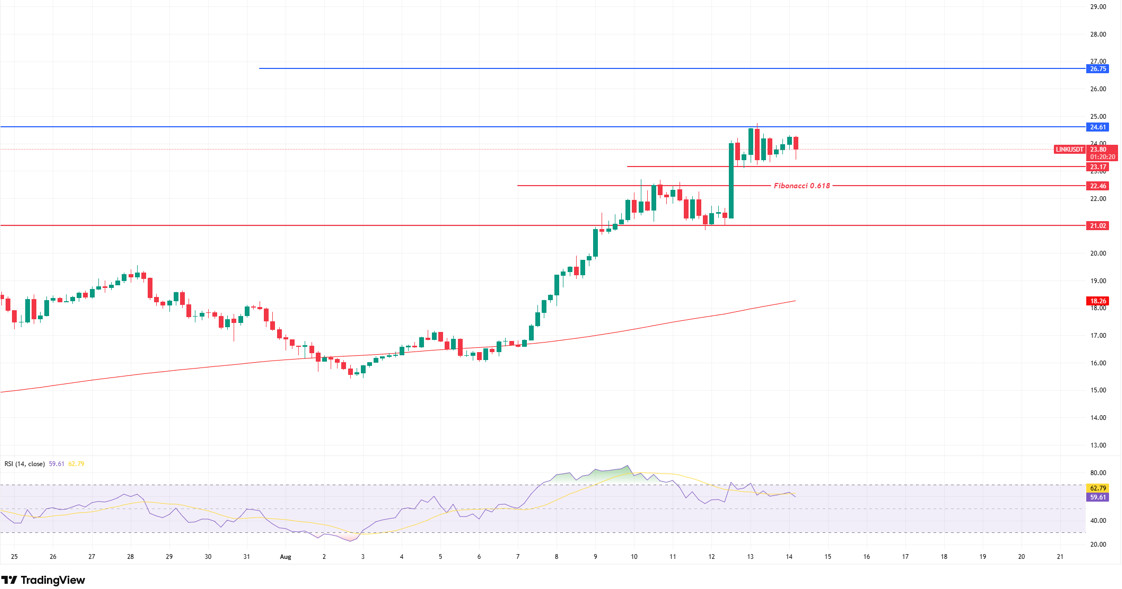
As we mentioned in yesterday’s analysis, LINK is showing strong support at the $23 level. However, looking at the candlestick patterns, we see that sellers are putting intense pressure at the $24.61 level. Although the support line at the $23 level is being defended, it is possible to say that the upward movement is weak.
If the 23-dollar support level is lost, the price is likely to retreat to both the second support zone and the 22.46-dollar level, which is the Fibonacci 0.618 retracement level of the strong uptrend that began on August 13. This region could play a critical role in the price regaining upward momentum. Therefore, expecting pullbacks to 22.46 dollars in the short term is important for risk management. Movements below this level could increase selling pressure and pull the price down to the main support zone at 21 dollars.
In upward movements, the first resistance level is at $24.61. If this region is broken, the second resistance level is at $26.75, and the third resistance level is the target zone of the cup-and-handle formation we mentioned earlier, at the $29 band.
When we look at the Relative Strength Index (RSI) indicator, although it has pulled back from the overbought zone, it remains in positive territory, which could continue to support the price. However, the most critical level to watch in the short term will be the Fibonacci 0.618 retracement level at $22.46.
Support levels: 23.17 – 22.46 – 21.02
Resistances: 24.61 – 26.75 – 28.97
Legal Notice
The investment information, comments, and recommendations contained herein do not constitute investment advice. Investment advisory services are provided individually by authorized institutions taking into account the risk and return preferences of individuals. The comments and recommendations contained herein are of a general nature. These recommendations may not be suitable for your financial situation and risk and return preferences. Therefore, making an investment decision based solely on the information contained herein may not produce results in line with your expectations.


