
Technical Analysis
BTC/USDT
Strategy purchased an additional 4,048 BTC last week, increasing its total holdings to 636,505 BTC and maintaining its position as the company with the largest Bitcoin reserves among publicly traded companies. Cango Inc., which trades on the NYSE, announced that it produced 663.7 BTC in August. With an average daily production of 21.41 BTC, the company’s total Bitcoin holdings reached 5,193.
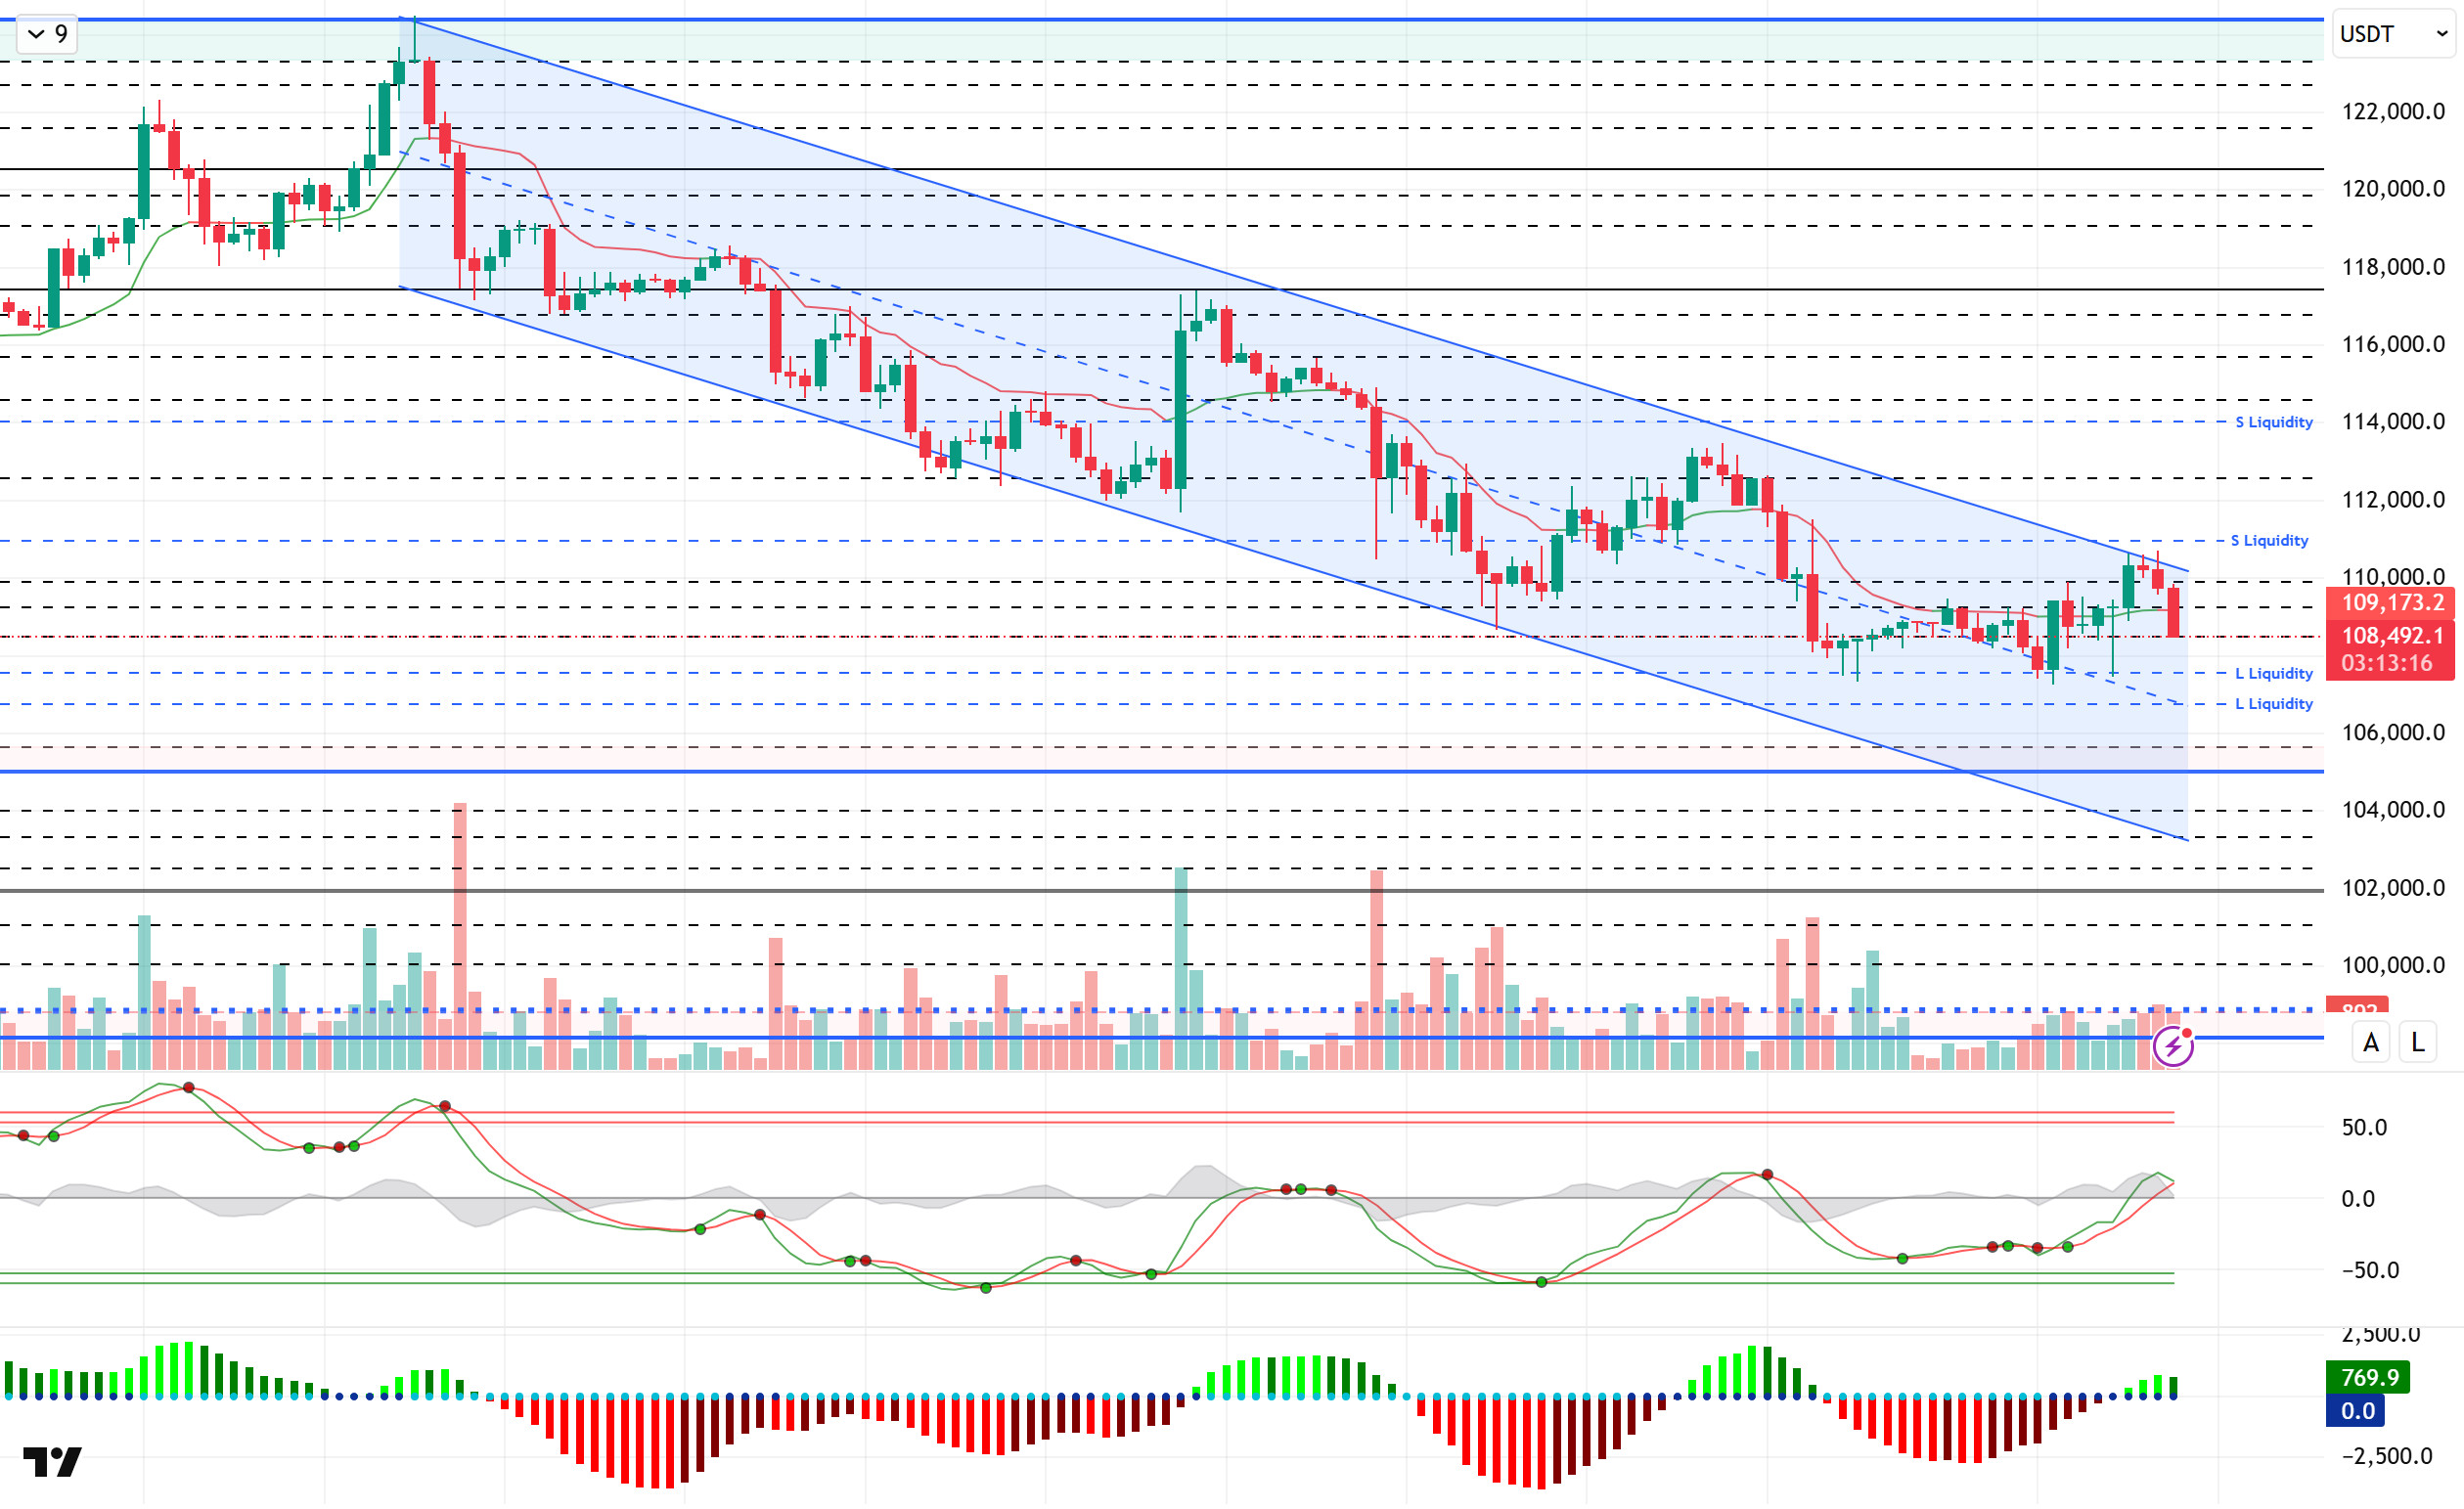
Looking at the technical picture, BTC continued to trade within a downward trend channel. Although it tested the upper line of the channel twice during the day, it failed to stay above it and fell. At the time of writing, it continues to trade at a bearish level of 108,700.
Technical indicators show that the Wave Trend oscillator (WT) is giving a buy signal while weakening in the middle band of the channel, while the Squeeze Momentum (SM) indicator continues to provide momentum support by moving into positive territory on the histogram. The Kaufman moving average is currently above the price, moving at the 109,200 level.
Looking at liquidity data, we see that short-term sell-side transactions are being liquidated intensively within the 109,000 – 110,000 band, while the next sell level is accumulating at the 114,000 level. Buying transactions, on the other hand, are gaining momentum in the 106,500 – 107,500 band.
In summary, the disappearance of the recent optimistic mood due to fundamental developments, along with discussions among Fed members about interest rate cuts and new task allocations, and the continued focus on tariffs, are emerging as factors putting pressure on prices. Technically, although the formation of a suitable ground for a new upward movement has created some recovery, it is noteworthy that the increases remain in the form of liquidity purchases. A shift to an upward trend could be possible with the reemergence of new catalysts in the market creating a driving force on prices. In this context, as the upward movement continues, the 110,000 level stands out as a resistance area, and we will follow the 112,000 level along with momentum. In the event of potential selling pressure, the 107,000 level stands out as a liquidity area.
Supports: 108,500 – 107,400 – 105,000
Resistances: 111,000 – 112,600 – 114,000
ETH/USDT
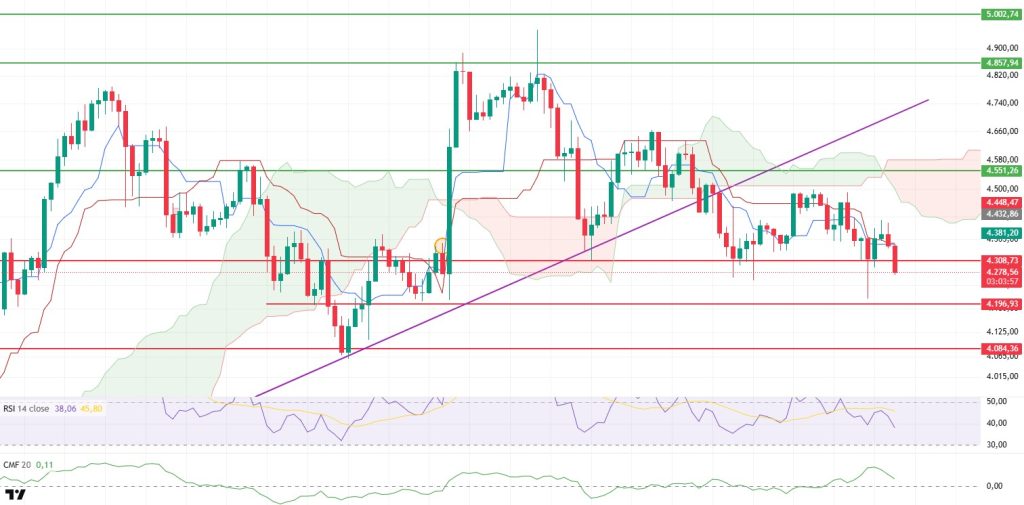
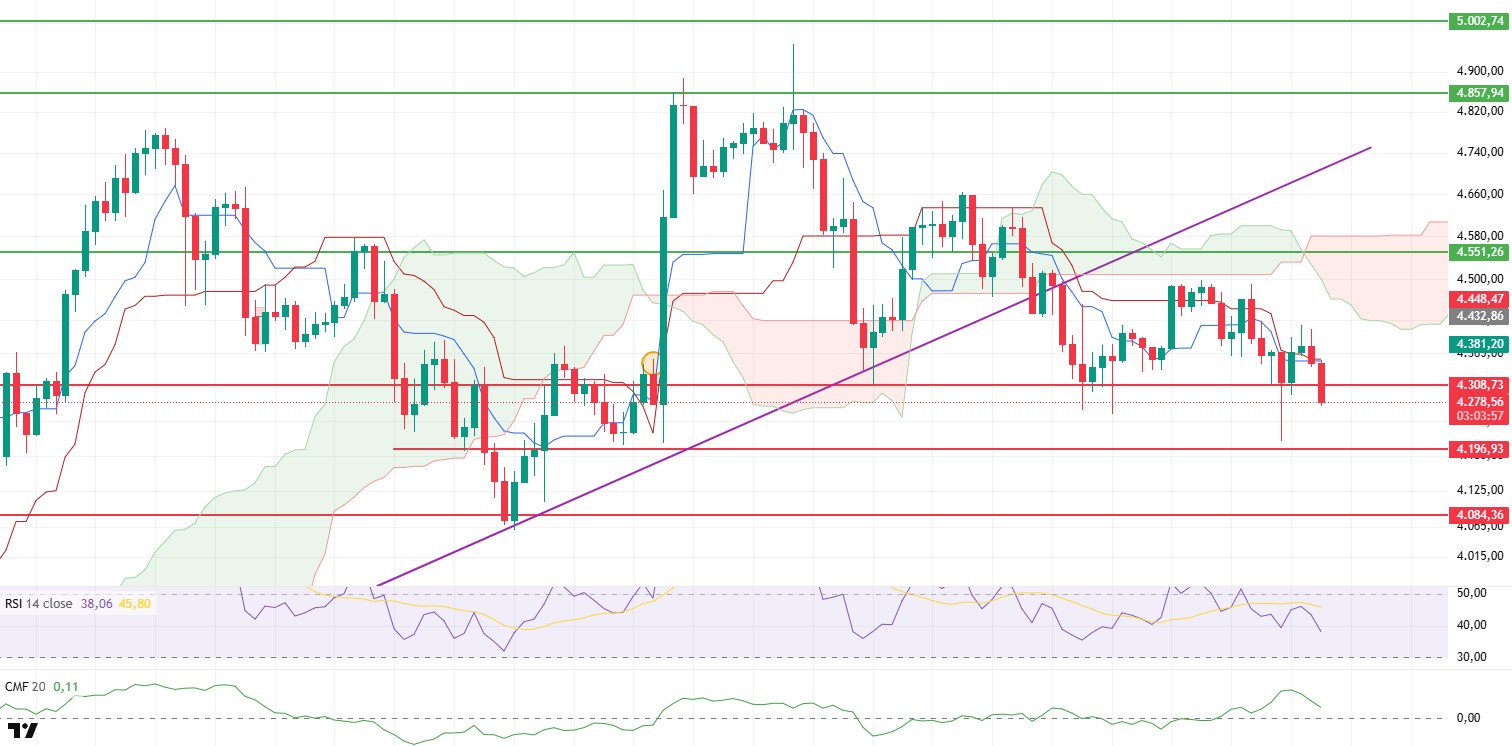
The ETH price failed to hold above the $4,400 level in the evening hours and retreated under selling pressure. The break below the $4,308 support accelerated the decline, pushing the price below the $4,300 level. This movement indicates that the strong buying demand seen in the morning hours has weakened and that the short-term upward momentum could not be sustained. In particular, the shift from aggressive buying seen in the spot market in the morning to a more cautious outlook limited the price’s upside potential.
On the liquidity side, although the Chaikin Money Flow (CMF) remained in positive territory, its downward trend indicates that capital outflows from the market have begun, albeit gradually. This outlook shows that buyers’ confidence in the market has weakened and that new entries have failed to provide sufficient momentum. The CMF’s weakening outlook is a significant signal that buyers may struggle to push the price back above $4,400.
The Ichimoku indicator presents a technically mixed picture. Although the Tenkan level crossing above the Kijun level produced a positive signal, this crossover occurred below the kumo cloud and is therefore not considered a strong bullish signal. This situation reveals that the main trend has not yet clearly turned positive and that caution is needed regarding the sustainability of the uptrend. In particular, the price’s failure to achieve a sustained break above the kumo cloud indicates that more momentum is needed to confirm the uptrend.
On the momentum side, the Relative Strength Index (RSI) is showing a downward movement after being rejected by the MA line. This confirms that buyers are losing strength and short-term momentum is shifting towards sellers. This weakening in the RSI indicates that the price may struggle to hold at critical support levels.
In the short term, if the price remains below the $4,308 level, it could deepen the decline towards the $4,200 support zone. If this zone is broken, selling pressure could increase further, and the price could drop towards the $4,100 level. On the other hand, if the price rises above $4,308 , it could bring the possibility of a short-term recovery. However, for this recovery to gain momentum, closes above $4,400 are needed. Unless sustainability is achieved above this level, the prevailing selling risks in the short-term outlook will remain valid.
Support levels: 4,196 – 4,084 – 3,820
Resistance levels: 4,308 – 4,551 – 4,857
 XRP/USDT
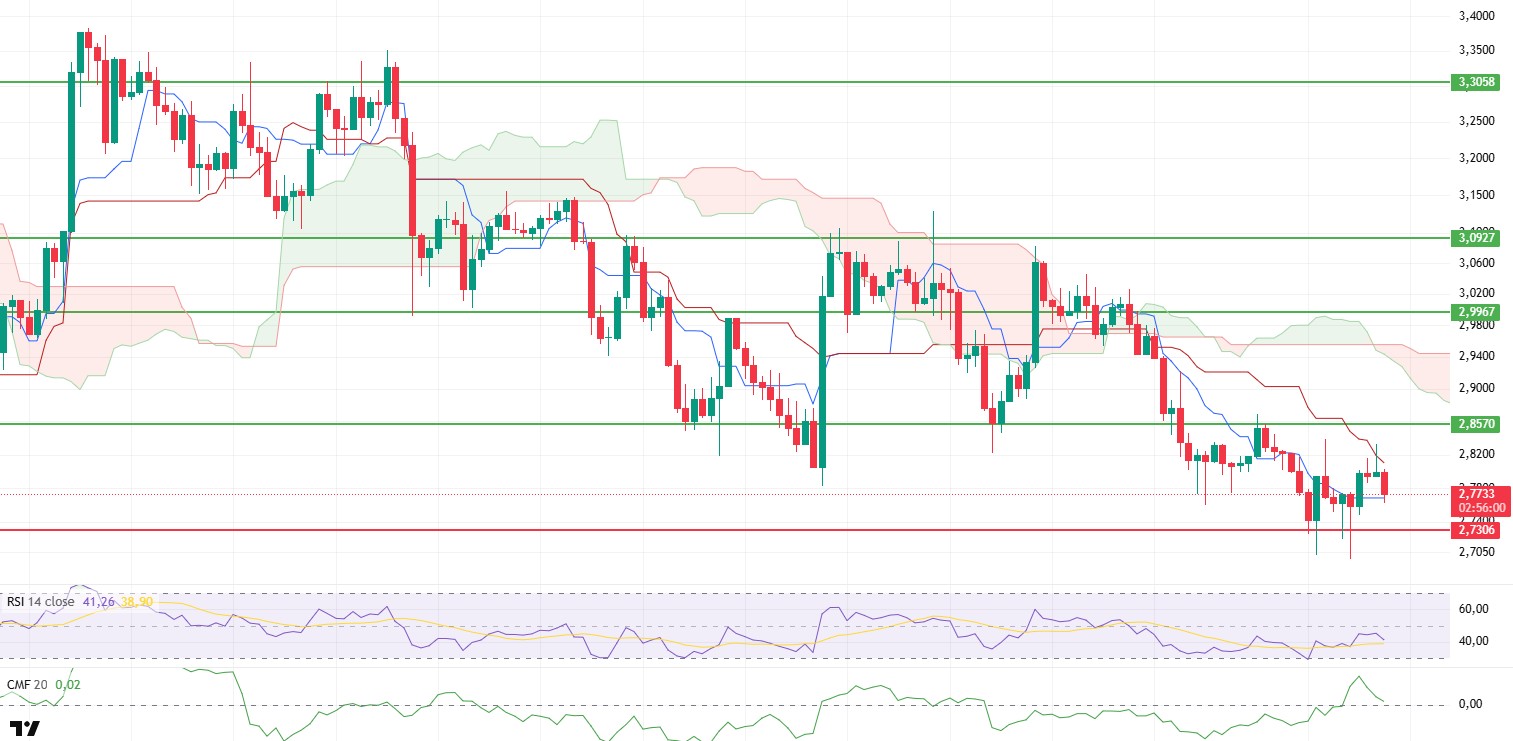
Although the XRP price managed to break through the $2.81 kijun resistance level during the day, it failed to maintain its position in this region. With increased selling pressure, the price retreated again and fell to the tenkan support level. Currently priced at $2.77, XRP failed to maintain the recovery trend seen in the morning hours and took on a more fragile appearance in the short term due to weakening buyer interest. This scenario clearly shows that sufficient volume and momentum support have not been established for the upward attempts to turn into a sustainable trend.
The deterioration in liquidity also supports this decline. The sharp decline of the Chaikin Money Flow (CMF) indicator to the zero line indicates a significant outflow of liquidity from the market. This confirms that buying appetite, particularly on the spot side, has weakened and selling pressure has gained strength. The CMF’s negative trend can be interpreted as a signal that buyers will struggle to push the price above critical resistance levels.
The technical picture in the Ichimoku indicator maintains its negative outlook. The price remaining below the kumo cloud clearly shows that the downward trend in the main trend continues. The Tenkan level is a critical support level for short-term price movements. Closing below this level of $2.76 could lead to intensified selling pressure and cause the price to rapidly decline to the $2.73 support level, and then to the $2.70 region. In this scenario, the risk of sales deepening more sharply due to panic should not be overlooked.
For the short-term upward recovery to regain strength, the price must first break through the $2.81 kijun resistance level and maintain stability above this level. However, the current technical outlook indicates that there is insufficient buyer support to break through this level and that upward attempts are easily countered by selling pressure. If buyers cannot break through this level with strong volume, the price is likely to remain stuck in a narrow range between $2.76 and $2.81, or experience a deeper pullback if $2.76 is broken.
Overall, the weak momentum and declining liquidity of XRP purchases have created an environment where short-term downside risk is prominent. Therefore, future price movements at critical support and resistance levels will play a key role in determining the direction of the trend.
Support levels: 2.7306 – 2.6513 – 2.4730
Resistance levels: 2.8570 – 2.9967 – 3.0927
SOL/USDT
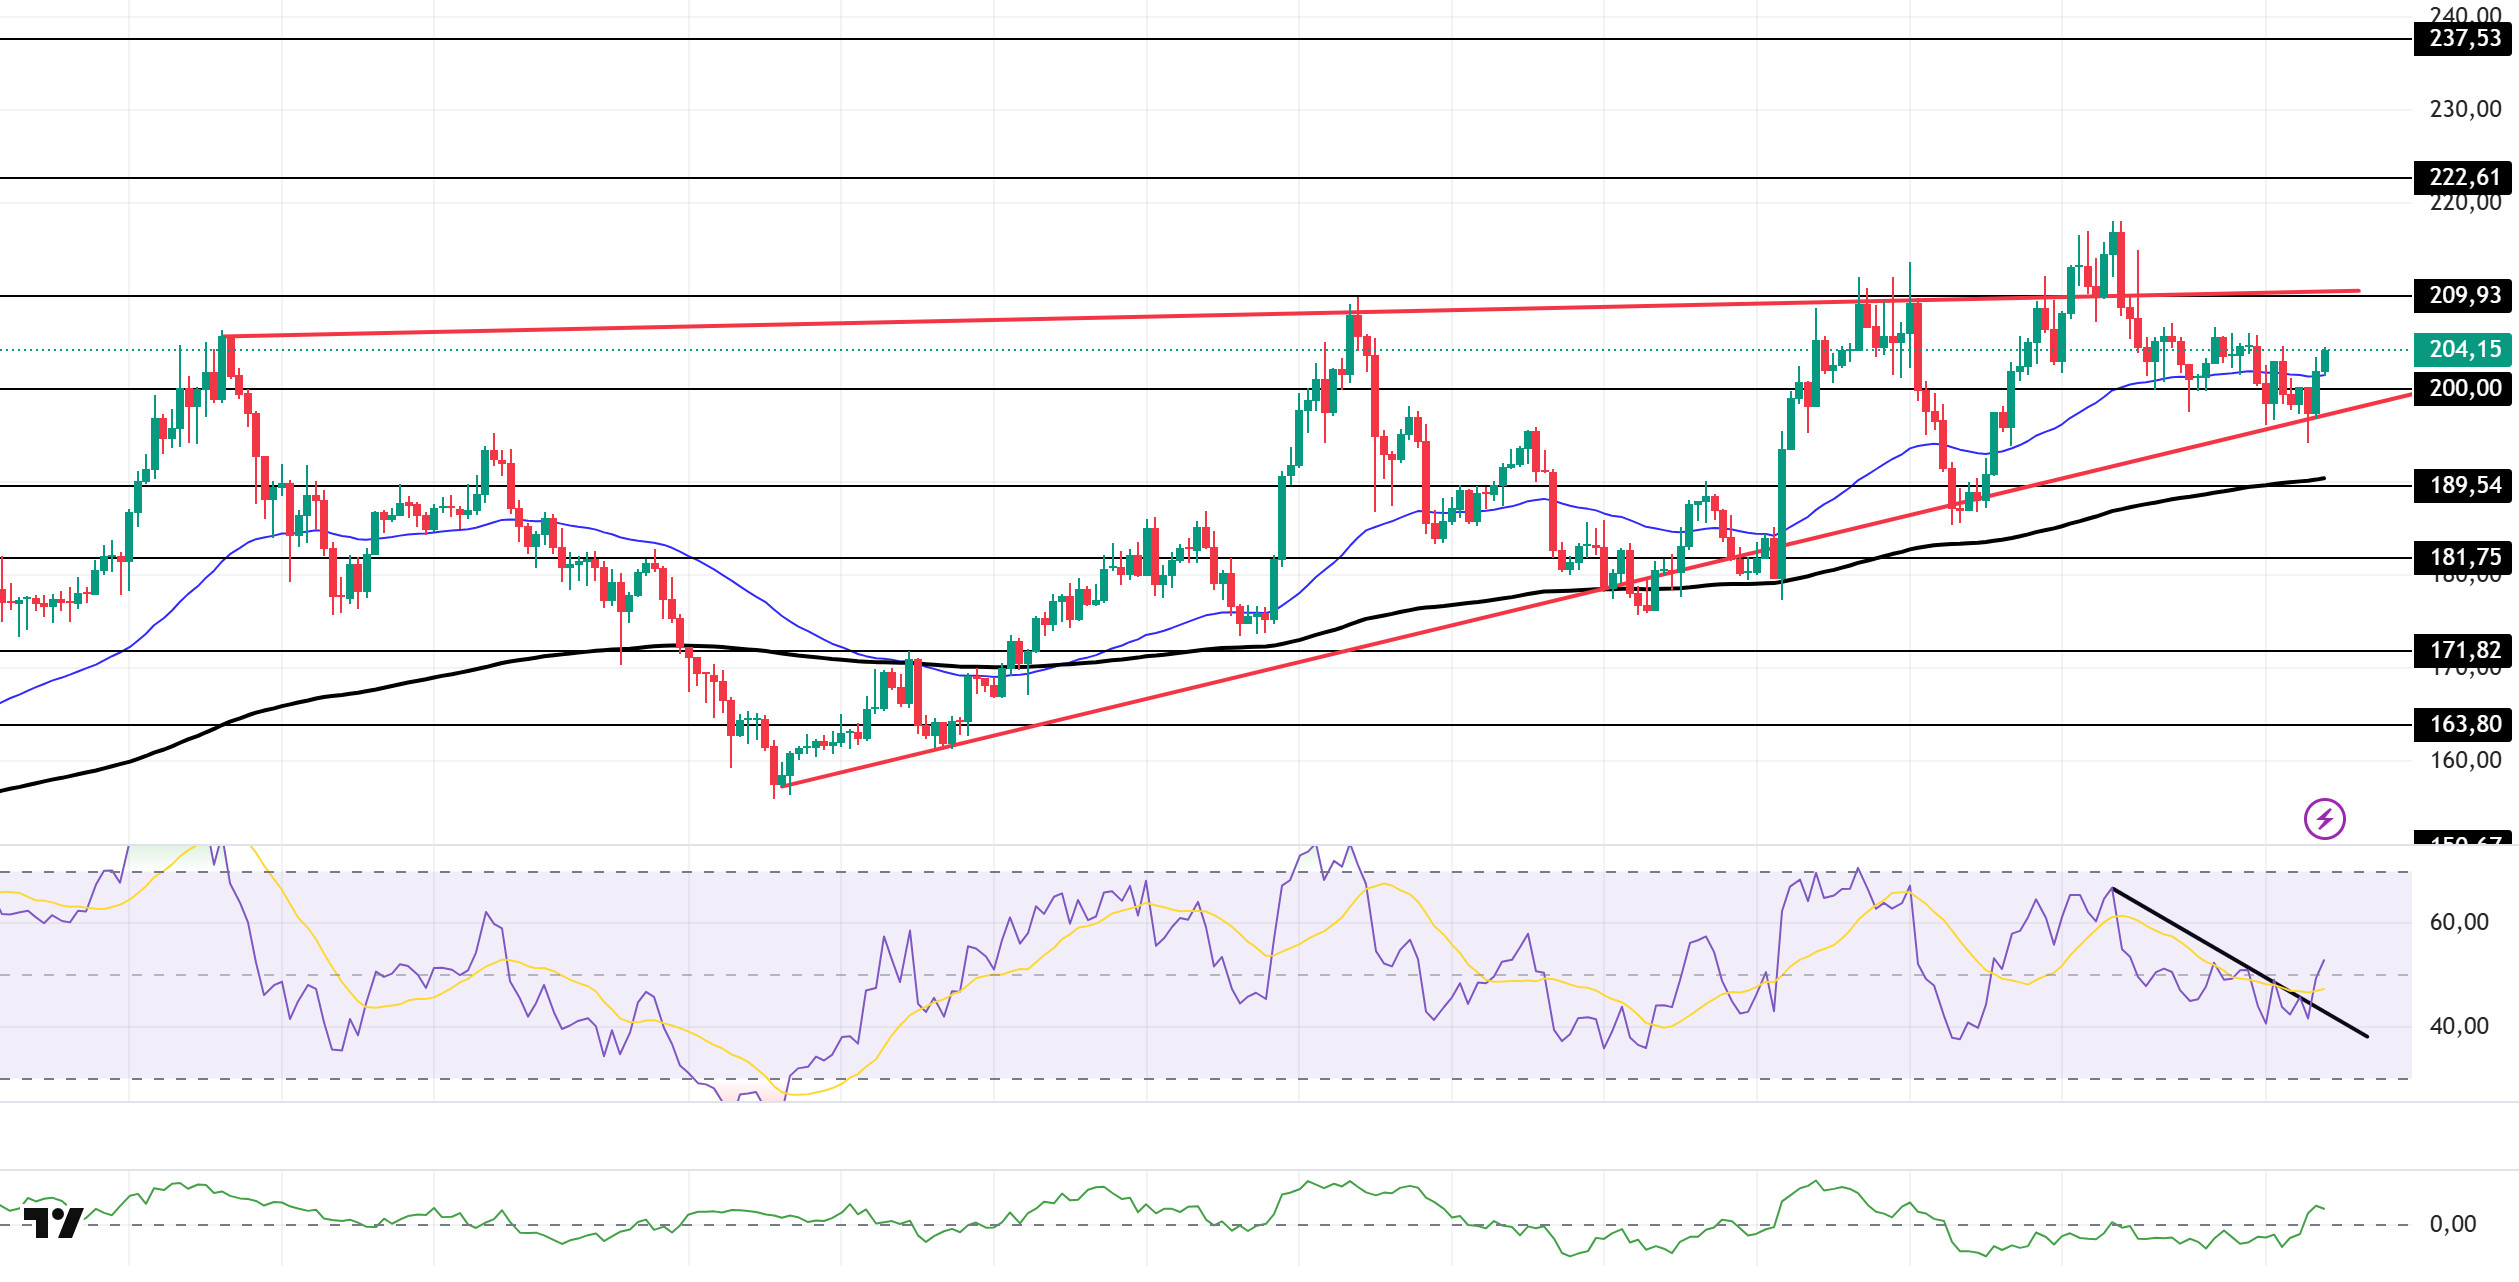
The SOL price showed an upward trend. The asset continued to be within the rising wedge formation that began on August 2. Breaking below the strong support level of $200.00, the price tested the base level of the formation as support and showed an upward trend with momentum from there. Currently trading above the strong resistance level of $200.00 and the 50 EMA (Exponential Moving Average – Blue Line), the price could test the top of the pattern if it continues its upward movement. In the event of a pullback, the $189.54 level could be monitored.
On the 4-hour chart, the 50 EMA (Blue Line) remained above the 200 EMA (Black Line). This indicates that the medium-term upward trend may continue. At the same time, the price being above both moving averages shows us that the market is trending upward in the short term. Chaikin Money Flow (CMF-20) has moved into positive territory. Furthermore, an increase in money inflows could push CMF to the upper levels of the positive zone. The Relative Strength Index (RSI-14) has risen to the positive zone. It also broke the downward trend that began on August 29, signaling buying pressure. If an uptrend occurs due to macroeconomic data or positive news related to the Solana ecosystem, the $209.93 level stands out as a strong resistance point. If this level is broken upwards, the rise is expected to continue. If there are pullbacks due to developments in the opposite direction or profit-taking, the $189.54 level may be tested. A decline to these support levels could increase buying momentum, presenting a potential opportunity for an uptrend.
Supports: 200.00 – 189.54 – 181.75
Resistances: 209.93 – 222.61 – 237.53
DOGE/USDT
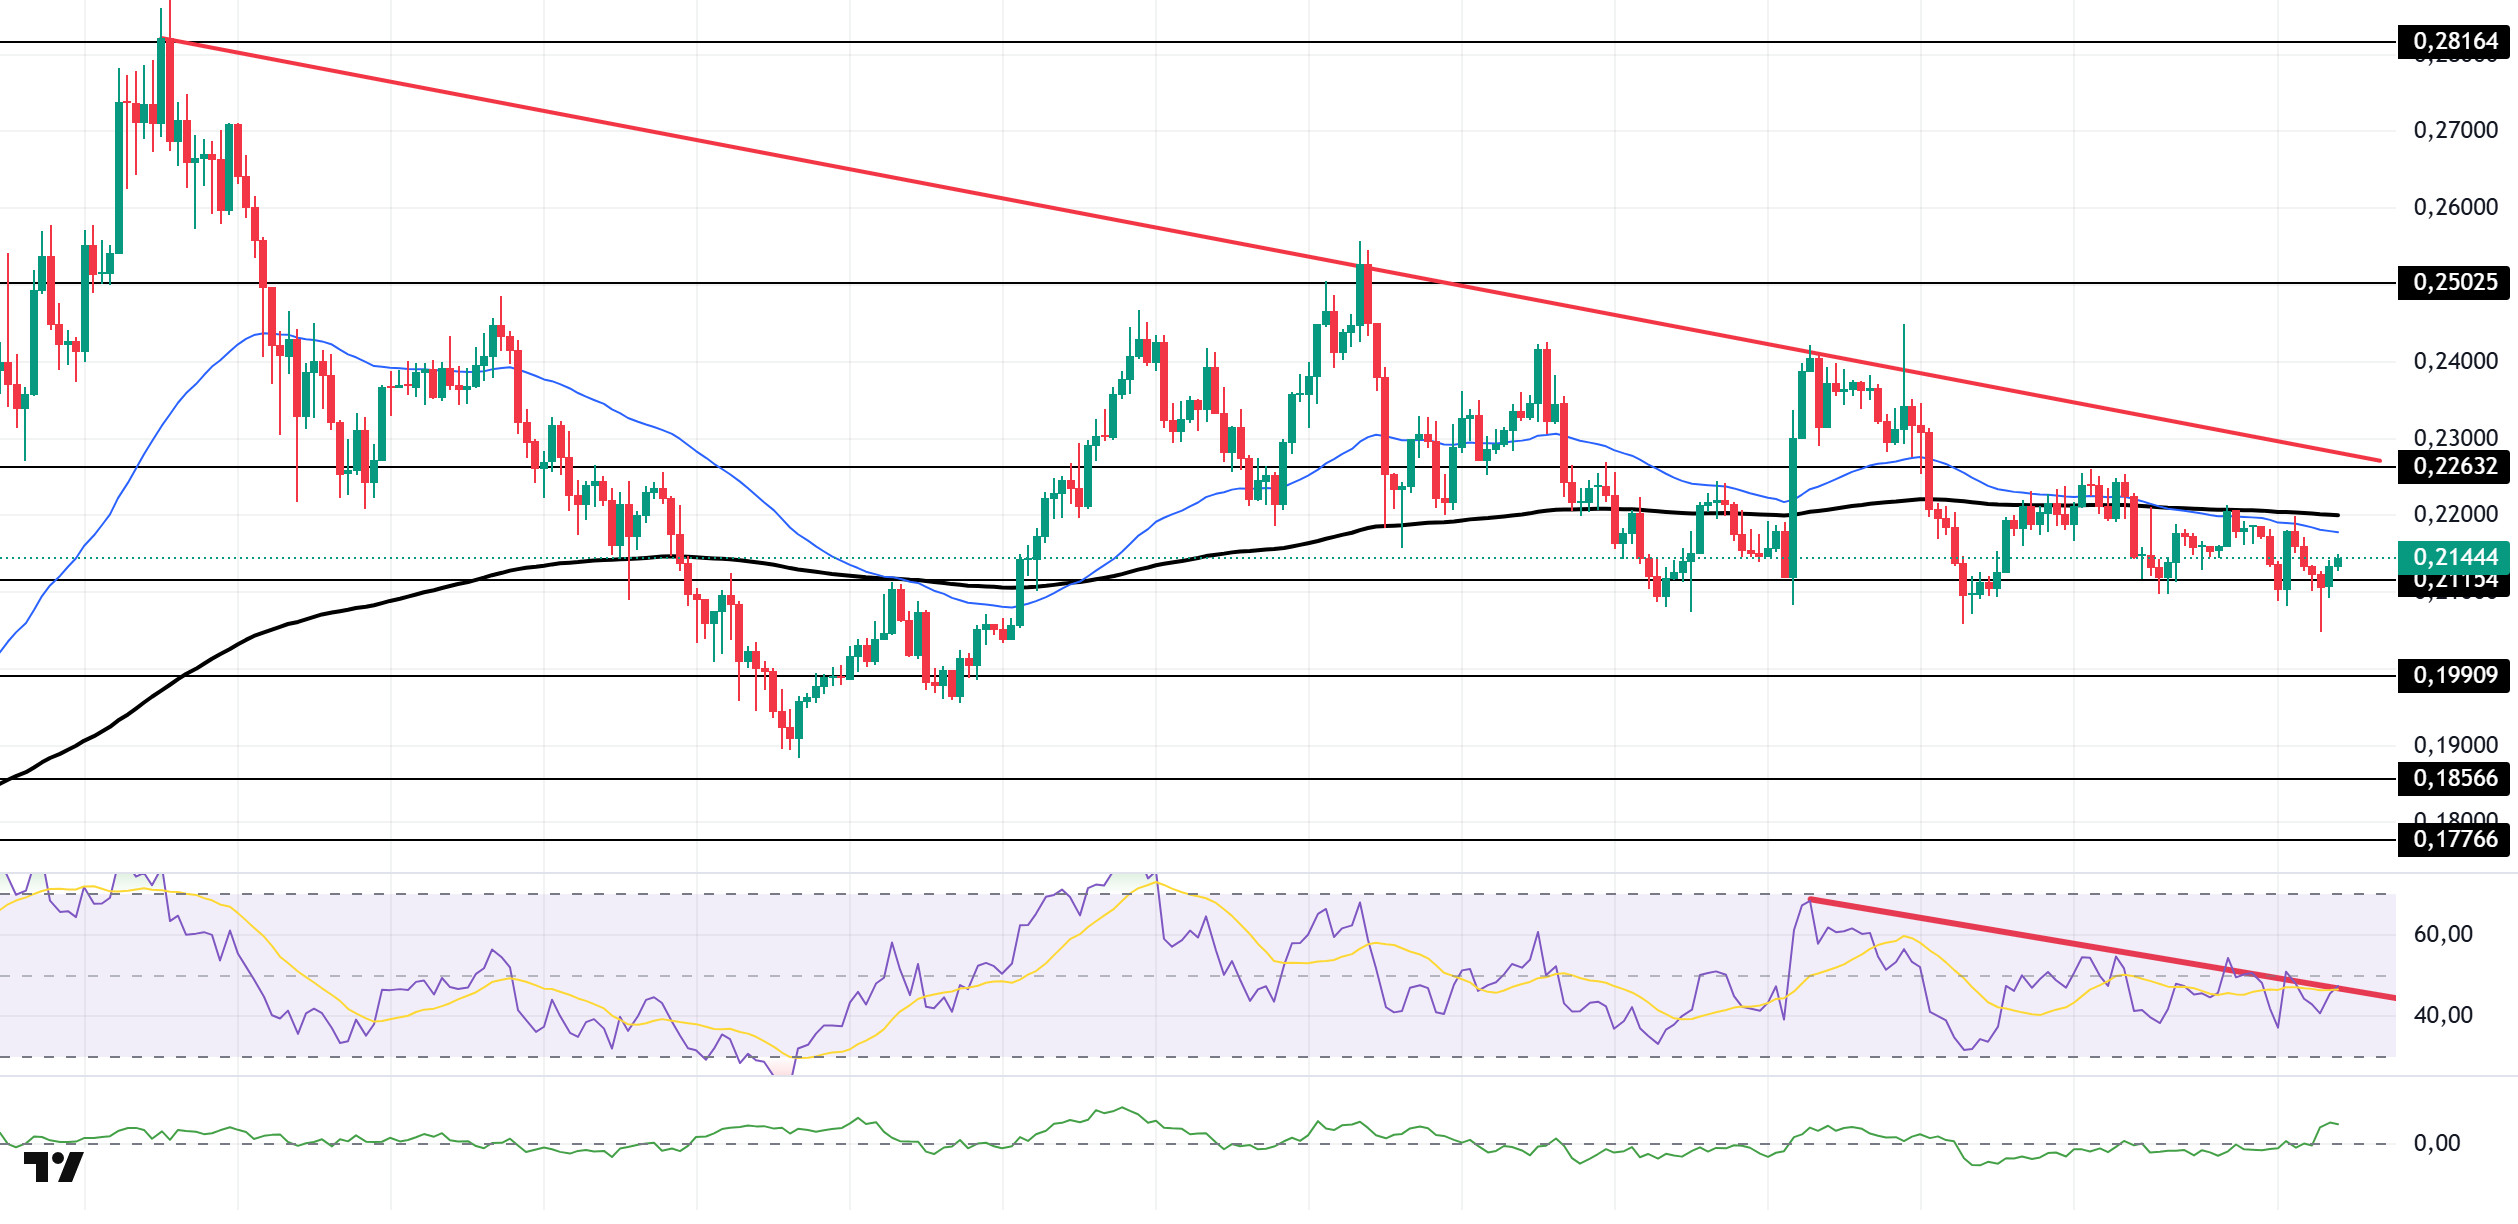
The DOGE price continues to move sideways. The asset remained below the downtrend that began on July 21. The price, which faced resistance from the 50 EMA (Exponential Moving Average – Blue Line) and 200 EMA (Black Line) moving averages, found support at the strong support level of $0.21154 and gained momentum. If the upward trend continues, the $0.22632 level should be monitored. In the event of a pullback, the $0.19909 level should be monitored.
On the 4-hour chart, the 50 EMA (Blue Line) remained below the 200 EMA (Black Line). This indicates that a medium-term downward trend has begun. The price being below both moving averages also shows that the asset is in a downward trend in the short term. The Chaikin Money Flow (CMF-20) has moved into positive territory. Additionally, an increase in cash inflows could push the CMF to the upper levels of the positive zone. The Relative Strength Index (RSI-14) remains in the negative zone. At the same time, it is currently testing the resistance level of the downward trend that began on August 22. A break above this level could lead to an increase. In the event of potential increases driven by political developments, macroeconomic data, or positive news flow within the DOGE ecosystem, the $0.22632 level stands out as a strong resistance zone. Conversely, in the event of negative news flow, the $0.19909 level could trigger a . A decline to these levels could increase momentum and potentially initiate a new upward wave.
Supports: 0.21154 – 0.19909 – 0.18566
Resistances: 0.22632 – 0.25025 – 0.28164
TRX/USDT
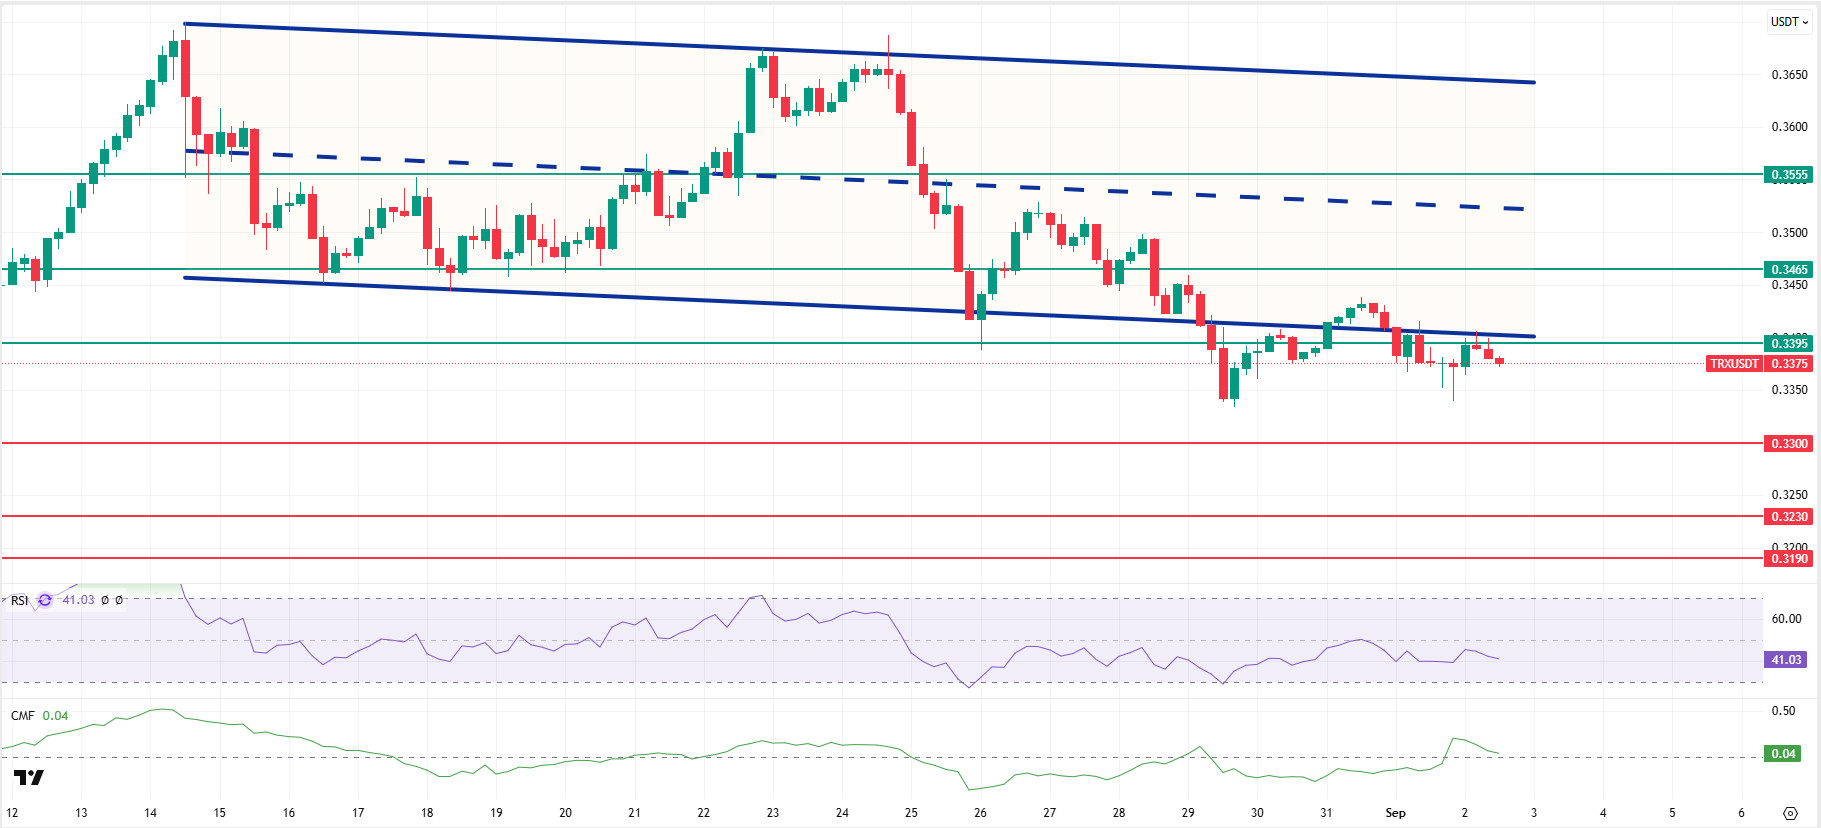
As mentioned in this morning’s analysis, TRX failed to stay above the 0.3395 resistance after a limited decline and is currently trading at 0.3375 under selling pressure from the lower band of the bearish channel. Currently just below the bearish channel, TRX is hovering near the 0.3395 resistance on the 4-hour chart. The Relative Strength Index (RSI) value of 41 indicates that it is in the sell zone. In addition, the Chaikin Money Flow (CMF) indicator continues to remain above the zero level with a value of 0.04, indicating that money inflows are continuing. The CMF remaining in positive territory can be considered an indicator of a possible price increase.
In light of all these indicators, TRX may rise slightly in the second half of the day and move towards the bearish channel. It may then test the 0.3395 resistance level. If it closes above this resistance level, it may continue to rise and then move towards the middle band of the channel, testing the 0.3465 resistance level. If it fails to close above the 0.3395 resistance level, it may move away from the channel downward due to capital outflows that may occur with the CMF entering negative territory. As a result, it may test the 0.3300 and 0.3230 support levels in sequence.
On the 4-hour chart, 0.3190 is an important support level, and as long as it remains above this level, the upward momentum is expected to continue. If this support is broken, selling pressure may increase.
Supports: 0.3300 – 0.3230 – 0.3190
Resistances: 0.3395 – 0.3465 – 0.3555
LTC/USDT
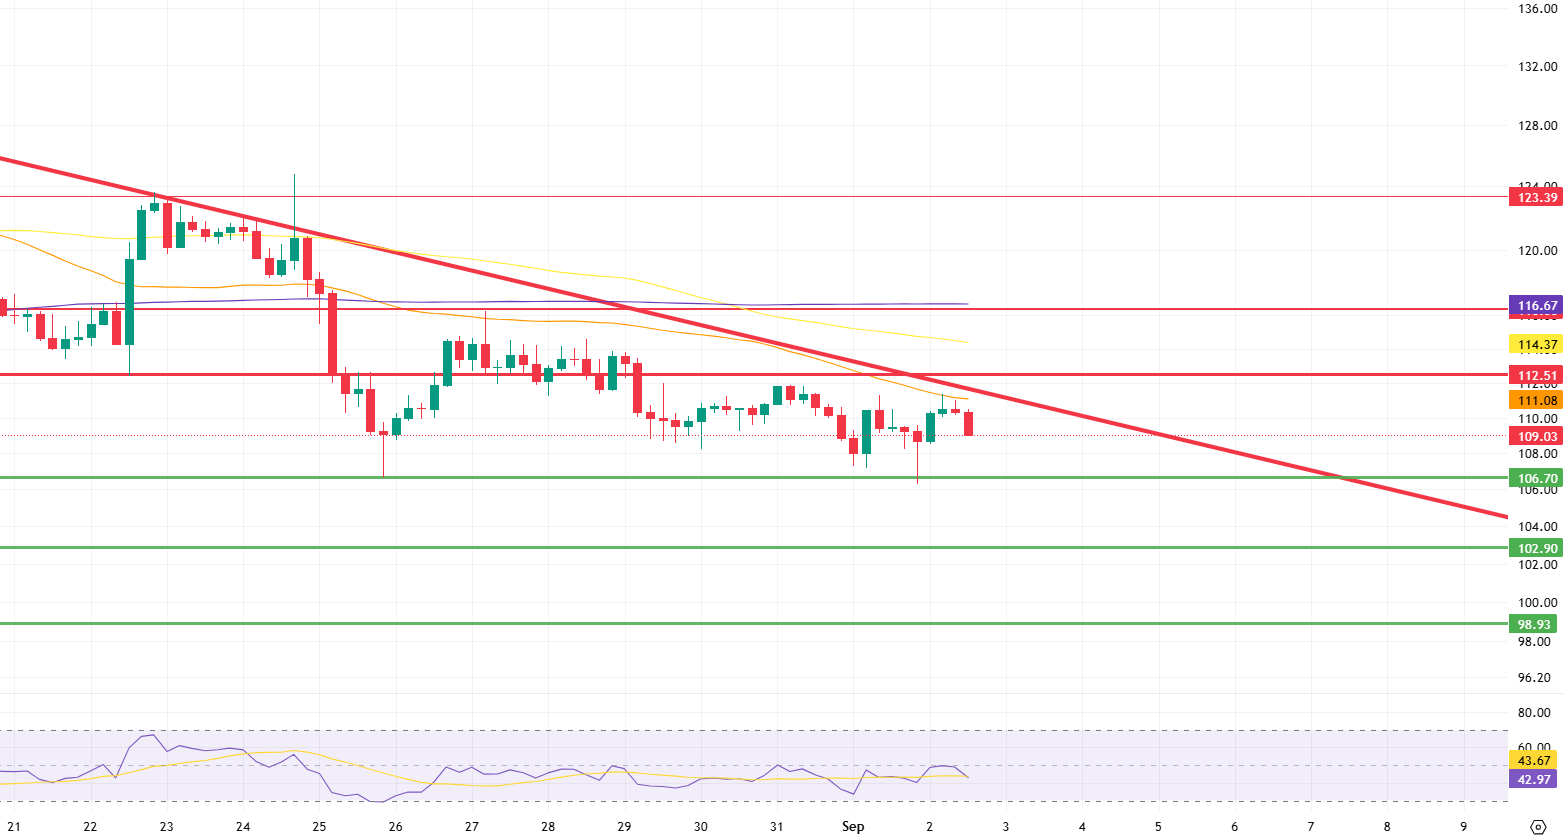
LTC continues its positive trend, gaining 1.05% from the start of the day. Bitcoin also saw a notable 1.01% increase, indicating that the balance of power in the pair is beginning to shift in its favor. On the futures side, the long/short position ratio standing at 1.0458 indicates that market participants are still maintaining their upward expectations. The positive trend in funding rates also points to buyers maintaining momentum.
The first important threshold for LTC to start rising is the 111.08 level. Both the falling trend line and the 50-period moving average (orange line) moving close to this area make it critical. If the price closes above this level consistently, it will be the first confirmation that buyers are gaining strength. If the resistance is broken with high trading volume, the short-term target for the price will be the 112.51 level. This area is a critical test for the sustainability of the uptrend, and the price reaction here will determine the direction of the trend. If a strong hold is established above this level, the next focus will be the 116.67 level. This area, where both horizontal resistance and the 200-period moving average (purple line) exert pressure, stands out as an area where buyer intensity may weaken and selling pressure may regain strength.
If the 106.70 level is broken downwards, the probability of selling pressure gradually increasing and pulling the price back to the next support point at 102.90 will rise. The most critical factor to watch at this point will be the direction of the reaction from the 102.90 level; the reaction will play an important role in determining the short-term market trend. However, if a sustained break below this band occurs, the technical outlook will weaken significantly, and the possibility of selling deepening to the 98.93 level will increase.
Supports: 106.70 – 102.90 – 98.93
Resistances: 111.08 – 112.51 – 116.68
SUI/USDT
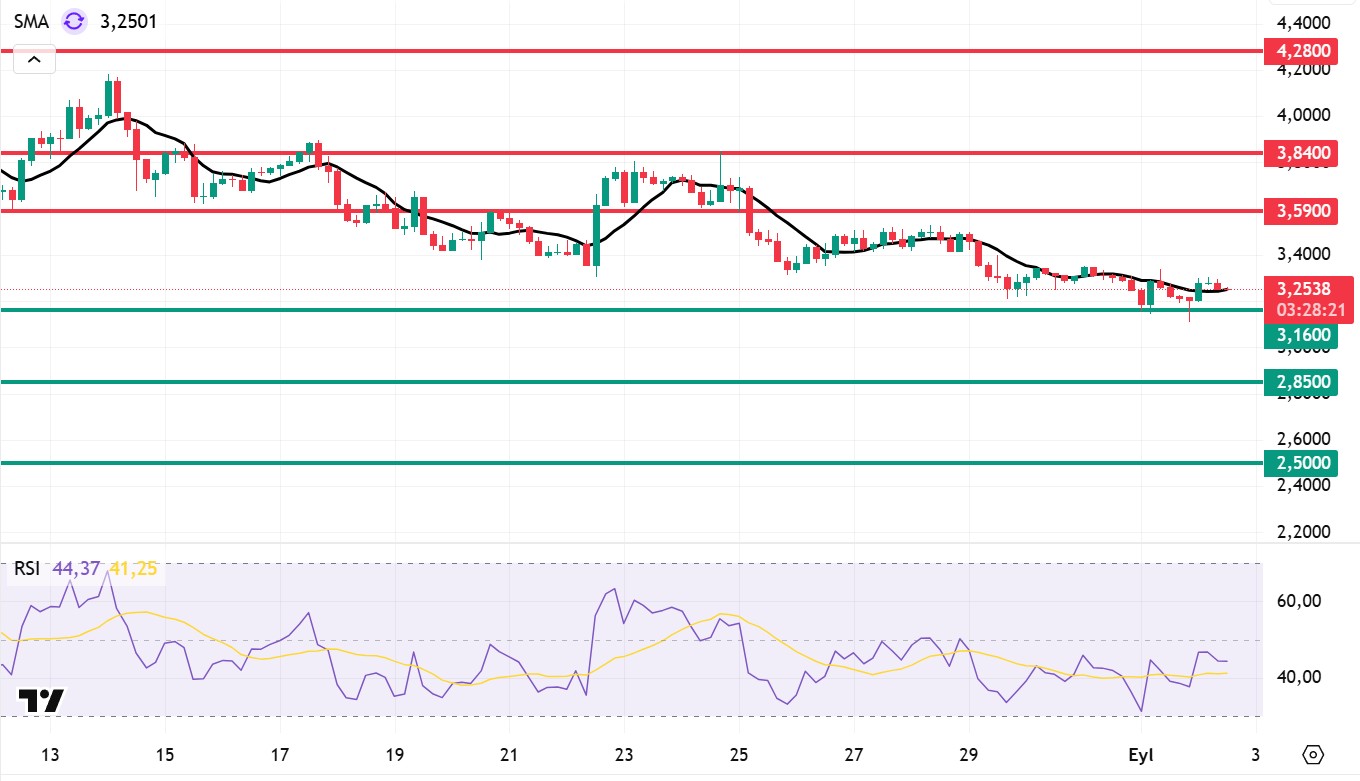
Looking at Sui’s technical outlook, we see that the price has declined on a weekly basis to around $3.25, influenced by fundamental developments. The Relative Strength Index (RSI) is currently in the 44.37 – 41.25 range. This range indicates that the market is trading close to the sell zone; however, if the RSI weakens and falls to the 30.00 – 35.00 range, it could signal a potential buying point. If the price moves upward, the resistance levels of $3.59, $3.84, and $4.28 can be monitored. However, if the price falls to new lows, it could indicate that selling pressure is intensifying. In this case, the $3.16 and $2.85 levels stand out as strong support zones. In particular, in the event of sharp sell-offs, a pullback to $2.50 appears technically possible.
According to Simple Moving Averages (SMA) data, Sui’s average price is currently at $3.25. The price remaining below this level indicates that the current downtrend could technically continue. The downward trend of the SMA also supports this situation.
Support levels: 2.50 – 2.85 – 3.16
Resistances: 3.59 – 3.84 – 4.28
Legal Notice
The investment information, comments, and recommendations contained herein do not constitute investment advice. Investment advisory services are provided individually by authorized institutions taking into account the risk and return preferences of individuals. The comments and recommendations contained herein are of a general nature. These recommendations may not be suitable for your financial situation and risk and return preferences. Therefore, making an investment decision based solely on the information contained herein may not produce results in line with your expectations.


