
Technical Analysis
BTC/USDT
Strategy (formerly MicroStrategy) did not make any new Bitcoin purchases during the week of July 21-27. MARA Holdings raised $950 million through the issuance of 0% interest rate convertible bonds. This fund will be used for additional Bitcoin purchases, repayment of $50 million of previous bond debt and various corporate purposes.
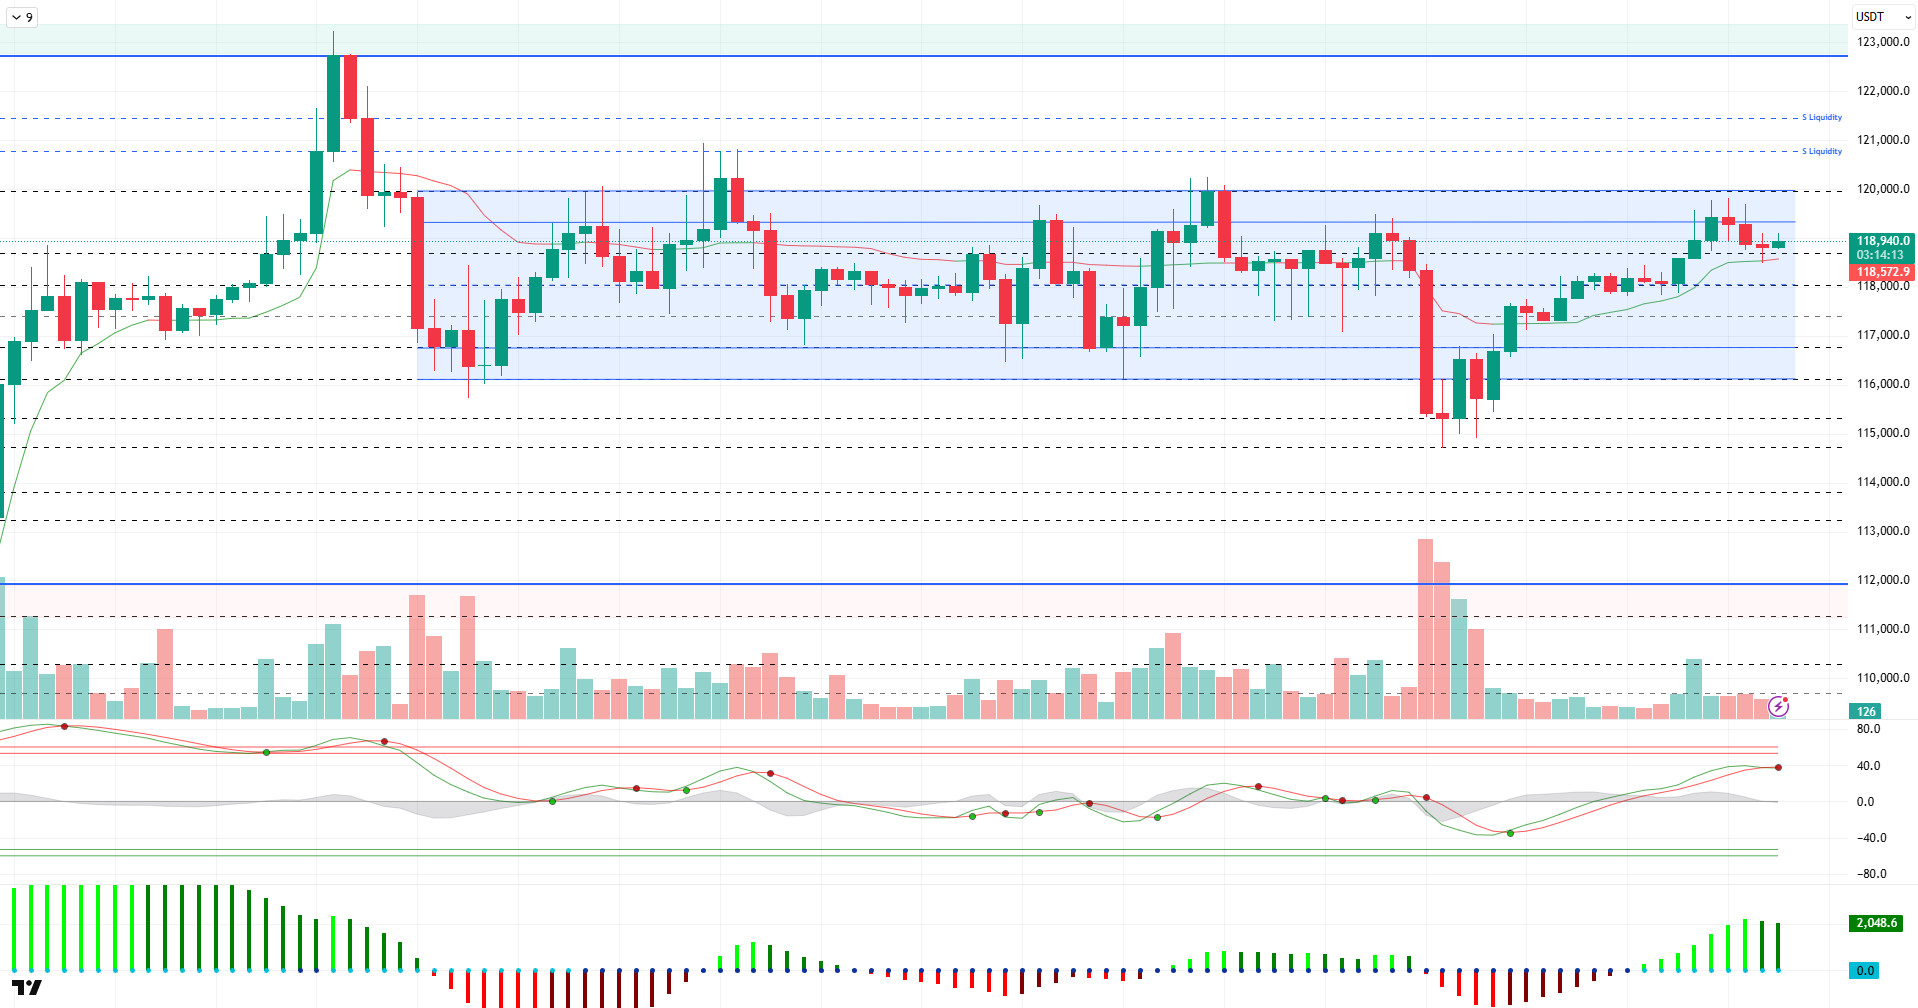
When we look at the technical outlook, BTC, which tested the 115,000-level last week, broke the horizontal band range it has been following for a while, but managed to recover again with the reaction it received from this region. Forming a minor bullish channel, the price came above 119,000 with a “V” type rise.
On the technical indicators front, the Wave Trend (WT) oscillator is preparing for a trend reversal near the oversold zone from the channel mid-band with the decline. The Squeeze Momentum (SM) indicator is losing momentum in positive territory again. The Kaufman moving average is just below the price at 118,600.
Looking at the liquidity data, it was seen that the purchase levels in the 115,000 – 116,000 band were liquidated with the decline, while the sales-oriented transactions in the 118,000 – 119,000 band were liquidated with the rise. The 120,600 level stands out as the closest liquidity area.
To summarize, BTC, which once again gained momentum amid fundamental developments, came back to its consolidated bandwidth. The technical outlook is approaching overbought territory, while liquidity data continues to define price limits. While a further rise in the price seems likely from a technical and liquidity perspective, the breach of the 120,000 resistance point will be monitored in the first stage. If it breaks, it may face selling pressure from the 120,600 liquidity zone. In a possible new selling pressure, 118,600 stands out as a minor support point.
Supports 118,600 – 118,000 – 117,500
Resistances 120,000 – 120,600 – 121,500
ETH/USDT
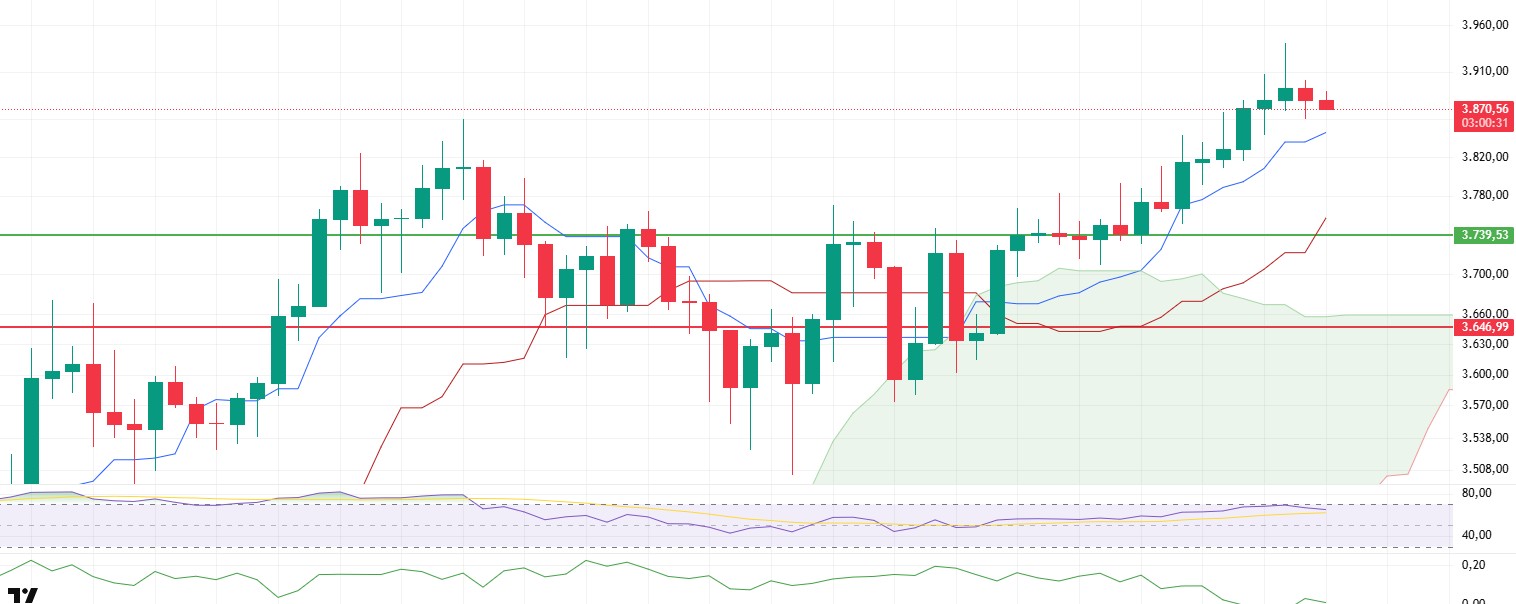
ETH continued to sell during the day in line with expectations and retreated to the $3,860 level. While this movement indicates that short-term weakness continues, technical indicators support the overall negative outlook. Especially the Chaikin Money Flow (CMF) indicator produces a remarkable signal. CMF, which has been flat in recent days and positioned close to the zero line, has started to exhibit a downward trend again. This indicates that the net liquidity outflow from the market continues and institutional or large volume buyers are still cautious. Therefore, it can be said that there is not yet a strong appetite on the buying side and the negative structure may continue.
On the other hand, the Relative Strength Index (RSI) indicator also plays a decisive role in the short-term direction of the price. The RSI, which recently approached the overbought zone, has been rejected from this zone and has fallen sharply. This suggests that the upside momentum has weakened and the market may remain in a correction trend for a while. The inability of the RSI to turn upwards at current levels may be taken as a clear signal that buying pressure is still limited.
In general terms, it can be said that the price has the potential to retreat a little more towards the evening hours. Especially in case of persistence below the $3,860 level, a new test towards the $3,800 band may come to the agenda. However, in a possible recovery scenario, closures above the $3,900 level could provide reassurance on the buying side and pave the way for a short-term upward movement. Maintaining above this threshold is critical for ETH to regain positive momentum.
Supports 3,739 – 3,646 – 3,480
Resistances 4,084 – 4,381 – 4,857
XRP/USDT
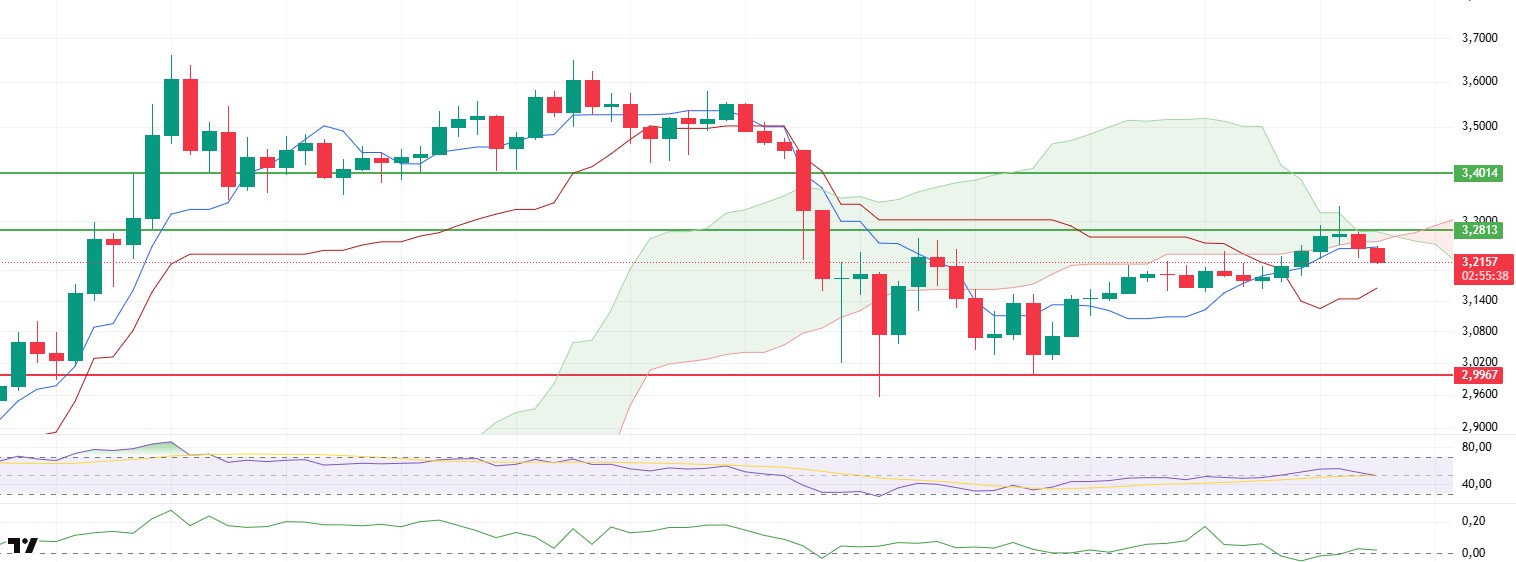
After the rejection from the kumo cloud zone mentioned in the morning analysis, XRP price dipped below the $3.28 level and retreated to the $3.21 band. This move means the loss of an important support, both technically and psychologically , and may deepen the current negative outlook. The $3.28 level was a threshold where the price tried to stay in balance in the short term, and the persistence below this region indicates that the downward pressure may continue.
On the technical indicators front, the Relative Strength Index (RSI) has pulled back to the moving average line. This suggests that buying power in the market is weakening and upside attempts are struggling to gain momentum. While the RSI continues to show a bearish bias, it is yet to signal a clear reversal, suggesting that pressure may persist in the short term.
The Chaikin Money Flow (CMF) indicator continues to move horizontally around the zero line. Although this suggests that liquidity inflows and outflows remain in balance in the market, it suggests that a strong direction-setting capital movement has not yet emerged. Unless there is an upward breakout in CMF, it seems difficult for the market to generate a strong recovery signal.
In general terms, the price has the potential to retreat a little more with the weakness in momentum towards the evening hours. However, if the $3.28 level is regained and persistence above this region is achieved, the XRP price may regain a positive structure in the short term and a recovery-oriented movement may begin.
Supports 2.9967 – 2.8471 – 2.6513
Resistances 3.2813 – 3.4014 – 3.8615
SOL/USDT
Anatoly Yakovenko, co-founder of Solana, sparked widespread controversy by calling NFTs and memecoins “digital garbage”.
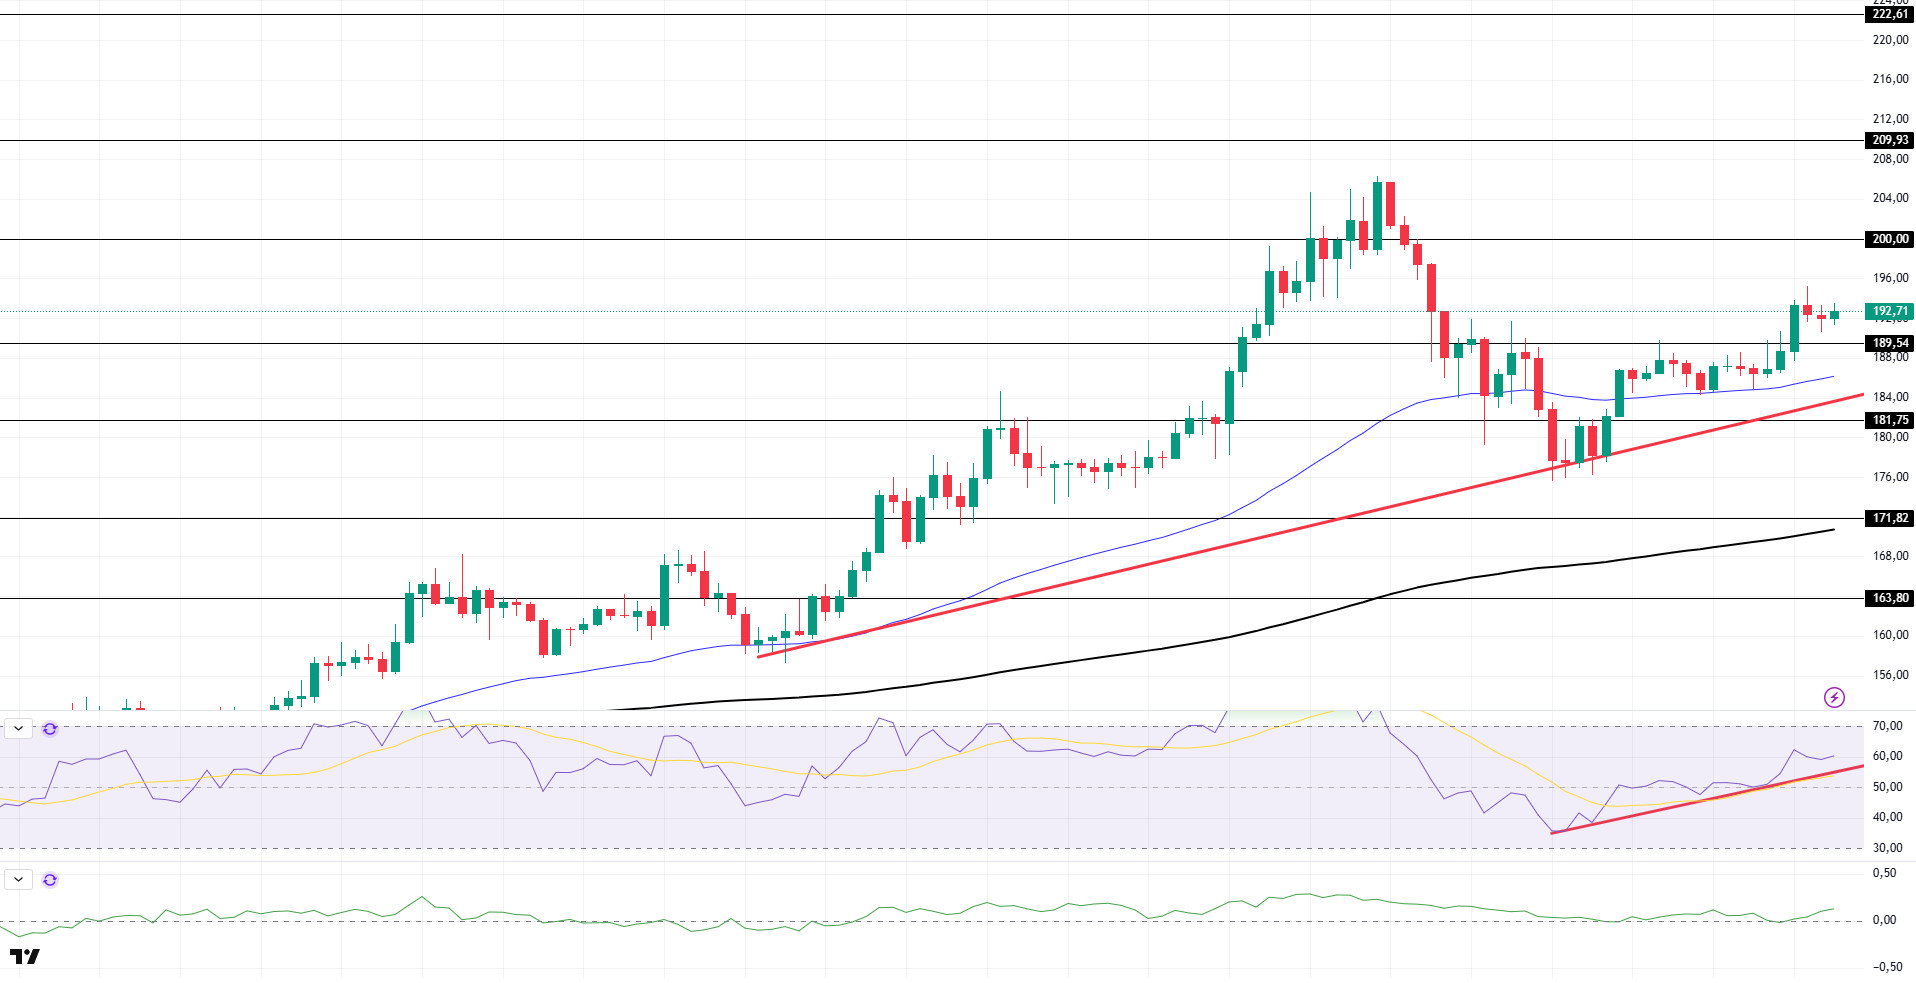
SOL price was flat on the day. The asset remains above the $189.54 level and the 50 EMA (Blue Line) moving average. If the rises continue, the $200.00 level can be followed. If the retracement continues, the 50 EMA (Blue Line) moving average can be followed.
On the 4-hour chart, the 50 EMA (Blue Line) continues to be above the 200 EMA (Black Line). This suggests that the bullish trend may continue in the medium term. At the same time, the fact that the price is above both moving averages suggests that the market is currently in a bullish phase. On the other hand, a large difference between the two moving averages may trigger a bearish or sideways trend. Chaikin Money Flow (CMF-20) remained in positive territory. However, a decrease in money inflows may move CMF into negative territory. Relative Strength Index (RSI-14) remains above the uptrend that started on July 25. This could be bullish. The $200.00 level stands out as a strong resistance point in the event of a rise on the back of macroeconomic data or positive news on the Solana ecosystem. If this level is broken upwards, the rise can be expected to continue. If there are pullbacks due to contrary developments or profit realizations, the $171.82 level can be tested. In case of a decline to these support levels, the increase in buying momentum may offer a potential bullish opportunity.
Supports 189.54 – 181.75 – 171.82
Resistances 200.00 – 209.93 – 222.61
DOGE/USDT
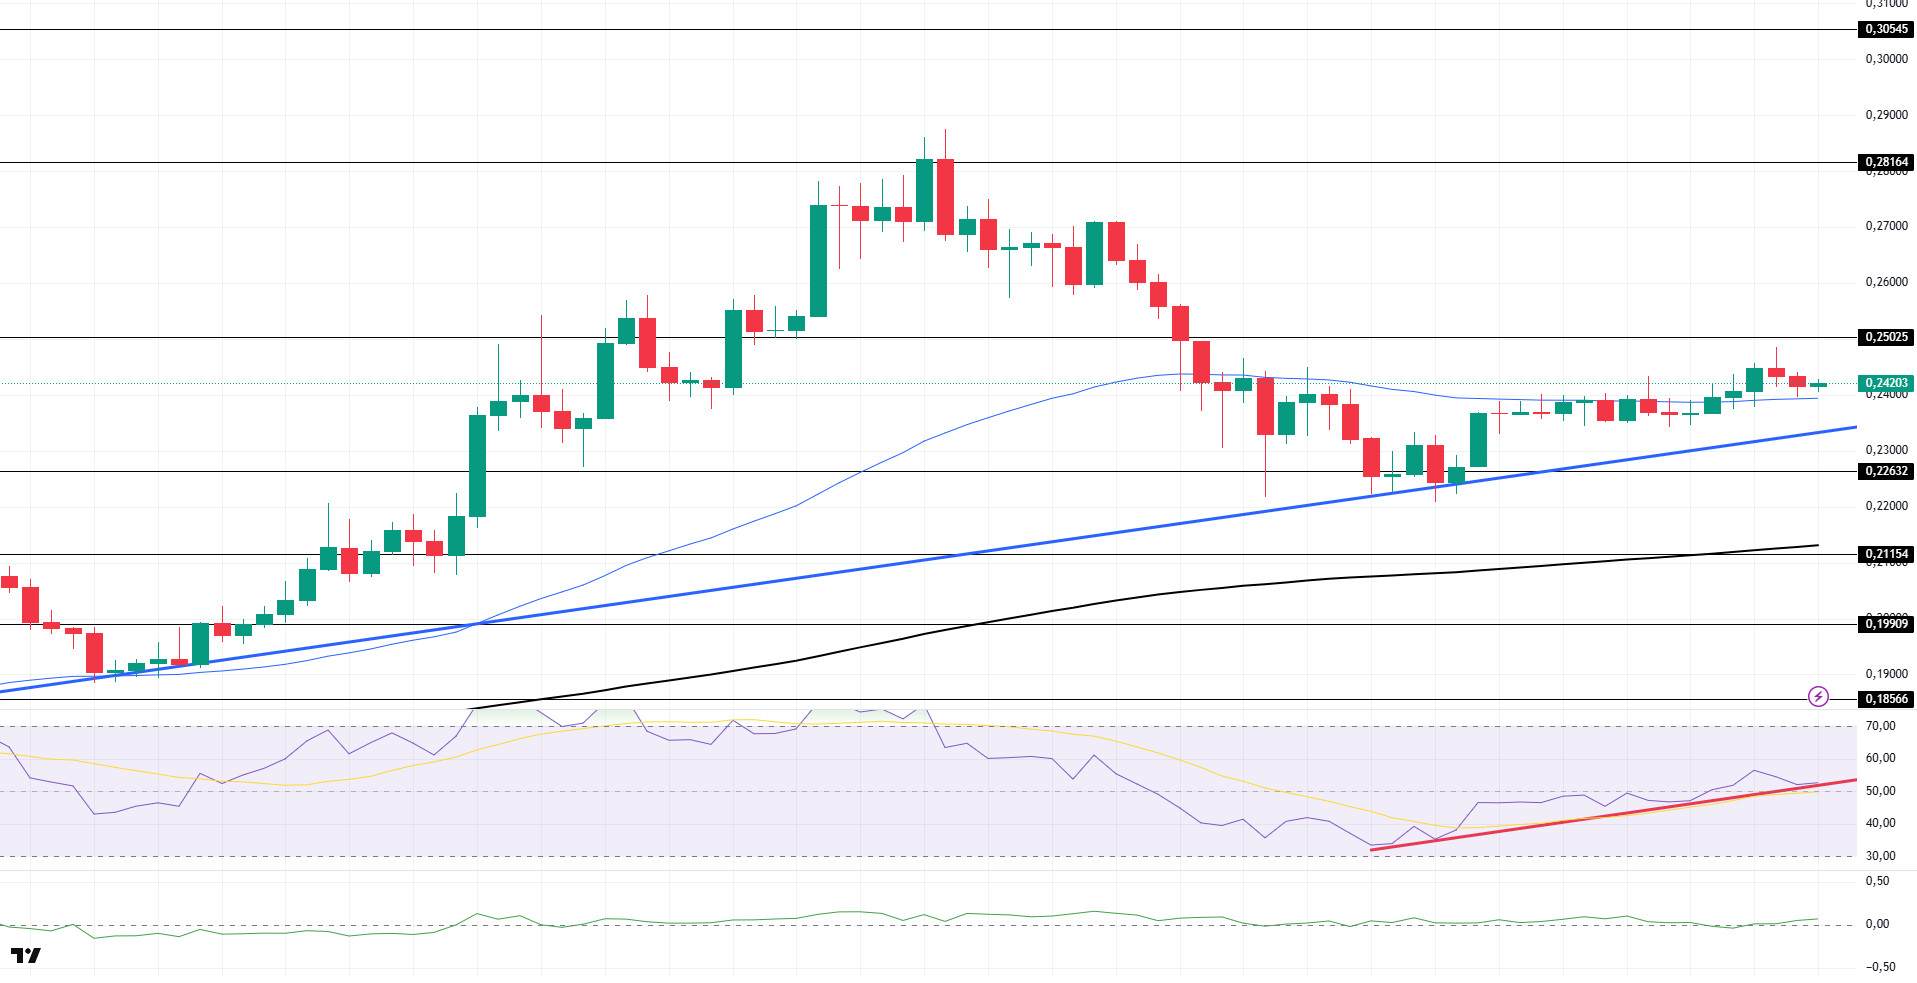
DOGE price was flat during the day. The asset remained above its 50 EMA (Blue Line) moving average with the uptrend that started on July 7. The price is currently testing the 50 EMA (Blue Line) moving average as support. If the uptrend continues, the $0.25025 level should be followed. If the retracement starts, the 200 EMA (Black Line) moving average can be followed as a support level.
On the 4-hour chart, the 50 EMA (Blue Line) continues to be above the 200 EMA (Black Line). This suggests that the asset is in an uptrend in the medium term. The fact that the price is above both moving averages suggests that the asset is in a bullish phase in the short term. A large difference between the two moving averages may cause the price to follow a bearish or sideways trend. Chaikin Money Flow (CMF-20) switched to a positive level. In addition, positive inflows may move CMF to the middle levels of the positive zone. Relative Strength Index (RSI-14) continues to be in the positive zone . Additionally, it remained above the uptrend that started on July 25. This could be a bullish signal. The $0.25025 level stands out as a strong resistance zone in the case of possible rises in line with political developments, macroeconomic data or positive news flow in the DOGE ecosystem. In the opposite case or possible negative news flow, the $0.21154 level may be triggered. In case of a decline to these levels, the momentum may increase and a new bullish wave may start.
Supports 0.22632 – 0.21154 – 0.19909
Resistances 0.25025 – 0.28164 – 0.30545
Legal Notice
The investment information, comments and recommendations contained herein do not constitute investment advice. Investment advisory services are provided individually by authorized institutions taking into account the risk and return preferences of individuals. The comments and recommendations contained herein are of a general nature. These recommendations may not be suitable for your financial situation and risk and return preferences. Therefore, making an investment decision based solely on the information contained herein may not produce results in line with your expectations.

