
Technical Analysis
BTC/USDT
US President Donald Trump announced that he had a meeting with Fed Chairman Jerome Powell, and they discussed interest rates. Trump stated that the meeting was constructive and that Powell stated that the economy was strong. Galaxy Digital has transferred a total of 17,123 BTC to exchanges in recent hours; 14,936 BTC currently remains in the wallet. UK-based The Smarter Web Company received another 225 BTC, bringing its total Bitcoin holdings to 1,825.
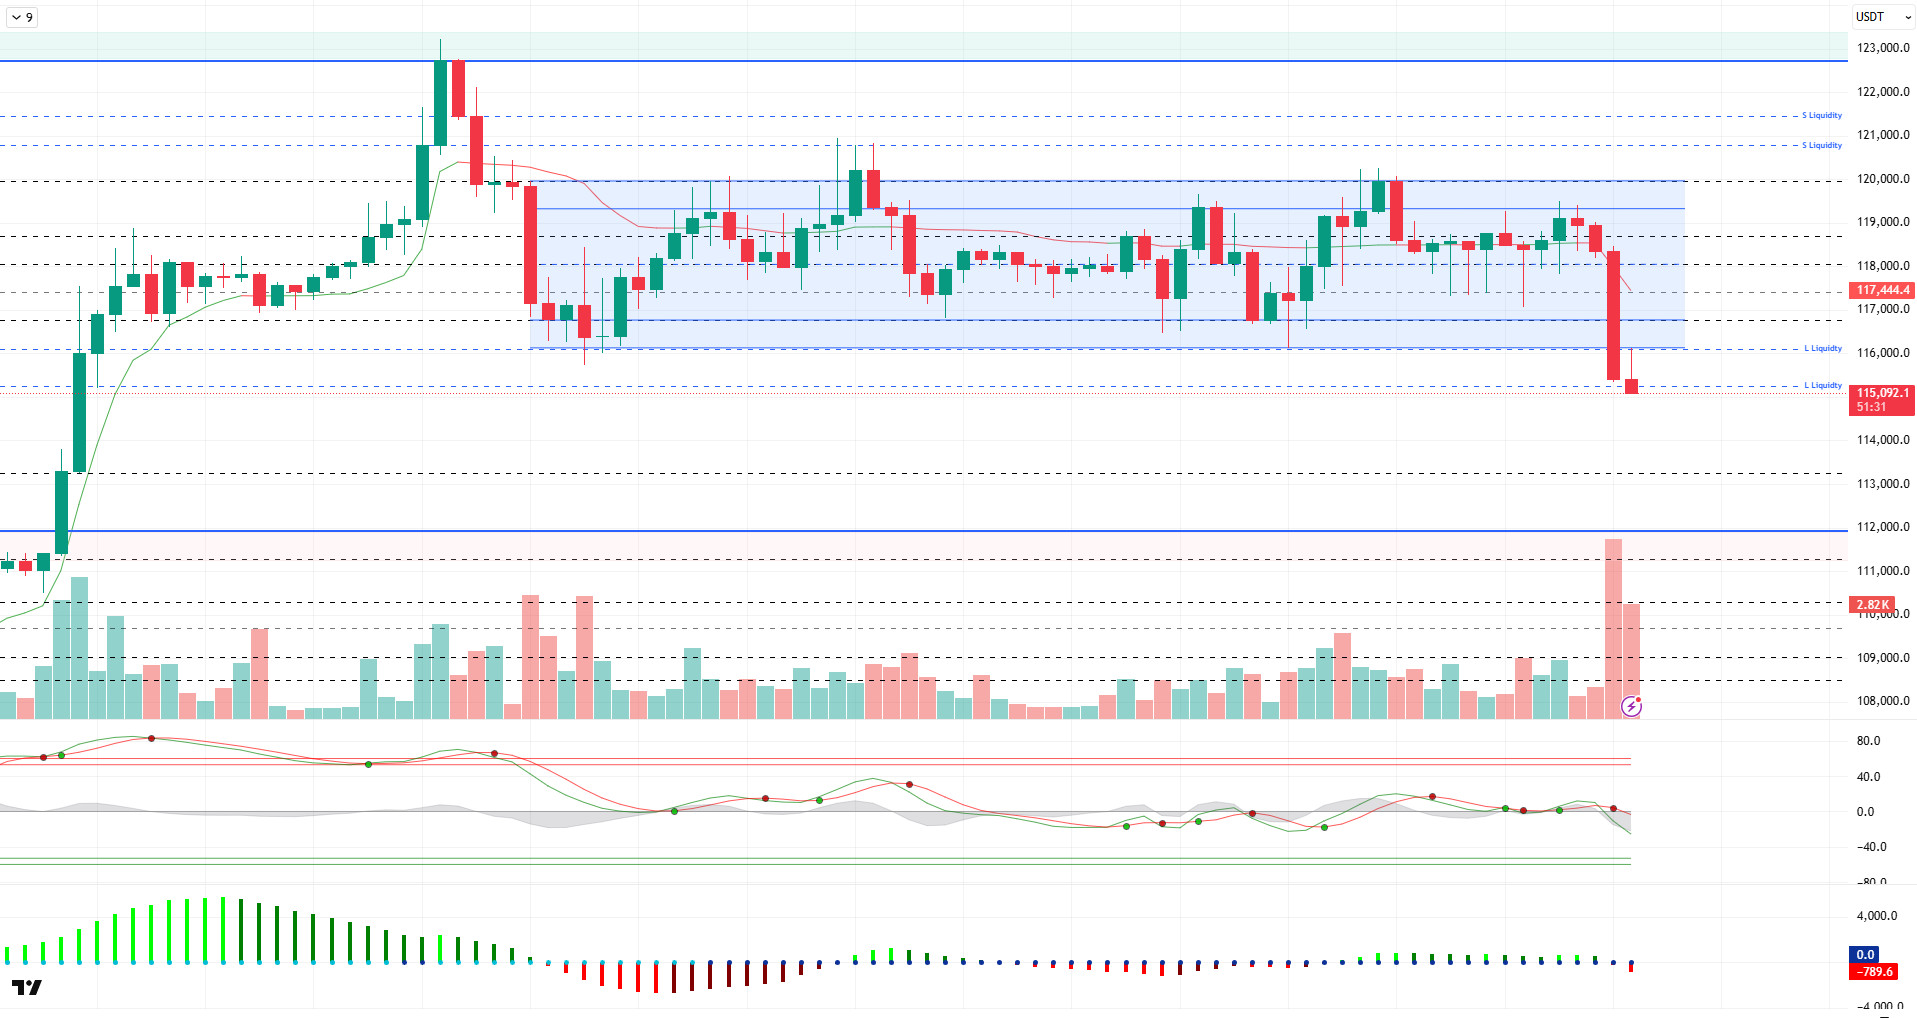
When we look at the technical outlook, it is seen that BTC has made a downward breakdown by failing to exceed the 120,000 level, despite forcing the 116,000 – 119,000 horizontal band range it has been moving in for a while. Following this move, BTC fell to the support level of 115,000 and is currently trading at 115,100.
On the technical indicators front, the Wave Trend (WT) oscillator is moving from the mid-channel band to the oversold zone with the decline. The Squeeze Momentum (SM) indicator has moved back into negative territory, suggesting increased selling pressure. The Kaufman moving average is at 117,500, well above the price, confirming the downtrend.
Looking at the liquidity data, it is seen that the buying levels in the 115,000 – 116,000 band were liquidated with yesterday’s decline. Likewise, it is understood that the sell trades opened around 119,000 in the short-term upward attack were also liquidated. In the last 24 hours, a total of approximately $553 million worth of positions were liquidated. Currently, liquidity accumulation continues to gather just above the 120,000 level.
Overall, it seems that BTC tested the new ATH level with fundamental developments and went through a prolonged consolidation phase in the process. However, selling pressure from the recent transfer movements pushed the price down to the 115,000 level. While the technical outlook is approaching the oversold zone, a rebound from this zone could move BTC back to the 116,000 – 119,000 band and continue the consolidation process. Otherwise, if the selling pressure deepens, the price gap between 112,000 and 115,000 will be followed as a new test area after the 115,000 level is broken.
Supports 115,000 113,300 112,000
Resistances 116,800 – 117,500 – 118,600
ETH/USDT
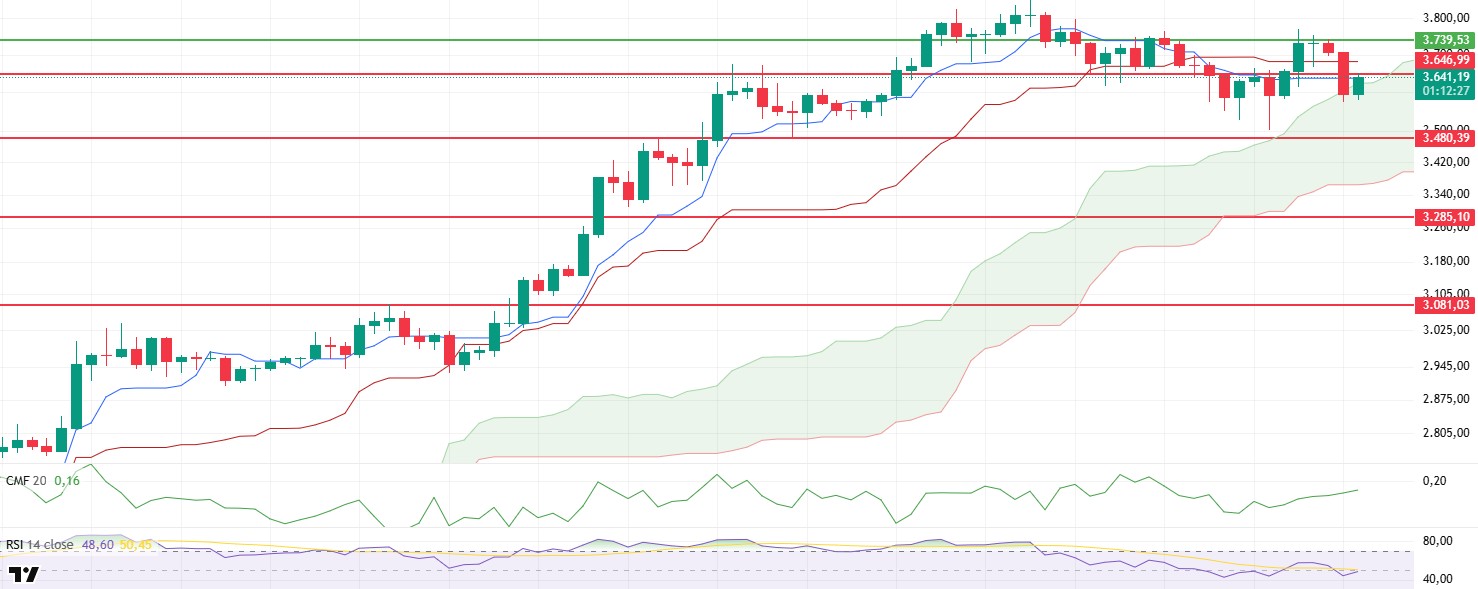
The net inflow of $231 million into ETH ETFs as of July 24 clearly demonstrates that institutional investor interest remains strong. This data supports that capital flows have continued in recent days and long-term expectations for Ethereum are still positive. Looking at the price movements, ETH gained momentum up to $3.770 with a sharp rise after finding strong support at $3.504 yesterday. However, despite this rise, it failed to close above the resistance zone of $3,739, an important threshold. ETH, which suffered a sharp retreat in the morning hours, negatively affected by the decline in Bitcoin price, broke down the support of $3,646 and fell to the upper band of the kumo cloud to $ 3,625. As of now, the price is trying to regain the $3,646 region and if it turns this level into a support position, it may become possible to regain strength in the short-term outlook.
Taking a closer look at the technical indicators, the ichimoku indicator shows that the price continues to stay above the kumo cloud and the overall structure remains positive. However, the tenkan level is still below the kijun level and the price is below both levels, indicating that short-term risks are still in play. This structure points to weak internal dynamics that may limit the upward movement of the price.
Chaikin Money Flow (CMF) indicator continues to trend upwards in positive territory. This indicates that the capital flowing into the market is strong and there is no significant weakening in liquidity. The fact that CMF remains positive also suggests that institutional or large-scale investors are still active in the market and selling pressure has not increased significantly. On the Relative Strength Index (RSI) side, momentum has started to pick up again. The RSI value rose up to the MA baseline and reached the reference level of 50, breaking above the neutral zone. This move can be considered as a signal that gives momentum a renewed buying impetus.
In the light of all these data, it is possible to talk about an upward potential up to $3,739 if the ETH price breaks the $3,646 resistance permanently and holds above it. On the other hand, on the other hand, it should not be ignored that in case of closures below the $3.625 level, which is the upper band of the kumo cloud, the price risks moving downwards again with weakening momentum. Therefore, the price’s reaction between $3.625 and $3.646 during the day is critical for determining the short-term direction.
Top of Form
Below the Form
Supports 3,480 – 3,285 – 3,081
Resistances 3,646 – 3,739 – 4,084
XRP/USDT
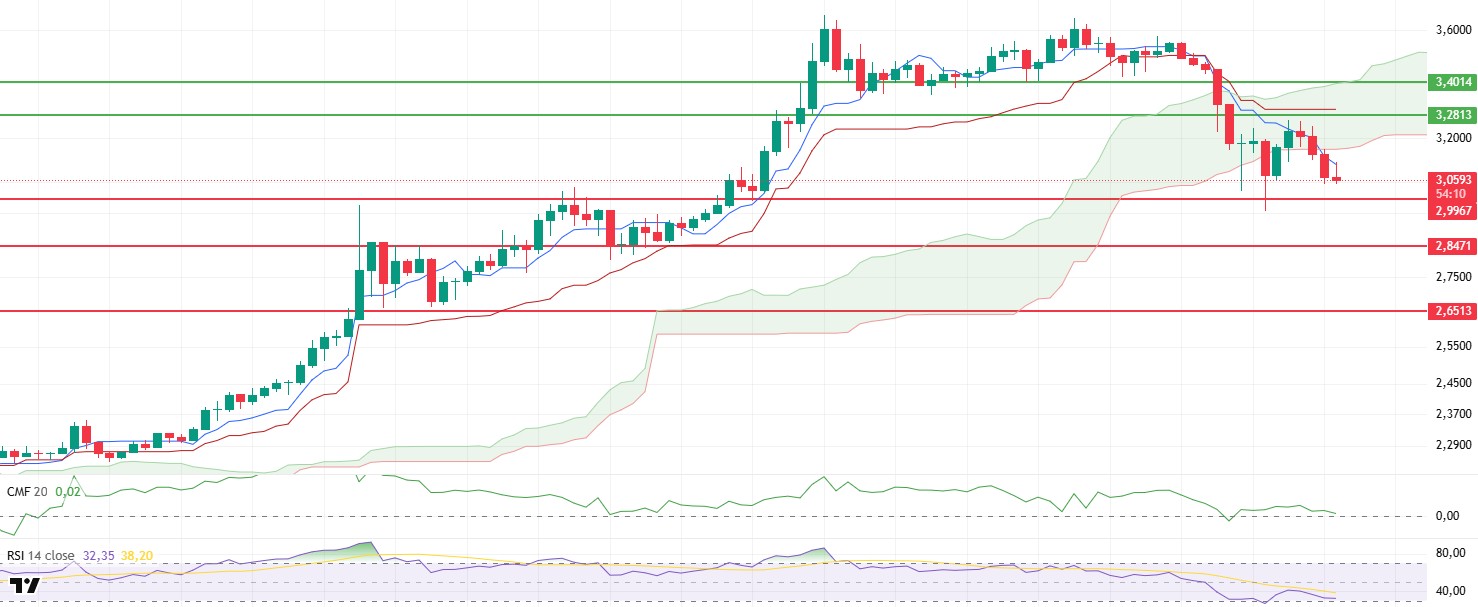
Although XRP made a bullish attempt towards the $3.28 level yesterday evening, it turned its direction down again without managing to reach this critical resistance. In the morning hours, with the selling pressure in the cryptocurrency market in general, XRP price fell again and continued its weak technical outlook by hanging below the lower band of the kumo cloud. This development indicates that negative expectations still remain strong in market perception.
When analyzing the technical indicators, the data provided by the ichimoku indicator is particularly noteworthy. The price closes below the kumo cloud, indicating that the market is still under pressure and the search for direction continues downwards. In addition, the downside break of the tenkan level, which represents the short-term trend, supports that the current technical weakness persists and downside risks are still on the table.
On the Relative Strength Index (RSI) side, the price, which entered the oversold zone with yesterday’s decline, showed a temporary recovery from this level, but with the momentum weakening again, the RSI continues to hover close to the oversold zone. This suggests that buyers are reluctant to return to the market and selling pressure is still in effect. If the RSI remains in this zone, it could be interpreted as a signal that the decline is likely to deepen further.
Within the framework of this technical structure, if the XRP price breaks the support of $2.99 during the day, there is a high probability that the selling pressure will increase further and the price will be exposed to steeper retracements. In the opposite scenario, that is, if the price exceeds the $3.28 resistance and creates a permanent structure above it, it may only be possible to talk about a positive outlook. However, the current pricing behavior suggests that this possibility remains quite weak and the market will follow a cautious course in the short term.
Supports 2.9967 – 2.8471 – 2.6513
Resistances 3.2813 – 3.4014 – 3.8615
SOL/USDT
The Solana Foundation’s 2027 roadmap cites market microstructures as “Solana’s most important challenge today.” Solana’s DeFi Development partnered with Mayan for advanced cross-chain exchange.
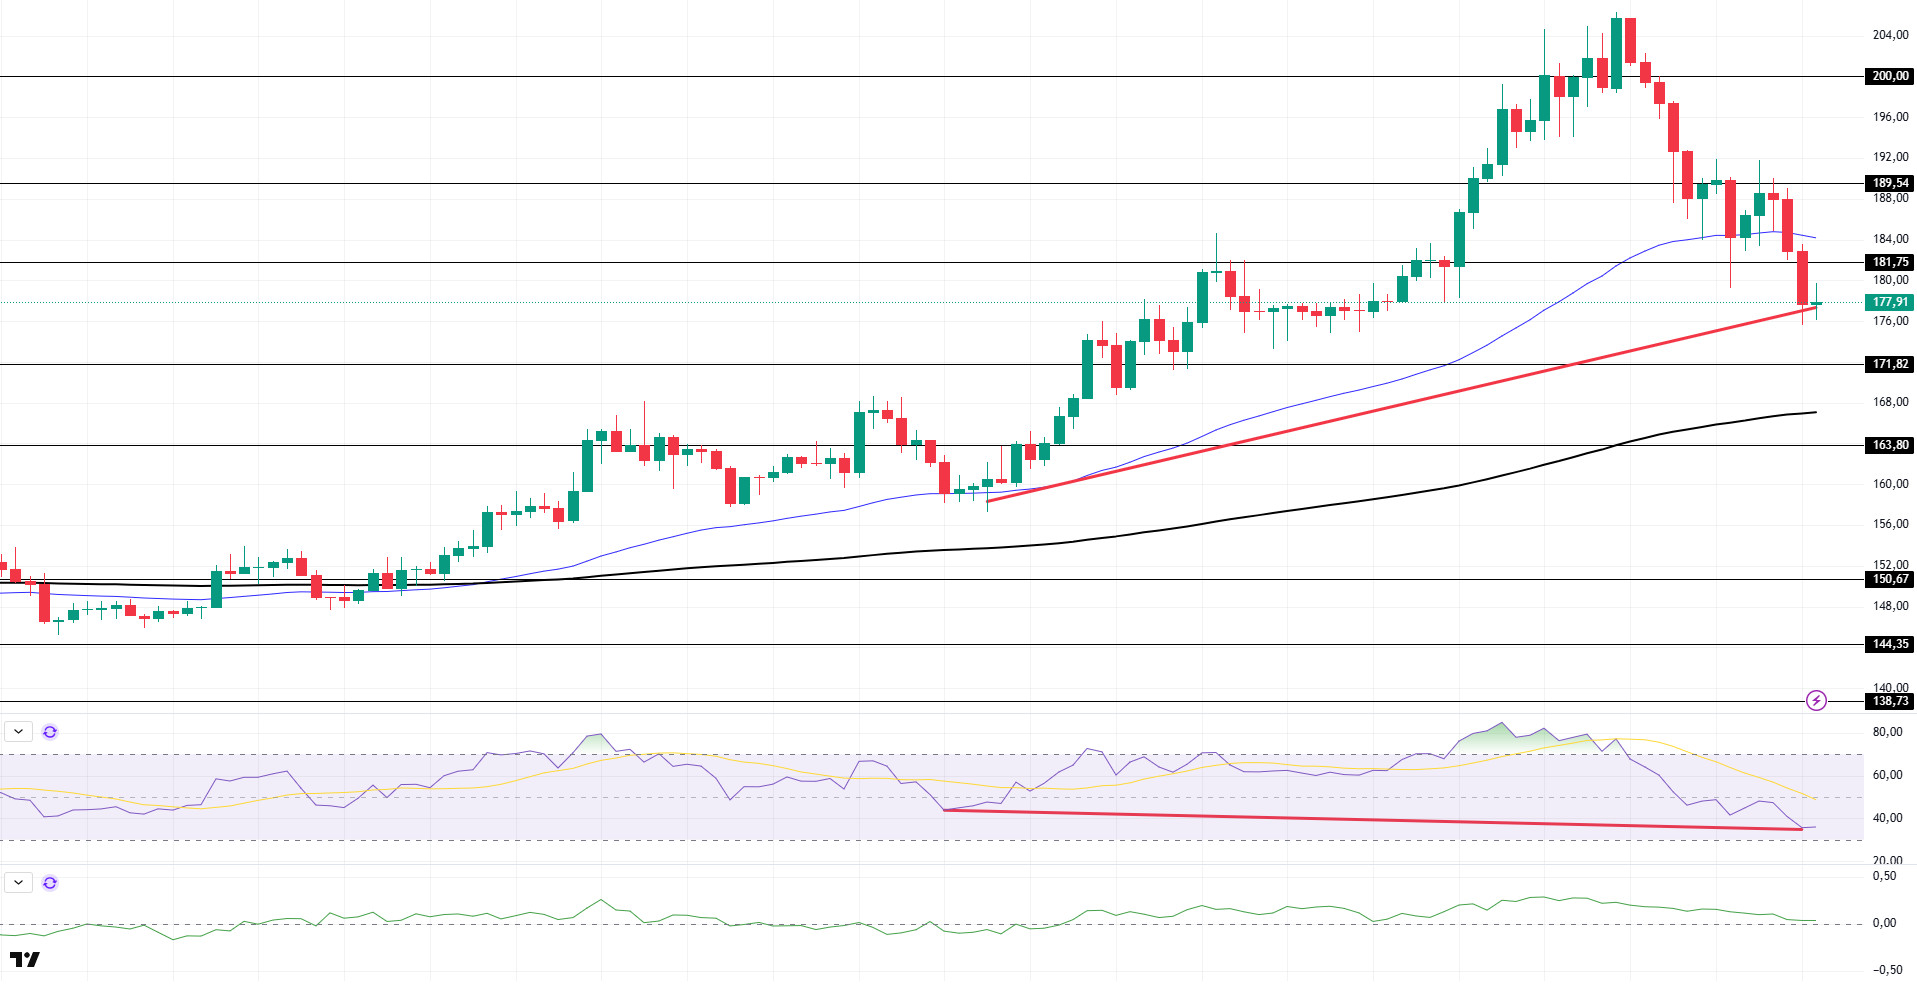
SOL price continued to decline. The asset hit resistance at $189.54 and pulled back, breaking the 50 EMA (Blue Line) moving average to the downside. If the retracement continues, the 200 EMA (Black Line) moving average can be followed. In case of a continuation of the rise, the $ 189.54 level can be followed.
On the 4-hour chart, the 50 EMA (Blue Line) continues to be above the 200 EMA (Black Line). This indicates that the bullish trend may continue in the medium term. At the same time, the fact that the price is between both moving averages suggests that the market is currently in a short-term decision phase. On the other hand, a large difference between the two moving averages may trigger a bearish or sideways trend. Chaikin Money Flow (CMF-20) remained in positive territory. However, a decrease in money inflows may move CMF into negative territory. Relative Strength Index (RSI-14), on the other hand, moved into negative territory and increased selling pressure. However, a positive divergence has formed. This could be a bullish harbinger. The $189.54 level stands out as a strong resistance point in the event of a bullish outcome on the back of macroeconomic data or positive news on the Solana ecosystem. If this level is broken upwards, the rise can be expected to continue. If there are pullbacks due to contrary developments or profit realizations, the $ 171.82 level can be tested. In case of a decline to these support levels, the increase in buying momentum may offer a potential bullish opportunity.
Supports 171.82 – 163.80 – 150.67
Resistances 181.75 – 189.54 – 200.00
DOGE/USDT
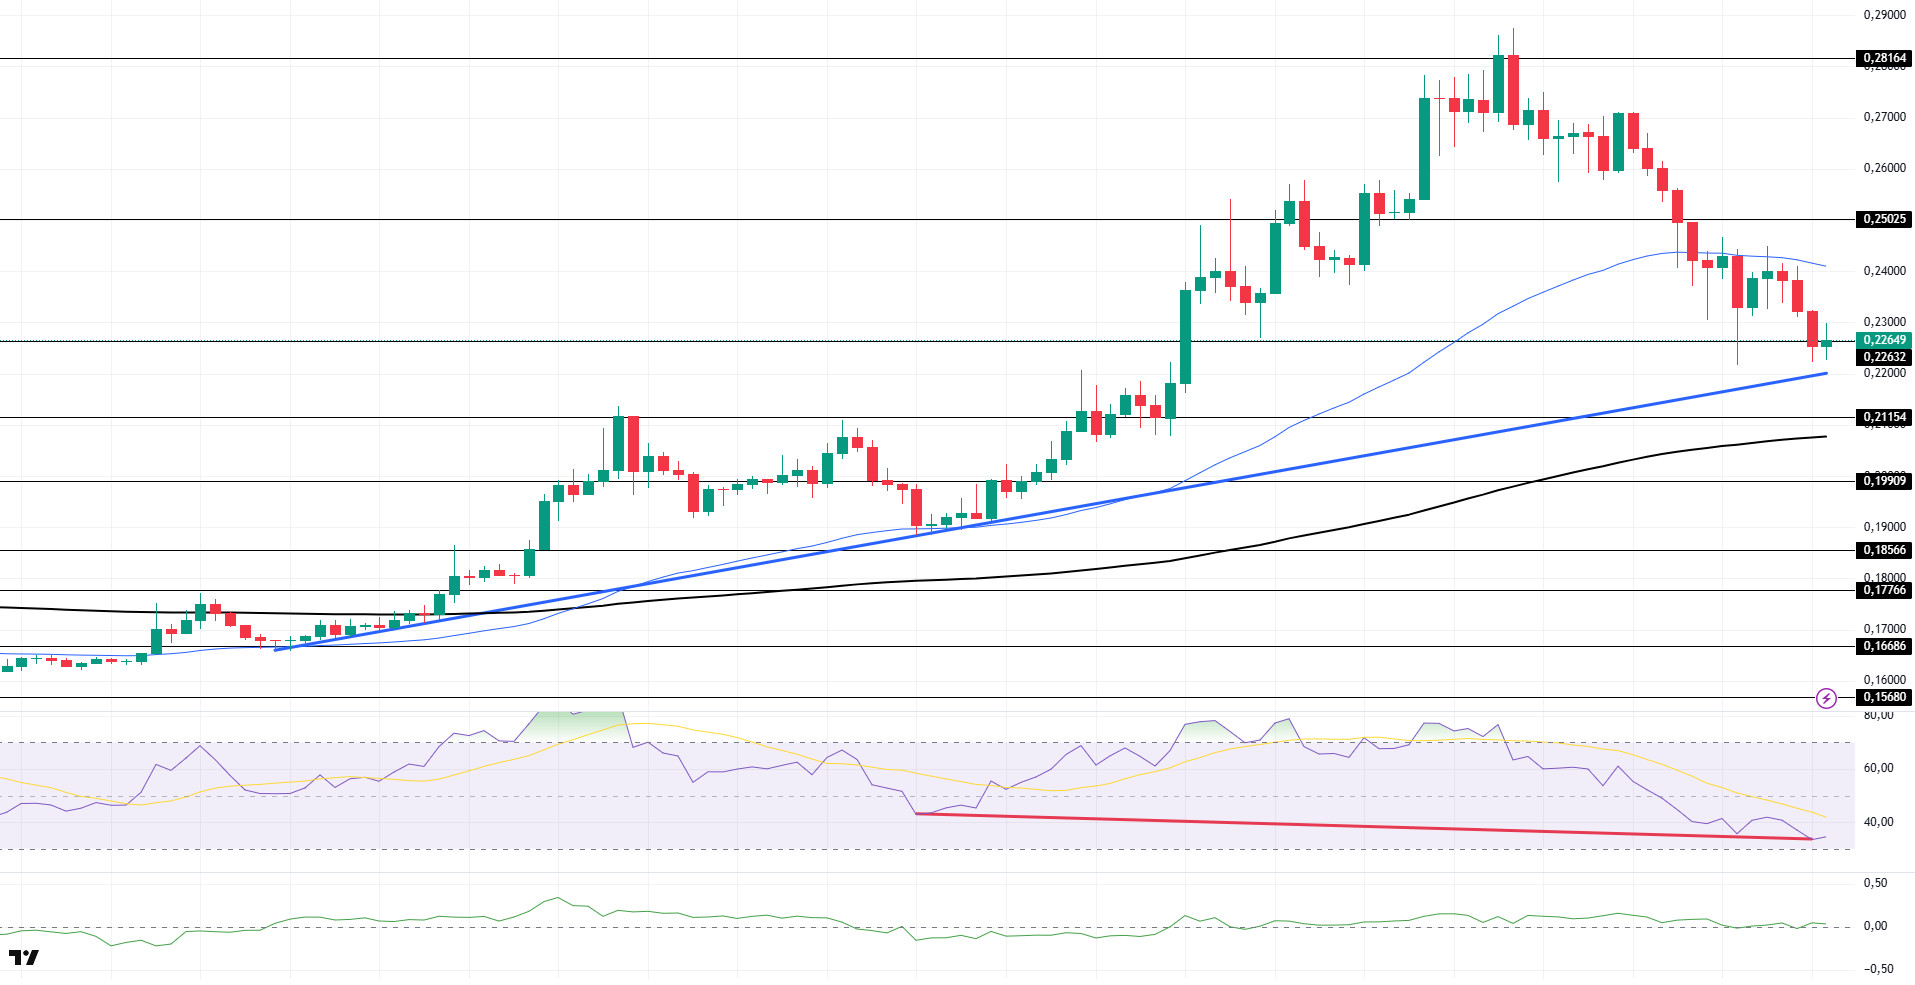
DOGE price continued to depreciate. The asset remained above the 200 EMA (Black Line) moving average, with the uptrend starting on July 7. The price tested the 50 EMA (Blue Line) moving average as resistance and retreated from there. If the pullback continues, the 200 EMA (Black Line) moving average should be followed as a support level. If the upward acceleration starts again, it may test the $ 0.25025 level.
On the 4-hour chart, the 50 EMA (Blue Line) continues to be above the 200 EMA (Black Line). This suggests that the asset is bullish in the medium term. The fact that the price is between both moving averages indicates that the asset is in the decision phase in the short term. A large difference between the two moving averages may cause the price to follow a bearish or sideways trend. Chaikin Money Flow (CMF-20) is in neutral territory. In addition, negative money inflows may move CMF into negative territory. Relative Strength Index (RSI-14) retreated to the middle of the negative zone. In addition, there is a positive mismatch pattern. This may push the price higher. The $0.25025 level stands out as a strong resistance zone in the event of a rally in line with political developments, macroeconomic data or positive news flow in the DOGE ecosystem. In the opposite case or possible negative news flow, the $0.21154 level may be triggered. In case of a decline to these levels, the momentum may increase and a new bullish wave may start.
Supports 0.21154 – 0.19909 – 0.18566
Resistances 0.22632 – 0.25025 – 0.28164
Legal Notice
The investment information, comments and recommendations contained herein do not constitute investment advice. Investment advisory services are provided individually by authorized institutions taking into account the risk and return preferences of individuals. The comments and recommendations contained herein are of a general nature. These recommendations may not be suitable for your financial situation and risk and return preferences. Therefore, making an investment decision based solely on the information contained herein may not produce results in line with your expectations.