
Technical Analysis
BTC/USDT
On the economic front, with the US Federal Reserve keeping interest rates unchanged, markets focused on the Fed’s expectation of two rate cuts beyond 2025. Chairman Powell stated that inflation is above the target, while emphasizing that they are maintaining a “wait-and-see” strategy due to increasing uncertainty and tariffs. Powell once again faced harsh criticism from Trump after his statements. On the political front, while the Trump administration is evaluating military steps against Iran, it was stated that a possible attack attempt could be planned at the weekend. While Iran reiterated that the United States should not be involved in the attack, its missile threats further increased tensions in the region and Israel took the attack to a technological level. On the crypto front, preparations for cryptocurrency regulations in the US Congress continue, while the Genius Stablecoin and Clarity Act is expected to be approved by August, Trump wanted it to pass in the House of Representatives without delay. While there is no development in the data set today, it is stated that the US stock market is closed due to “Independence Day“, while the news flow will be at the focal point of the market.
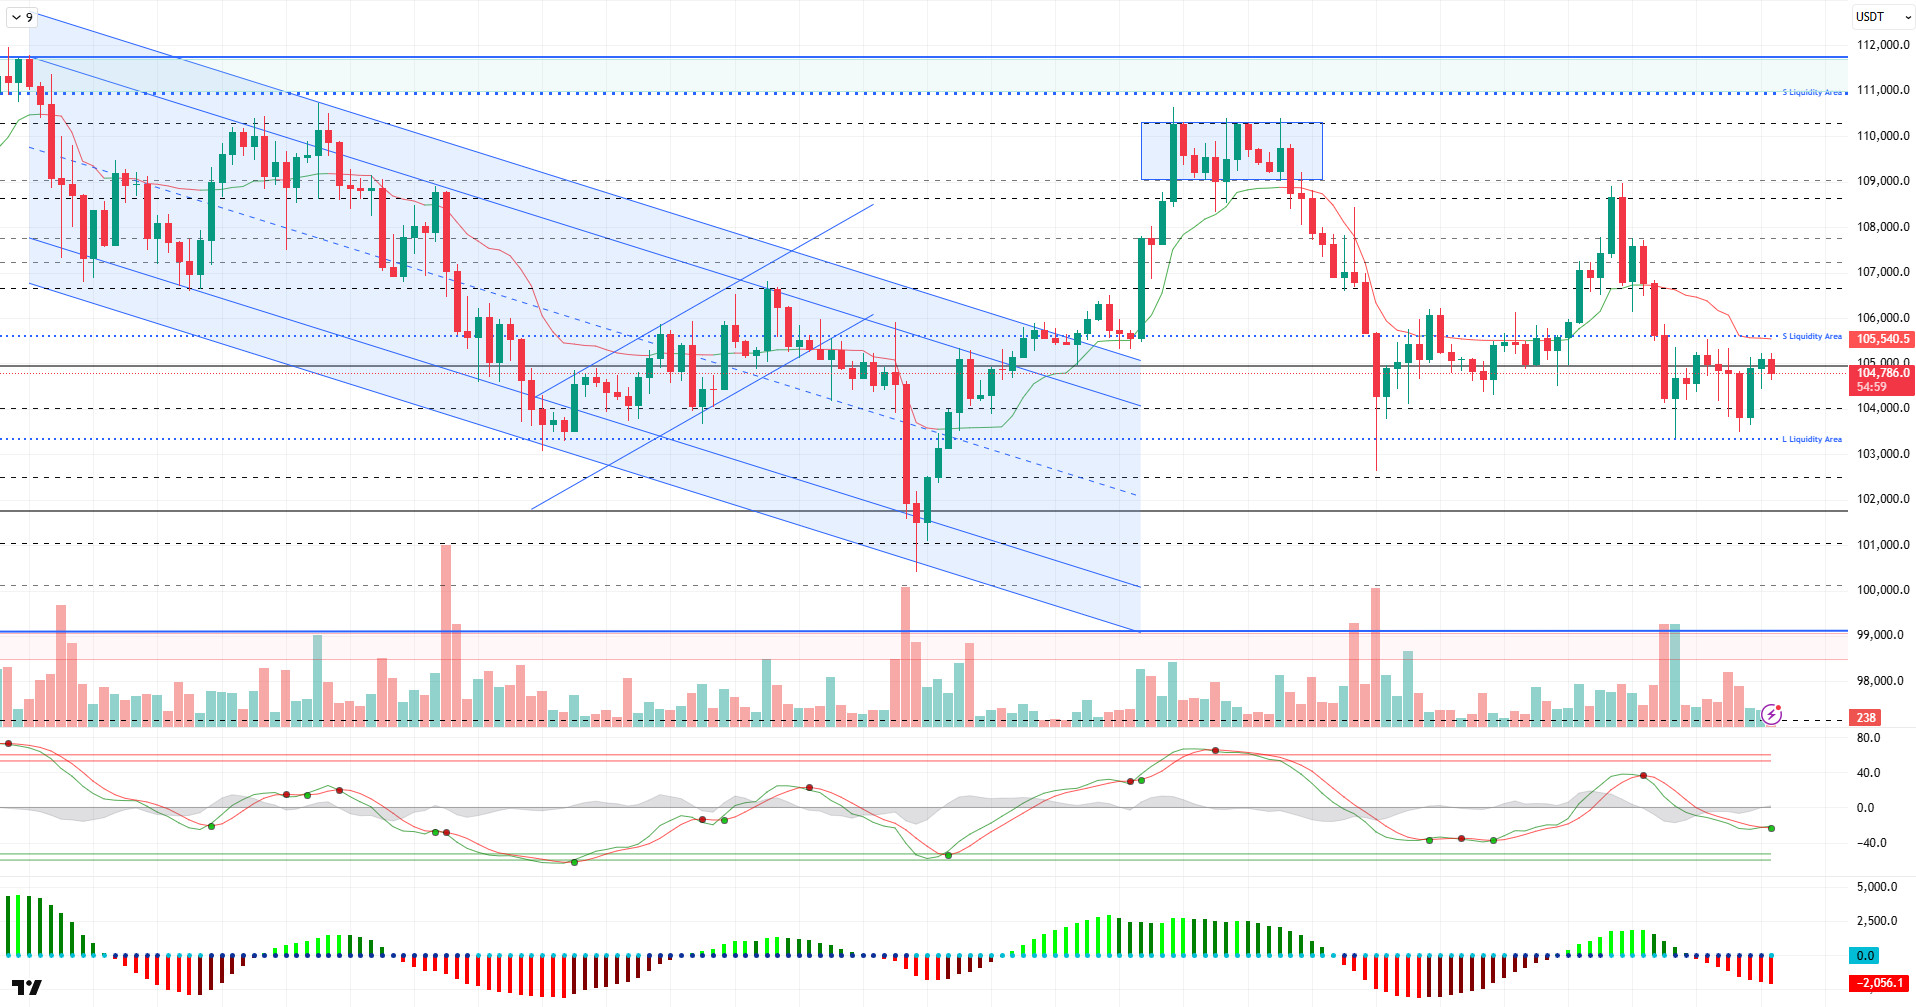
When we look at the technical outlook after all these developments, it is seen that BTC maintains its strong stance within the 104,000-105,000 band in general, although it hangs below the 104,000 level from time to time. As of the writing of the analysis, BTC is trending horizontally at 104,700 levels, just below the 105,000 resistance.
Looking at the technical indicators, the weakening sell signal on the Wave Trend Oscillator is replaced by a buy signal, signaling a short-term technical recovery. The momentum indicator, on the other hand, reached maximum levels in the negative zone, signaling a potential positive reversal. The Kaufman moving average is just above the price at 105,500 and a new uptrend could be triggered if the price breaks above this level.
On the liquidity side, with yesterday’s pullback to 103,400, buying positions decreased, while selling positions were concentrated between 105,700-107,000. This indicates that an upward move may encounter resistance in these areas.
In general assessment, while technical indicators and liquidity data produce signals that BTC may start an upward move, it can be said that the price is still suppressed and moving in a horizontal structure due to the impact of fundamental developments. With a possible increase in volume and volatility, the price can be expected to head towards the resistance and liquidity zone at 106,600. On the other hand, in case of negative developments in the political field, 104,000 and then 103,300 levels will be followed as support. The reactions of the price in this range will be decisive in terms of direction.
Supports 104,000 -103,300 -102,400
Resistances 105,000 – 105,500 -106,600
ETH/USDT
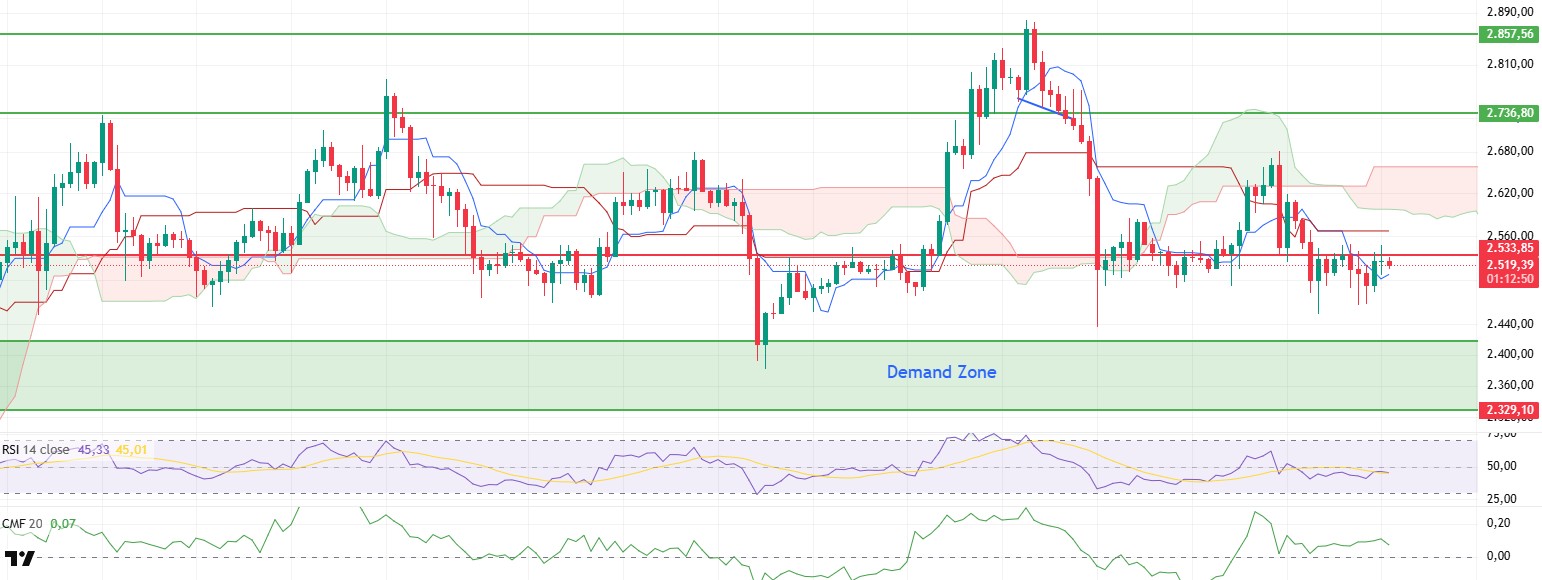
ETH retested the $2,533 level after a slight pullback yesterday evening. However, the rise towards this region was limited due to the lack of sufficient buyer interest and increased selling pressure. The lack of persistence above the $2,533 level reveals that the market has not yet been able to make this level a strong support.
On the technical indicators side, the notable development in the ichimoku indicator was the downward crossing of the tenkan level by the kijun level. Although this intersection is interpreted as a classic sell signal, the fact that the price managed to hold above the tenkan level after this intersection indicates that the short-term positive outlook continues. This suggests that the market is trying to stay strong with reaction buying despite the sell signal.
The Chaikin Money Flow (CMF) indicator is still in positive territory, suggesting that the overall liquidity flow is bullish. However, there is a downward acceleration in the indicator, especially in the morning hours. This weakening suggests that gradual liquidity outflows from the market have started and investors have started to act cautiously in the short term.
The Relative Strength Index (RSI) indicator, on the other hand, continues to remain above the based MA line, indicating that positive momentum continues. However, the slight downward trend in the indicator suggests that the loss of momentum in buying power has begun. This signals that the price may enter a consolidation phase before taking a clear direction in the short term.
Considering this technical outlook, ETH price is likely to follow a sideways trend between $2,500 and $2,533 in the short term. Closes above this price range may allow buyers to regain strength and continue the upward movement. On the other hand, if the price stays below the $2,500 level, the possibility of the price easing towards lower support levels may come to the fore. For this reason, especially intraday closing levels should be closely monitored.
Top of Form
Below the Form
Supports 2,329 – 2,130 – 2,029
Resistances 2,533 – 2,736 – 2,857
XRP/USDT
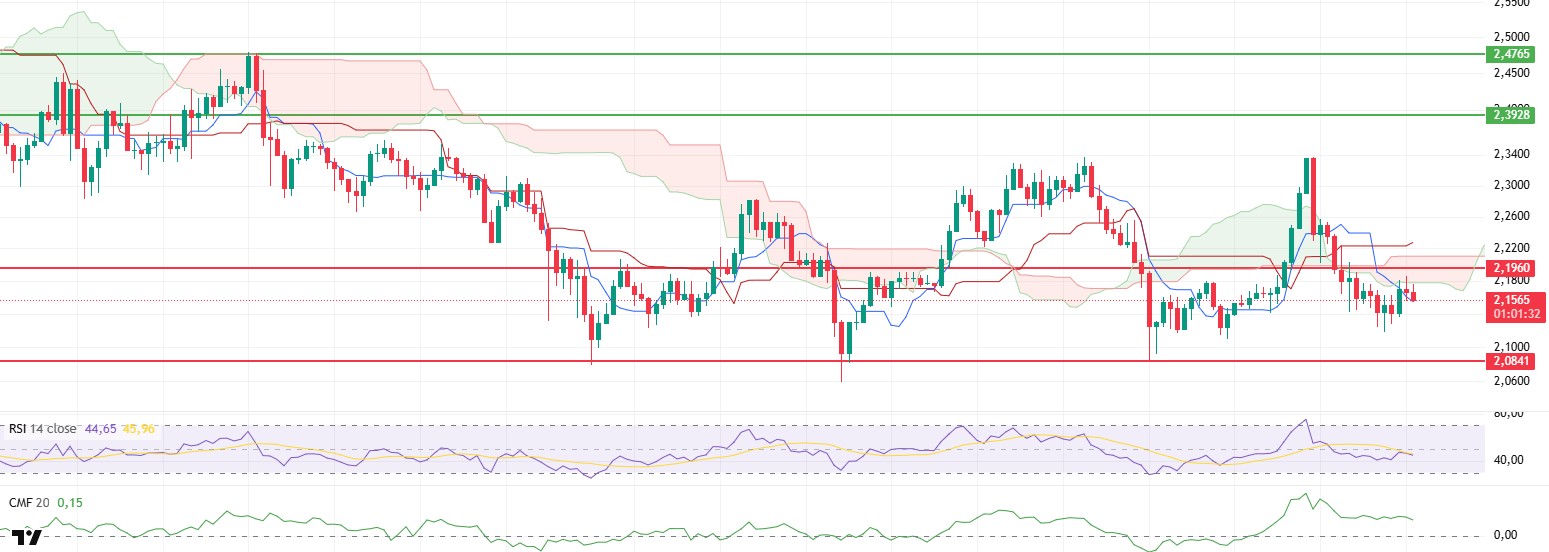
XRP fell as low as $2.11 after losing support from the sand cloud. With the purchases that came in the night hours last night, it managed to rise to the level of $2.17 and climbed to the lower band of the kumo cloud. However, the price, which could not hold at this level, encountered resistance and retreated slightly again. Despite short-term buying, the inability to rise above the cloud level shows that the market still has a weak structure.
The Chaikin Money Flow (CMF) indicator remains in positive territory, confirming that the overall liquidity flow in the market is still bullish. However, the downward movement in the slope of the indicator suggests that gradual outflows on the liquidity side have begun and buyers have weakened in terms of volume. Especially the depreciation in the last hours casts a shadow on the buying momentum.
When the Ichimoku indicator is analyzed, the fact that the price cannot enter the kumo cloud and at the same time remains below the kijun level indicates that the negative trend continues technically. Pricing below the kumo reveals that the market has not been able to accumulate enough strength on the upside breakout and each upward attempt remains limited.
The downward trend is maintained in almost all momentum indicators. The lack of any positive divergence or upward momentum gains supports that the pressure on the price continues technically. The fact that sales movements remain strong causes upward corrections to remain weak.
If the price exceeds the 2.17 – 2.18 dollar band during the day, it has the potential to recover the short-term technical structure. Closures above this level may pave the way for the negative outlook to dissipate and upward price movements to become clearer. Otherwise, it can be expected that the price will move downwards again and loosen towards lower support levels and the current negative structure can be expected to continue.
Supports 2.0841 – 1.9664 – 1.6309
Resistances 2.1960 – 2.3928- 2.4765
SOL/USDT
SOL Strategies filed Form 40-F for listing on the Nasdaq stock exchange.
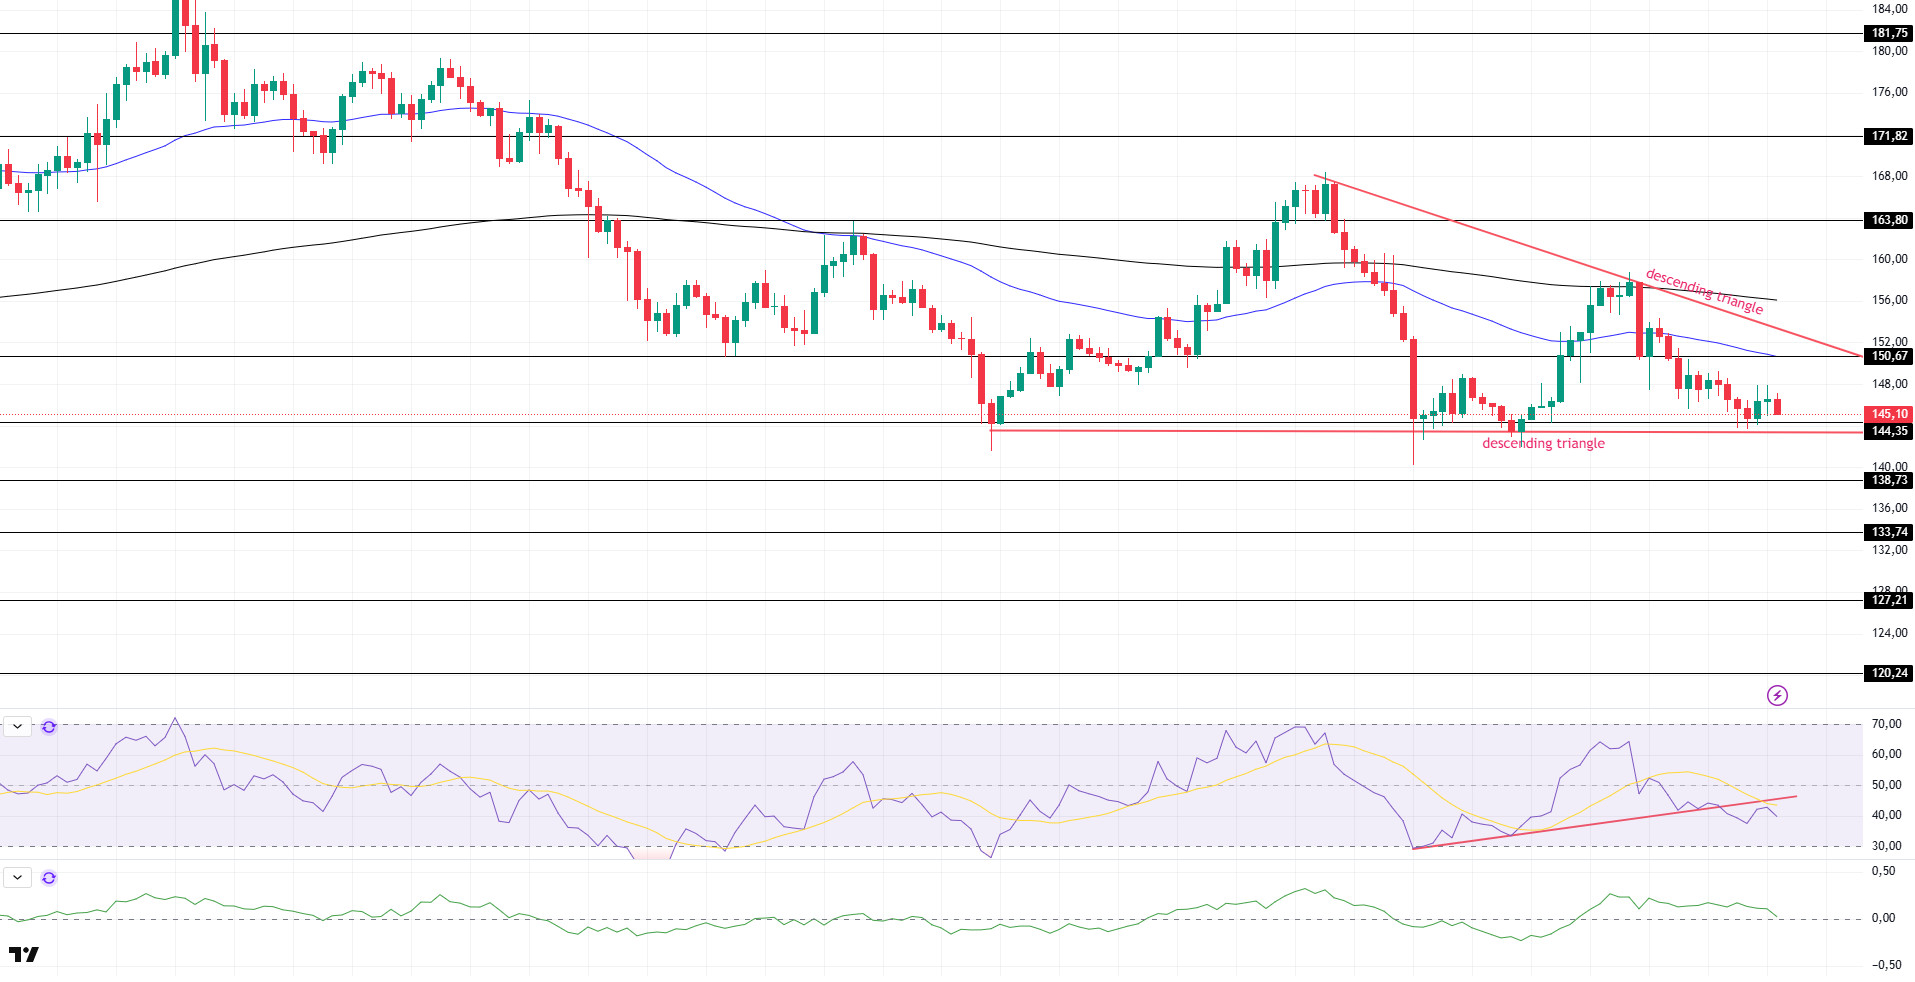
SOL price displayed a slight decline. The asset experienced a slight acceleration with support from the support level of $144.35, which is a strong resistance and the base level of the descending triangle pattern. If the acceleration continues, it may test the $150.67 level and the 50 EMA (Blue Line) moving average as resistance. The retracement may deepen on closes below the base level of the descending triangle pattern.
On the 4-hour chart, the 50 EMA continued to be below the 200 EMA. This suggests that the bearish trend may continue in the medium term. At the same time, the fact that the price is below both moving averages suggests that the market may continue to retrace in the short term at the moment. Chaikin Money Flow (CMF-20) continued to be in positive territory; in addition, a decrease in daily inflows could move CMF into negative territory. Relative Strength Index (RSI-14) continued to be in negative territory. On the other hand, it has broken the uptrend that started on June 13 to the downside. This may trigger a pullback. The $150.67 level stands out as a strong resistance point in case of an uptrend on the back of macroeconomic data or positive news on the Solana ecosystem. If this level is broken upwards, the rise can be expected to continue. If there are pullbacks due to contrary developments or profit realizations, the $144.35 level may be retested. In case of a decline to these support levels, the increase in buying momentum may offer a potential bullish opportunity.
Supports 144.35 – 138.73 – 133.74
Resistances 150.67 – 163.80 – 171.82
DOGE/USDT
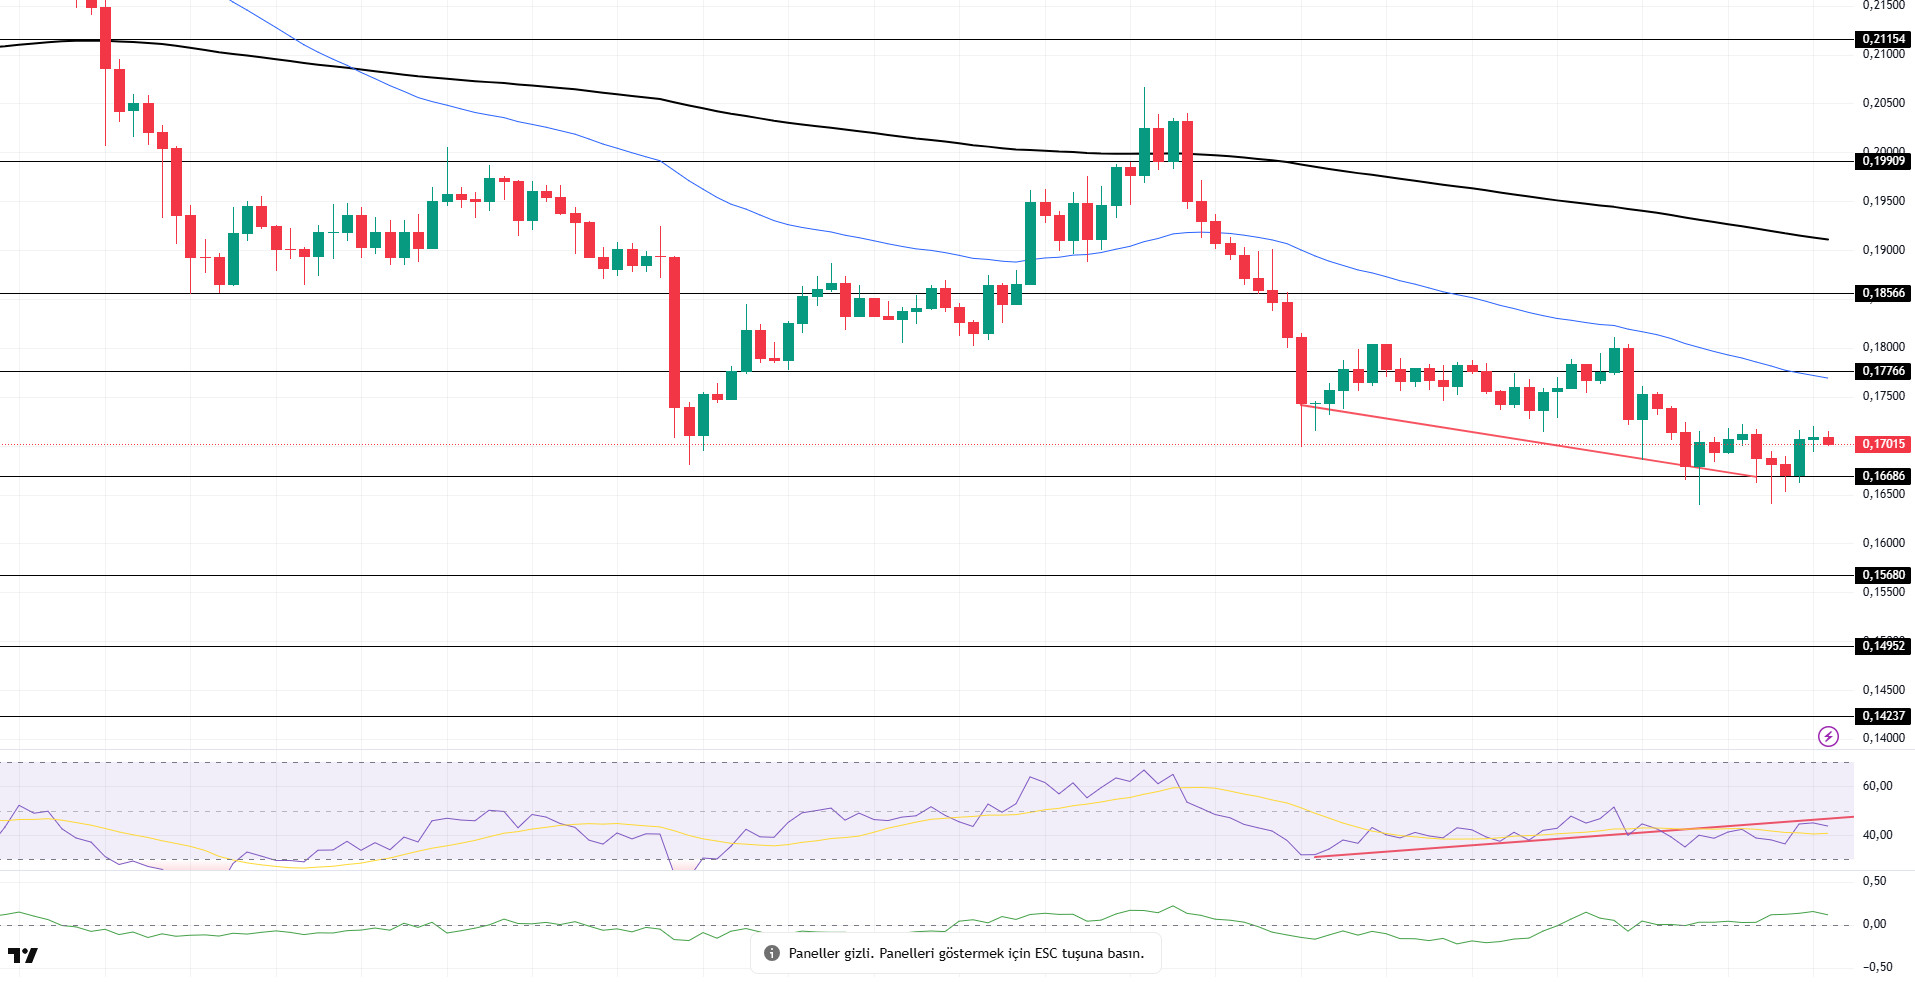
DOGE price experienced a slight decline. The asset, which tested the strong support level of 0.16686 dollars as support, accelerated from here and rose slightly. The retreat may deepen if the candle closure below the strong support level of 0.16686 is realized. Otherwise, the strong resistance level of $0.17766 and the 50 EMA (Blue Line) moving average should be followed.
On the 4-hour chart, the 50 EMA (Blue Line) continues to be below the 200 EMA (Black Line). This suggests that the asset is bearish in the medium term. The fact that the price is below the two moving averages signals a continuation of the asset’s bearish trend in the short term. On the other hand, the fact that the price is away from the two moving averages could be a signal for a rebound. The Chaikin Money Flow (CMF-20) indicator moved into positive territory. In addition; negative money inflows may move CMF into negative territory. Relative Strength Index (RSI-14) continued to be in negative territory. However, it started to be below the uptrend that has formed since June 13 and is currently testing it as resistance. However, positive divergence should be monitored. This could be bullish. The $0.17766 level stands out as a strong resistance zone in the event of a rally in line with political developments, macroeconomic data or positive news flow in the DOGE ecosystem. In the opposite case or possible negative news flow, the $0.15680 level may be triggered. In case of a decline to these levels, the increase in momentum may start a new bullish wave.
Supports 0.16686 – 0.15680 – 0.14952
Resistances 0.17766 – 0.18566 – 0.19909
Legal Notice
The investment information, comments and recommendations contained herein do not constitute investment advice. Investment advisory services are provided individually by authorized institutions taking into account the risk and return preferences of individuals. The comments and recommendations contained herein are of a general nature. These recommendations may not be suitable for your financial situation and risk and return preferences. Therefore, making an investment decision based solely on the information contained herein may not produce results in line with your expectations.