
Technical Analysis
BTC/USDT
In the US, June core PCE was reported at 2.8% year-over-year and 0.3% month-over-month. The data indicated a slow but resilient trend in inflation, in line with expectations. Jobless claims showed a limited increase to 218K. The total crypto asset reserves of publicly traded companies surpassed $100 billion, with a notable increase in Ether investments. U.S.-based Empery Digital increased its total Bitcoin holdings to 3,803 by purchasing an additional 303 BTC.
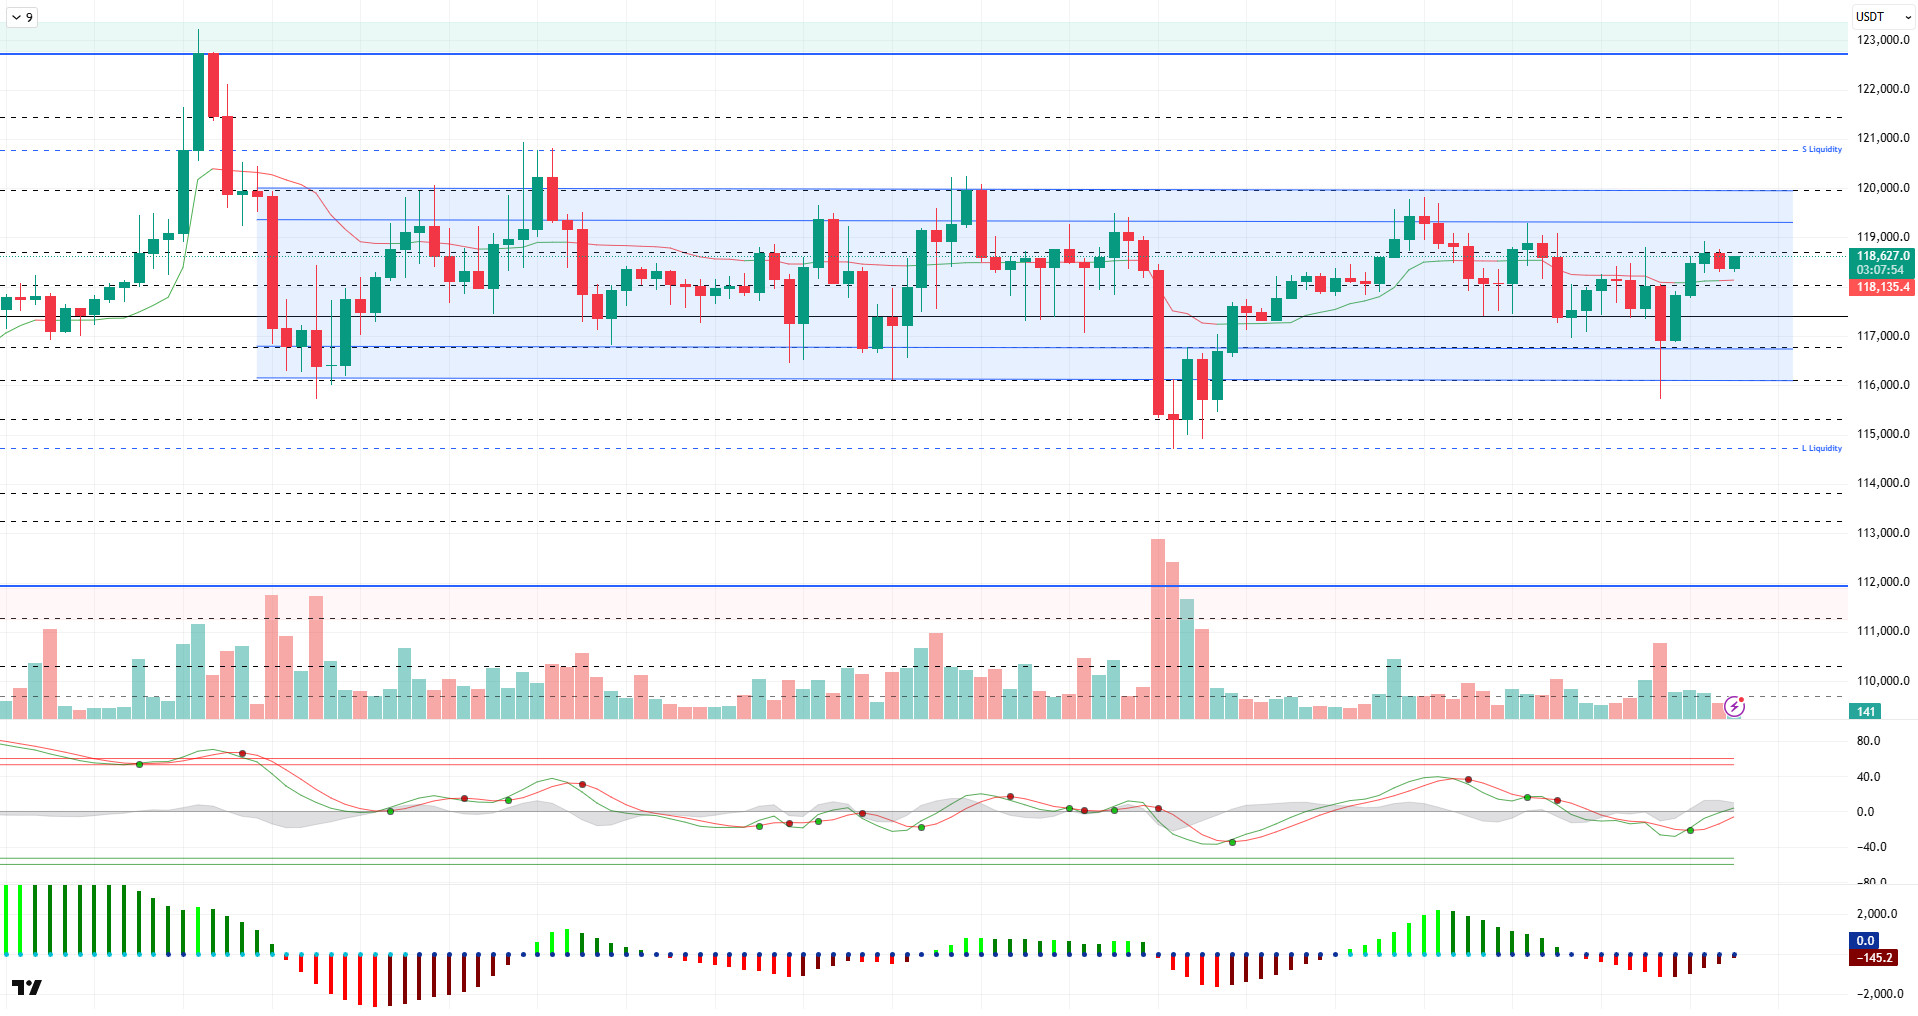
Looking at the technical picture, the price continues to trade at the 118,600 level, showing no significant change compared to the previous analysis.
On the technical indicators front, the Wave Trend (WT) oscillator has been showing an indecisive pattern within the channel’s middle band for an extended period but has once again shifted its direction upward, confirming the upward trend. The Squeeze Momentum (SM) indicator is attempting to regain momentum in the negative zone. The Kaufman moving average is currently below the price level at 118,100.
Looking at liquidity data, buy-side transactions that accumulated at 117,000 and 116,300 levels were liquidated. Meanwhile, intense sell-side transactions continued to increase above the 120,000 level, maintaining their accumulation.
In summary, with the fundamental developments, the BTC price continues to remain in a band close to the ATH level, while the consolidation process has been ongoing since July 14. The technical outlook has shifted to the overbought zone after an indecisive period. Liquidity data continues to point to the 120,000 level. If the price acquires liquidity, it is expected to test above the 120,000 level, while the 117,500 support level can be monitored in the event of a potential sell-off. In the event of a breakout and hourly closes below this level, the 115,000 reference zone will continue to emerge.
Support levels: 118,000 – 117,500 – 116,800
Resistance levels: 118,600 – 120,000 – 120,600
ETH/USDT
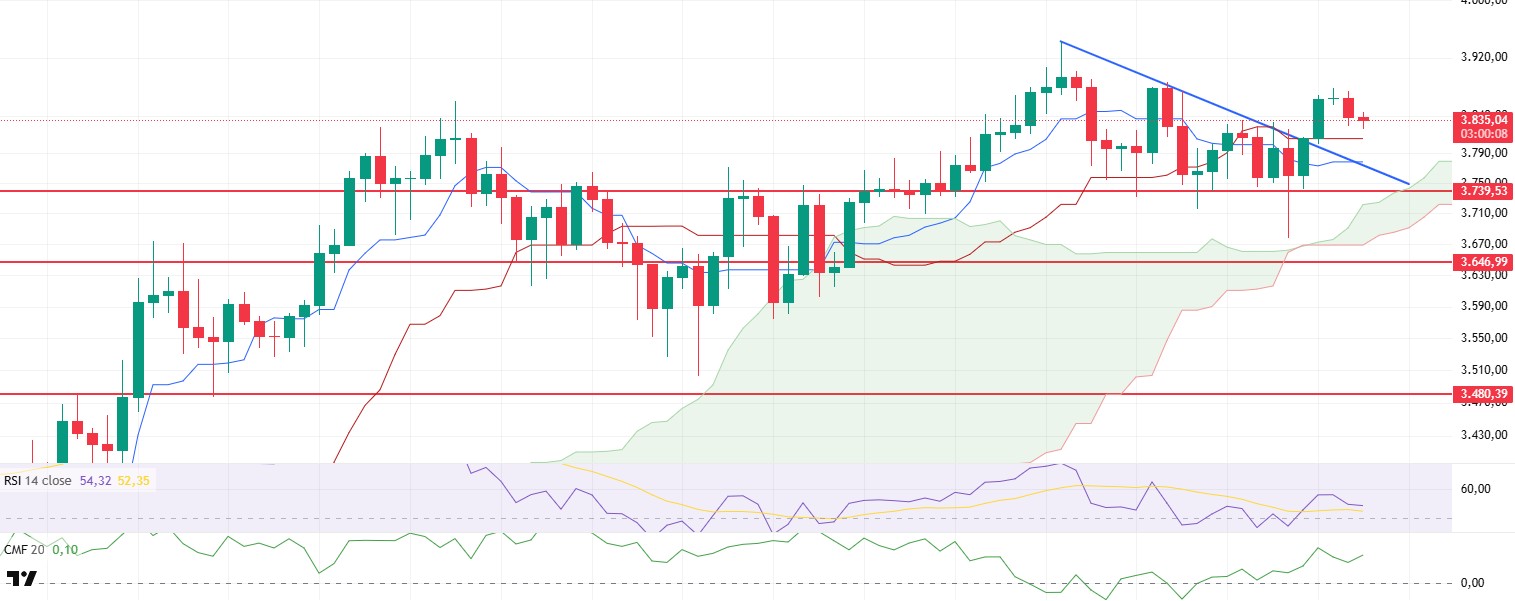
Despite the positive technical outlook during the day, the ETH price came under pressure due to economic data released in the US and fell to $3,820. This pullback once again highlighted the market’s sensitivity to macroeconomic developments, while the weakening technical indicators also supported this movement. In particular, the downward movement in the Relative Strength Index (RSI) clearly indicates a weakening in buying pressure and a loss of momentum. This suggests that if the price drops below the kijun level within the Ichimoku cloud during the evening hours, the decline could deepen further.
Despite this, the Chaikin Money Flow (CMF) indicator shows a limited pullback during the day but remains in positive territory. This structure indicates that liquidity inflows continue in the market and that buyers remain active. The positive outlook of the CMF reveals that the price maintains its strong demand trend in the overall structure despite possible short-term corrections.
In this context, movements between the $3,800 and $3,900 levels in the evening hours may be decisive in determining the direction. In particular, while the $3,800 level stands out as an intermediate support, a downward break of this region may bring the $3,739 support back into focus. On the other hand, if the price breaks above the 3,900 dollar level and maintains its position above this region, it could increase the likelihood of a recovery and pave the way for an upward momentum. The overall outlook requires a cautious and vigilant monitoring process, given the mixed signals from technical indicators and the impact of macroeconomic developments.
Support levels: 3,739 – 3,646 – 3,480
Resistances: 4,084 – 4,381 – 4,857
XRP/USDT
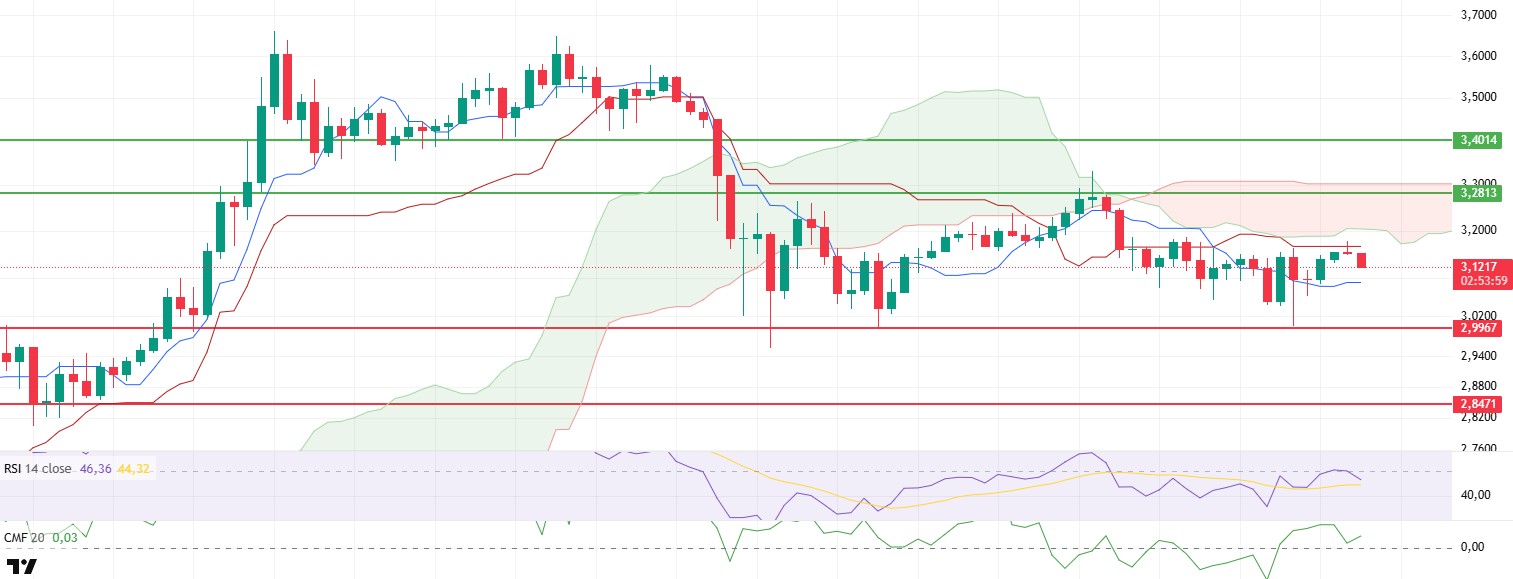
Although the XRP price rose with upward momentum during the day to reach the kijun level, it retreated slightly to the $3.12 level due to selling pressure from this region. This movement indicates that the market is open to profit-taking in the short term and that selling pressure has re-emerged at certain technical levels. In particular, the price’s inability to sustain its intraday upward movement can be interpreted as a sign of weakening momentum and market indecision.
The Chaikin Money Flow (CMF) indicator, on the other hand, fell to the zero line during the day, signaling a short-term weakness in liquidity, but rebounded from this level and returned to positive territory. The CMF’s continued upward movement in the positive zone indicates that there are still strong liquidity inflows in the market and that buyers remain active. This suggests that, despite pullbacks, the market continues to find structural support and that the upward potential has not completely weakened.
When examining the Ichimoku indicator, it can be seen that the price continues to move tightly between the Tenkan and Kijun levels. This structure indicates that the direction of the market is still unclear and that uncertainty persists in short-term pricing. In particular, a break above or below these two levels could emerge as an important signal that could determine the direction of the price in the short term.
When the technical outlook is evaluated overall, the price is expected to continue consolidating within a wide band between $3.28 and $2.99. Breakouts at the upper or lower limits of this range could pave the way for more aggressive and directional movements. In the event of an upward breakout, buyers may regain momentum, while a downward breakout could intensify selling pressure and lead to sharper declines. Therefore, these levels should be closely monitored, and a cautious approach should be adopted in anticipation of potential breakouts.
Supports: 2.9967 – 2.8471 – 2.6513
Resistances: 3.2813 – 3.4014 – 3.8615
SOL/USDT
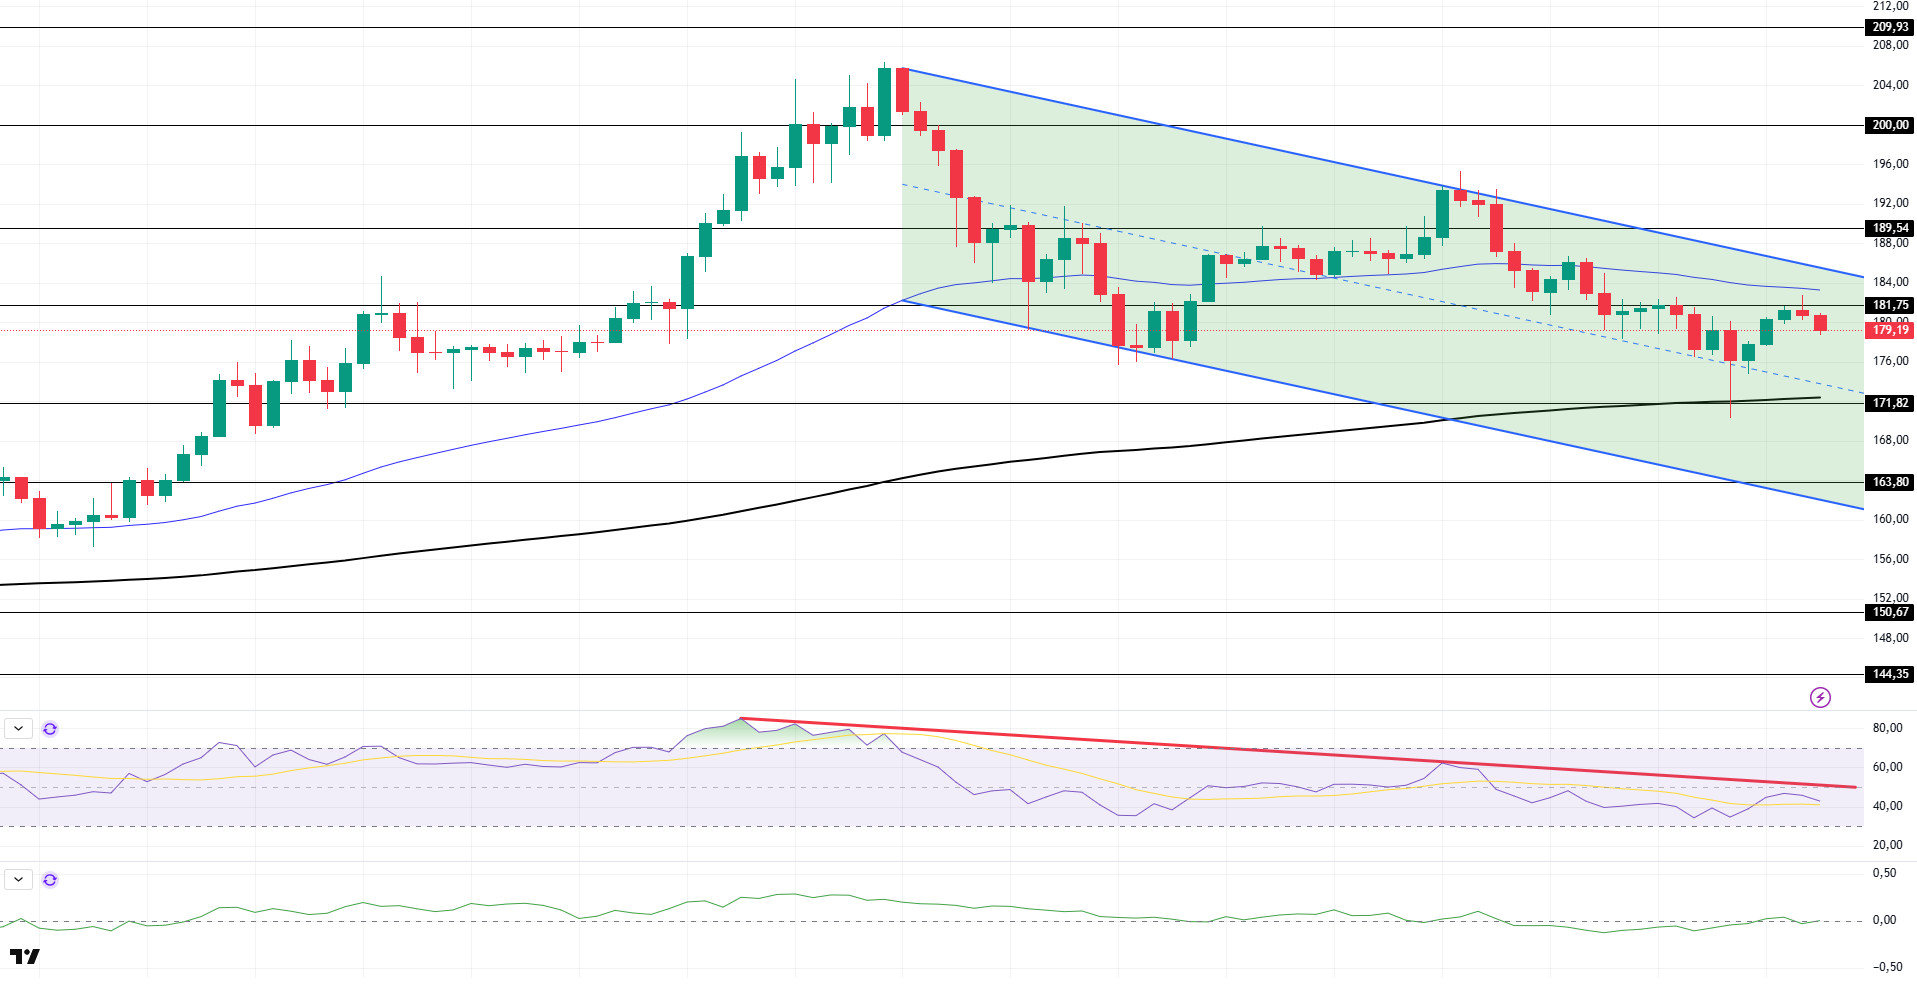
The SOL price remained flat during the day. The asset continued to remain within the downward trend that began on July 23. The price tested the strong resistance level of $181.75 and the 50 EMA (Blue Line) levels, but lost momentum after encountering resistance there and fell. If the pullback continues, the 200 EMA (Black Line) moving average can be monitored. If the upward trend continues, the 189.54 dollar level can be monitored.
On the 4-hour chart, the 50 EMA (Blue Line) remains above the 200 EMA (Black Line). This indicates that the upward trend may continue in the medium term. Additionally, the price being between the two moving averages suggests that the market is currently in a decision phase. The Chaikin Money Flow (CMF-20) has begun to move toward neutral territory. However, a decrease in money inflows could push the CMF into negative territory. The Relative Strength Index (RSI-14) has continued to remain below the downward trend that began on July 21. In the event of an upward movement due to macroeconomic data or positive news related to the Solana ecosystem, the $189.54 level emerges as a strong resistance point. If this level is broken upward, the upward trend is expected to continue. In the event of a pullback due to adverse developments or profit-taking, the $171.82 level could be tested. A decline to these support levels could see an increase in buying momentum, presenting a potential opportunity for an upward move.
Support levels: 171.82 – 163.80 – 150.67
Resistance levels: 181.75 – 189.54 – 200.00
DOGE/USDT
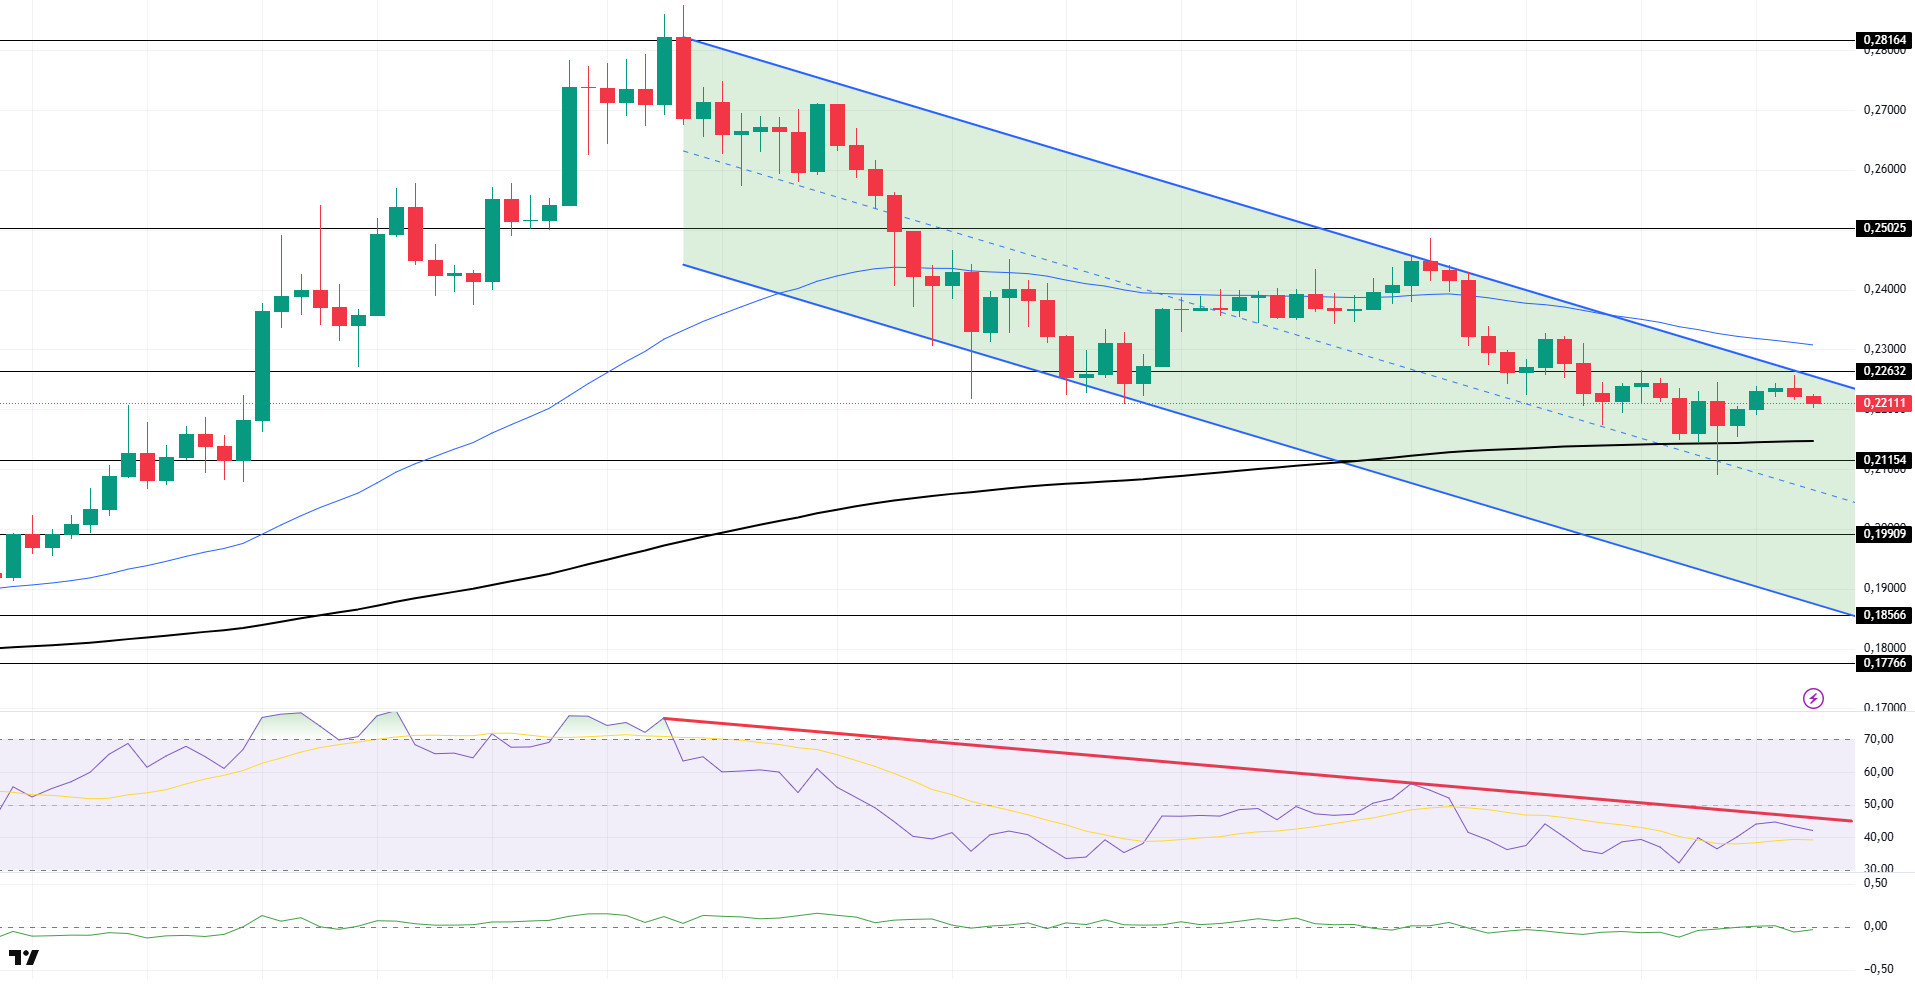
The DOGE price continued its horizontal movement during the day. The asset faced resistance at the top of the downward trend that began on July 21 and at the $0.22632 level and remained within the trend. In case of a continued pullback, the $0.21154 level and the 200 EMA (Black Line) level can be monitored as support. If an upward movement begins, the 0.22632-dollar level should be monitored.
On the 4-hour chart, the 50 EMA (blue line) remains above the 200 EMA (black line). This indicates that the asset is in an upward trend in the medium term. The price being between the two moving averages indicates that the asset is in a decision phase in the short term. Chaikin Money Flow (CMF-20) remained in negative territory. Additionally, negative cash inflows could push the CMF further into the negative zone. The Relative Strength Index (RSI-14) remains in the negative zone. Furthermore, it remains below the downward trend that began on July 21. This could continue the downward movement. In the event of upward movements driven by political developments, macroeconomic data, or positive news flow within the DOGE ecosystem, the $0.25025 level emerges as a strong resistance zone. In the opposite scenario or in the event of negative news flow, the 0.21154 dollar level could be triggered. A decline to these levels could increase momentum and potentially initiate a new upward wave.
Support levels: 0.21154 – 0.19909 – 0.18566
Resistance levels: 0.22632 – 0.25025 – 0.28164
Legal Notice
The investment information, comments, and recommendations contained herein do not constitute investment advice. Investment advisory services are provided individually by authorized institutions taking into account the risk and return preferences of individuals. The comments and recommendations contained herein are of a general nature. These recommendations may not be suitable for your financial situation and risk and return preferences. Therefore, making an investment decision based solely on the information contained herein may not produce results in line with your expectations.

