
Technical Analysis
BTC/USDT
While the new tax model prepared by the Trump administration in the US aims to restore R&D incentives to companies, in Asia, the Bank of Japan’s message of continuing its tightening policy and China’s growth-supportive policy framework are drawing attention. On the geopolitical front, limited progress in the Russia-Ukraine peace process and statements regarding the US’s possible mediation role stand out, while pressure from Congress in Washington to integrate crypto assets into retirement plans is sparking a new debate on digital asset regulations.
From a technical perspective, BTC entered a consolidation phase within a horizontal band after losing its triangle structures in the previous analysis. The price, which occasionally spikes below the reference level of 90,000 points, manages to break above this region. Yesterday, the price once again demonstrated a similar movement, rising above the 92,000 level.
Technical indicators show that the Wave Trend (WT) oscillator has reversed its sell signal in the channel midband to a buy signal. The histogram on the Squeeze Momentum (SM) indicator is in the negative zone with divergence. The Kaufman Moving Average (KAMA) is currently trading below the price at the $90,900 level.
According to liquidation data, although the short-term buying level at 89,000 was partially liquidated during the recent decline, investors who saw the decline as an opportunity recorded more intensity. Short-term sell-side transactions are concentrated in the 94,500–95,800 range. In the monthly view, it continues to maintain its concentration within the 97,000–98,000 range.
In summary, although the Fed cut interest rates as expected, it emphasized that uncertainties regarding the course of policies for the coming year remain. On the other hand, another important development that caught the attention of the markets was the Fed’s preparation to expand its balance sheet by repurchasing short-term Treasury bills. In contrast, the BOJ’s decision to raise interest rates by 25 basis points at its December meeting is the most important factor for markets to monitor in the coming days. On the technical side, BTC, which retreated to the 80,500 level following the downtrend that began after its all-time high (ATH), rebounded strongly from this region. It then settled above the 90,000 level and continues to trade there. Liquidity data shows that target zones have regained importance and the market has stabilized, but the intensity of the selling pressure has increased. After this stage, the 90,000 level has become critical again for the price to maintain its momentum. Closings and pricing above this level are an important indicator for regaining momentum. In this context, 95,000 stands out as the next target area, and once it is passed, liquidity areas will be monitored again. In the event of possible selling pressure, 90,000 stands out again as the reference area, and in the event of a breakout, the 88,000 level, which is the point where the major uptrend passed, will be monitored.
Supports: 90,000 – 89,000 – 88,000
Resistances: 91,400 – 92,600 – 94,000

ETH/USDT
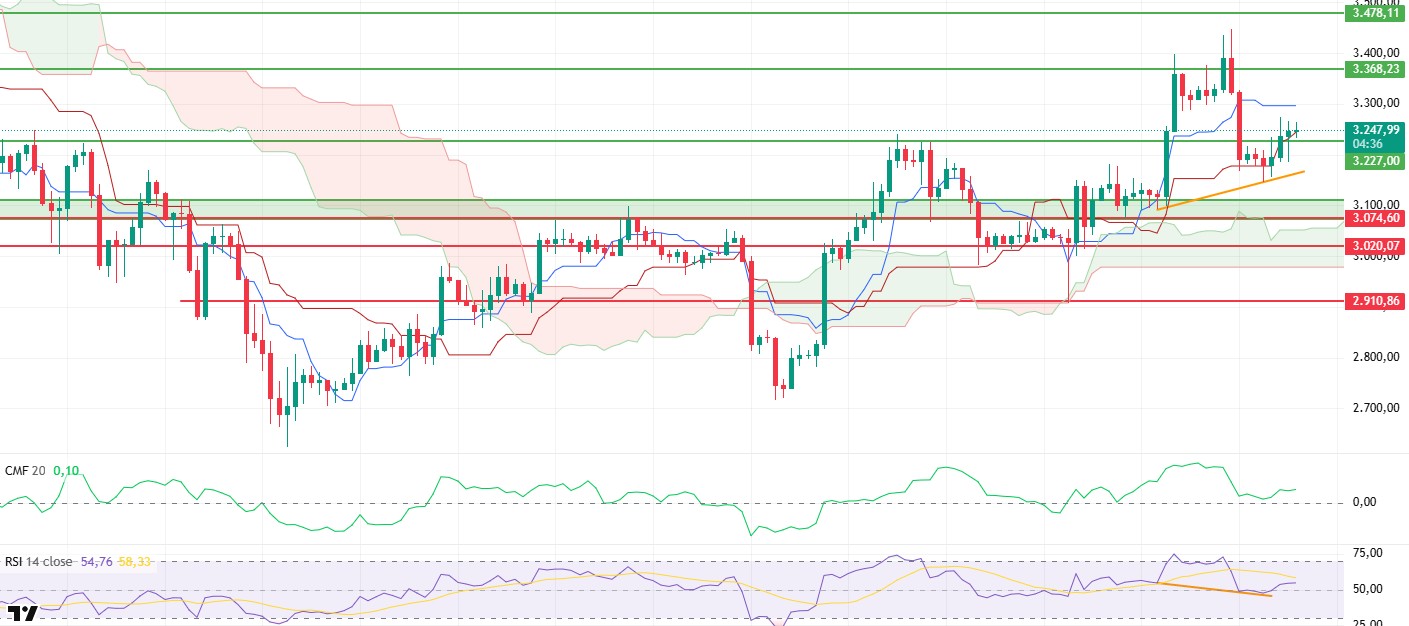
The ETH price broke through the expected resistance level of $3,227 yesterday evening and rose to $3,270 with increased buying. The fact that there was no sharp sell-off after this move and that the price stabilized around $3,250 shows that the rise is still under control and progressing healthily. The horizontal and tight structure seen in previous days has given way to a clearer search for direction.
The liquidity outlook has improved significantly. The Chaikin Money Flow (CMF) indicator has started moving upward again, indicating that capital inflows into the market have increased and buyers have become more eager. This recovery in CMF suggests that the recent rise is not only price-driven but also liquidity-supported.
The picture is also positive on the momentum side. Although the Relative Strength Index (RSI) maintains its calm course, it continues its upward trend, showing that buyers have not completely lost momentum. The RSI’s support for the rise without entering the overbought zone indicates that the price has room to move higher for a while longer.
The positive structure continues in the Ichimoku indicator. The price remaining above the Kijun level and approaching the Tenkan line indicates that short-term strength is continuing. While the upward slope of the Kumo cloud is maintained, the price moving above the cloud confirms that the medium-term trend is still in favor of buyers.
In the current pricing structure, the $3,227 level continues to be the main reference point. As long as it remains above this level, upward movement is likely to continue, and the price may test above $3,270 again. Conversely, if it falls back below $3,227, a short-term pause may occur, and lower levels may be tested. The overall outlook indicates that the positive trend is maintained on the ETH side in terms of liquidity and technical structure.
Below the Form
Supports: 3,227 – 3,074 – 3,020
Resistances: 3,368 – 3,478 – 3,672
XRP/USDT
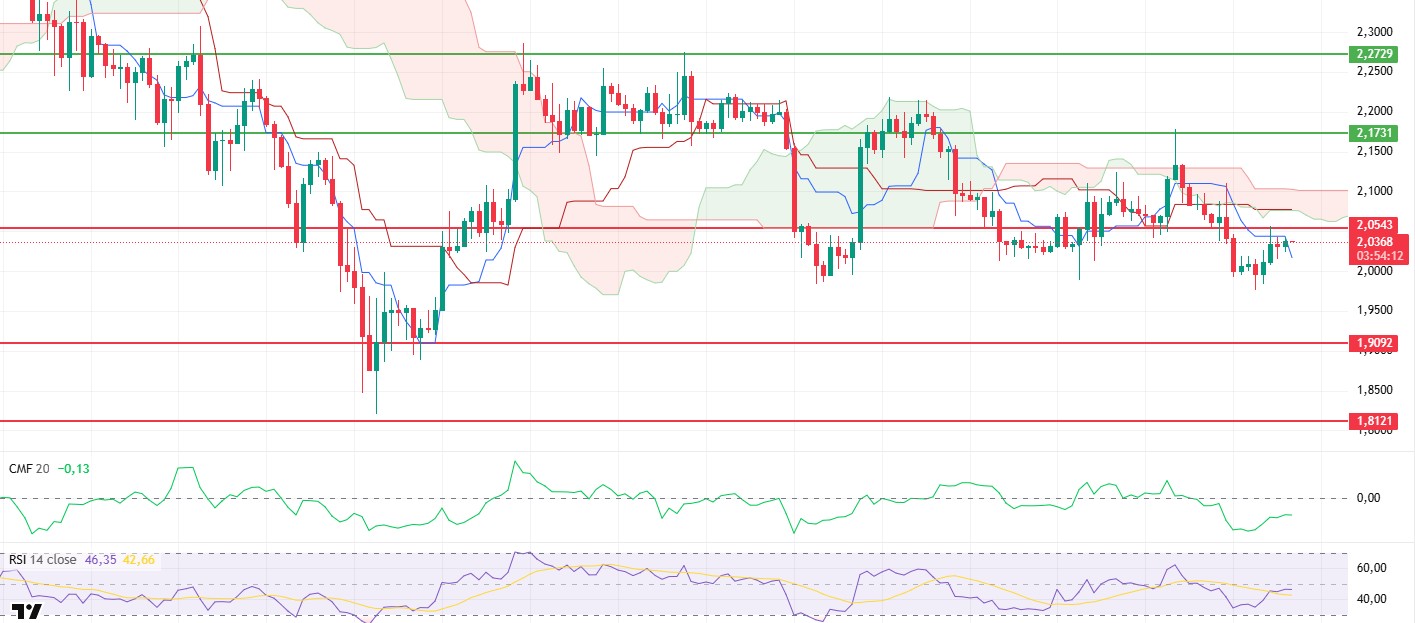
The XRP price tested the $2.05 resistance level during the day with a recovery attempt, but it experienced a slight pullback after failing to gain sufficient buying power at this level. The price’s retreat from this area indicates that upward movements remain under pressure in the short term and that the market continues to move cautiously.
On the liquidity side, a limited but positive divergence is noteworthy. Although the Chaikin Money Flow (CMF) indicator remains in negative territory, its upward trend suggests that selling pressure is beginning to weaken and that gradual liquidity inflows are forming from low levels. While this structure is not yet sufficient for a strong uptrend, it suggests that declines are not as easy as they used to be.
A more positive picture is beginning to emerge on the momentum front. The Relative Strength Index (RSI) indicator rising above its MA line suggests that short-term momentum is entering a recovery phase. While this movement by the RSI increases the po tential for prices to test higher levels again, it does not yet provide sufficient confirmation of a trend reversal.
The Ichimoku indicator continues to show a weak outlook. The price is still trading below the kumo cloud, and the risk of upward attempts being suppressed persists as long as a sustainable structure above the Tenkan and Kijun levels has not formed. The technical structure indicates that recovery efforts remain fragile.
From a current pricing perspective, the $2.05 level retains its importance. As long as sustainability above this region cannot be achieved, downside risks may remain on the table, and the price could face pressure to return to the $1.95–$1.90 range. Conversely, if liquidity inflows increase and the recovery in the RSI continues, the price may gain momentum to settle back above $2.05 in the short term. For the direction to become clear, this recovery in technical indicators will need to be supported by the price.
Supports: 1.9092 – 1.8121 – 1.6224
Resistances: 2.0543 – 2.1731 – 2.2729
SOL/USDT
J.P. Morgan issued $50 million in U.S. commercial paper on Solana for Galaxy Digital.
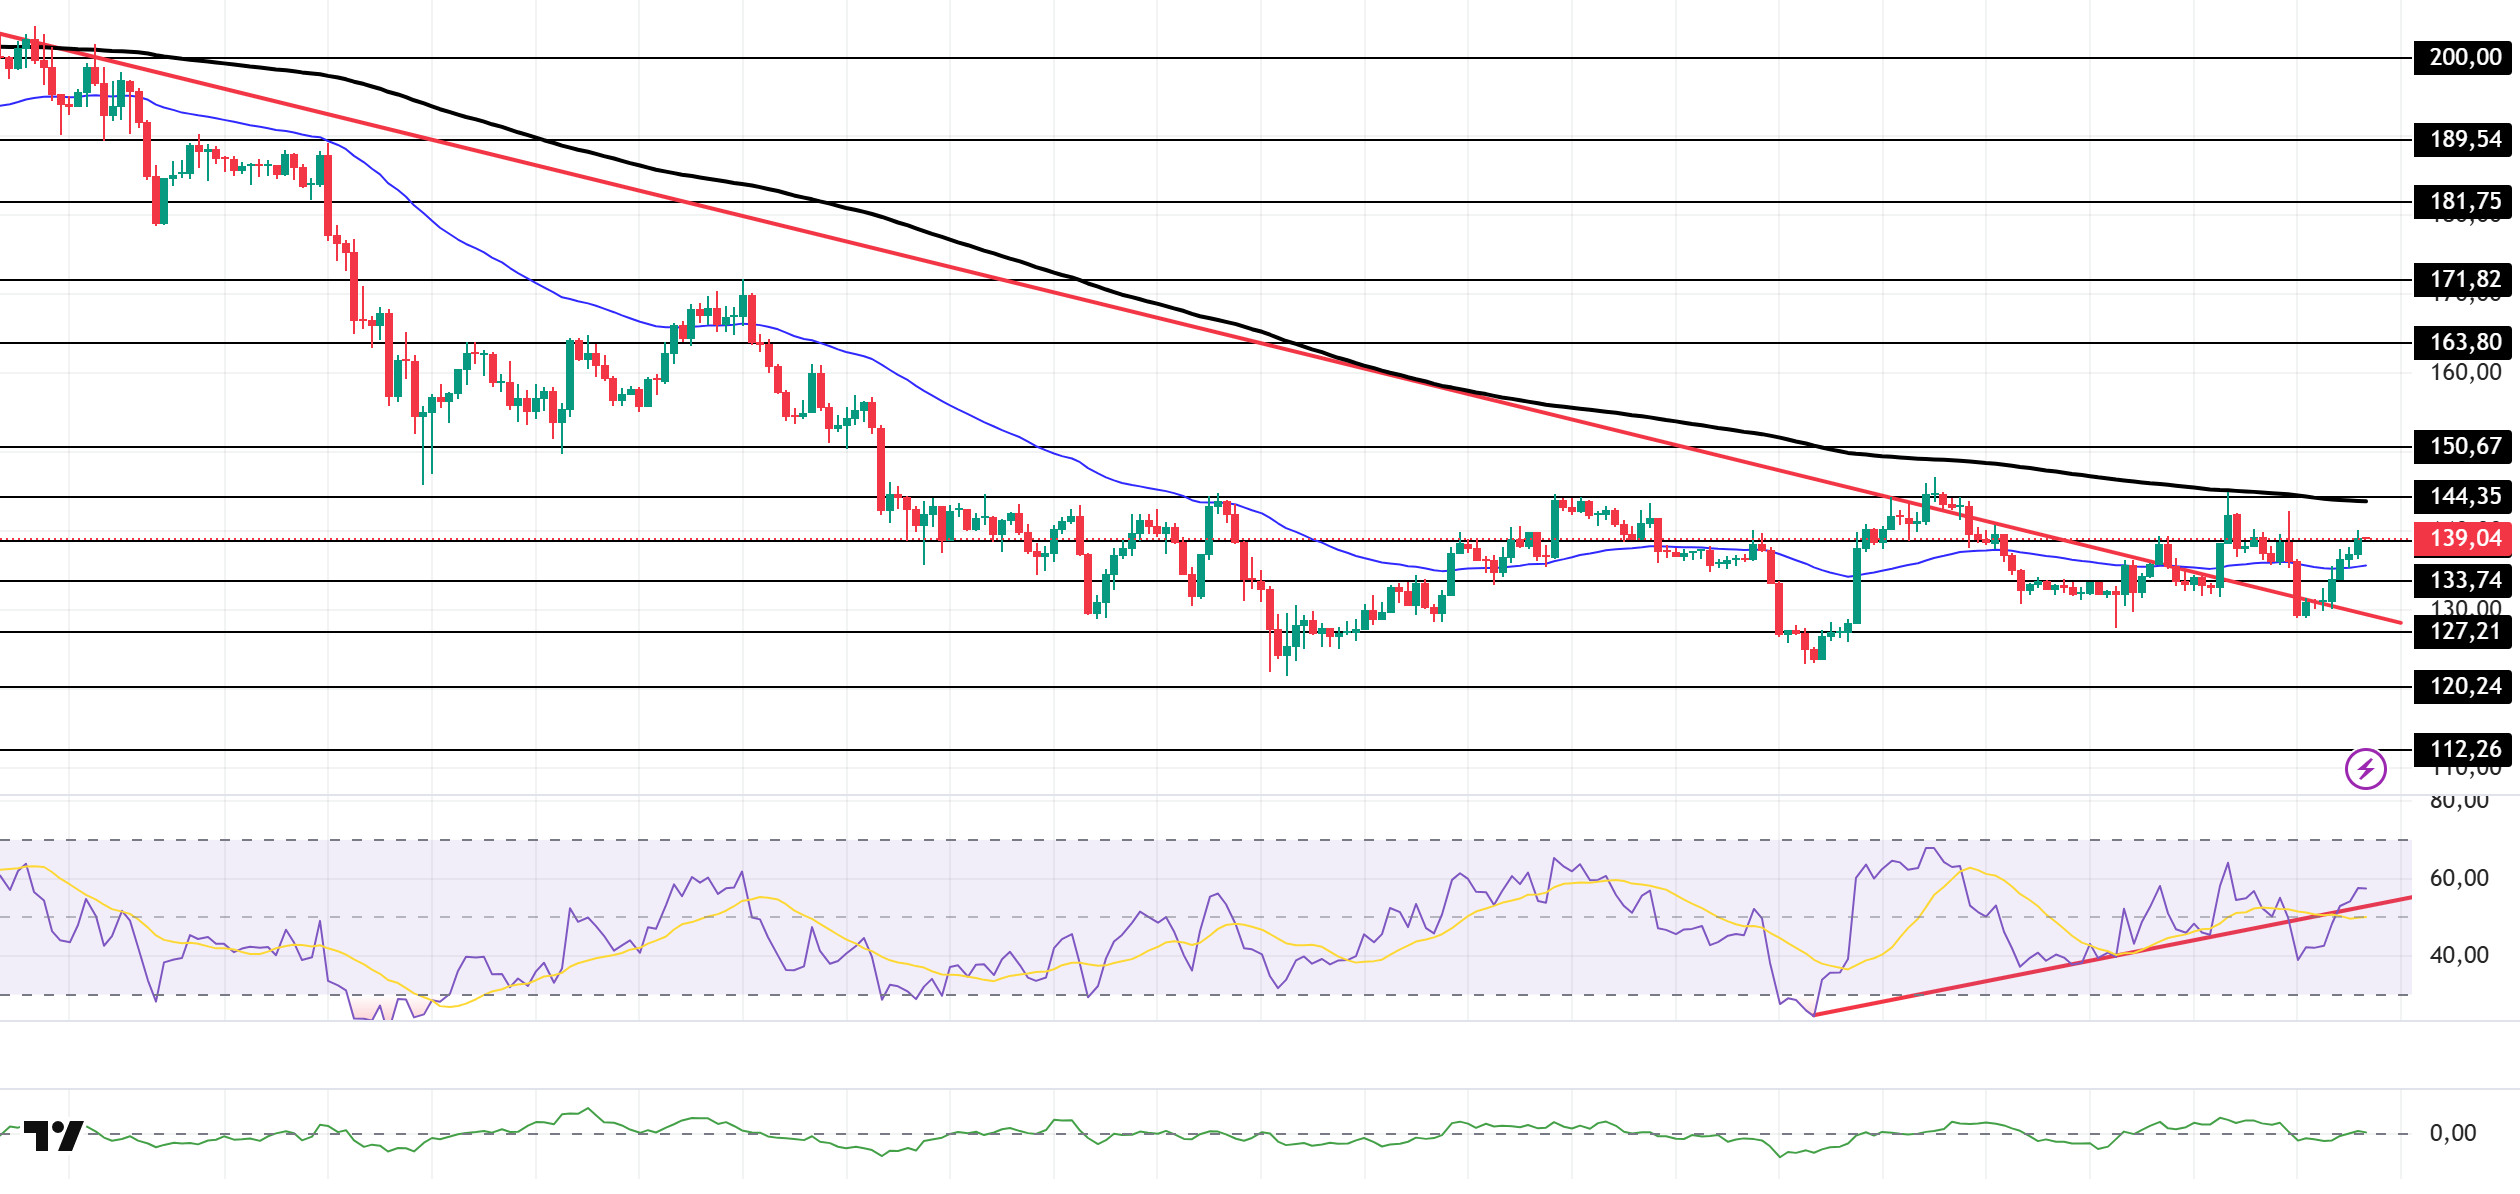
The SOL price experienced an uptrend. The asset rose, supported by a falling direct support that began on October 6, and moved above the 50 EMA (Blue Line) moving average. Currently maintaining its momentum, the price is preparing to test the 200 EMA (Black Line) moving average as resistance. If it closes above this moving average, it could test the $150.67 level as resistance. In the event of a pullback, it could test the 50 EMA (Blue Line) moving average as support.
On the 4-hour chart, it remained below the 50 EMA (Exponential Moving Average – Blue Line) and 200 EMA (Black Line). This indicates a possible downtrend in the medium term. At the same time, the price being between the two moving averages indicates that the asset is in a decision phase in the short term. The Chaikin Money Flow (CMF-20) has moved into positive territory. However, an increase in money inflows could push the CMF to the upper levels of the positive zone. The Relative Strength Index (RSI-14) has risen to the middle of the positive zone. It has also moved into the upper region of the upward trend that began on December 1. This indicates that buying pressure is building. If there is an uptrend due to macroeconomic data or positive news related to the Solana ecosystem, the $150.67 level stands out as a strong resistance point. If this level is broken upwards, the uptrend is expected to continue. If there are pullbacks due to developments in the opposite direction or profit-taking, the $120.24 level may be tested. A decline to these support levels could increase buying momentum, presenting a potential opportunity for an upward move.
Supports: 138.73 – 133.74 – 127.21
Resistances: 144.35 – 150.67 – 163.80
DOGE/USDT
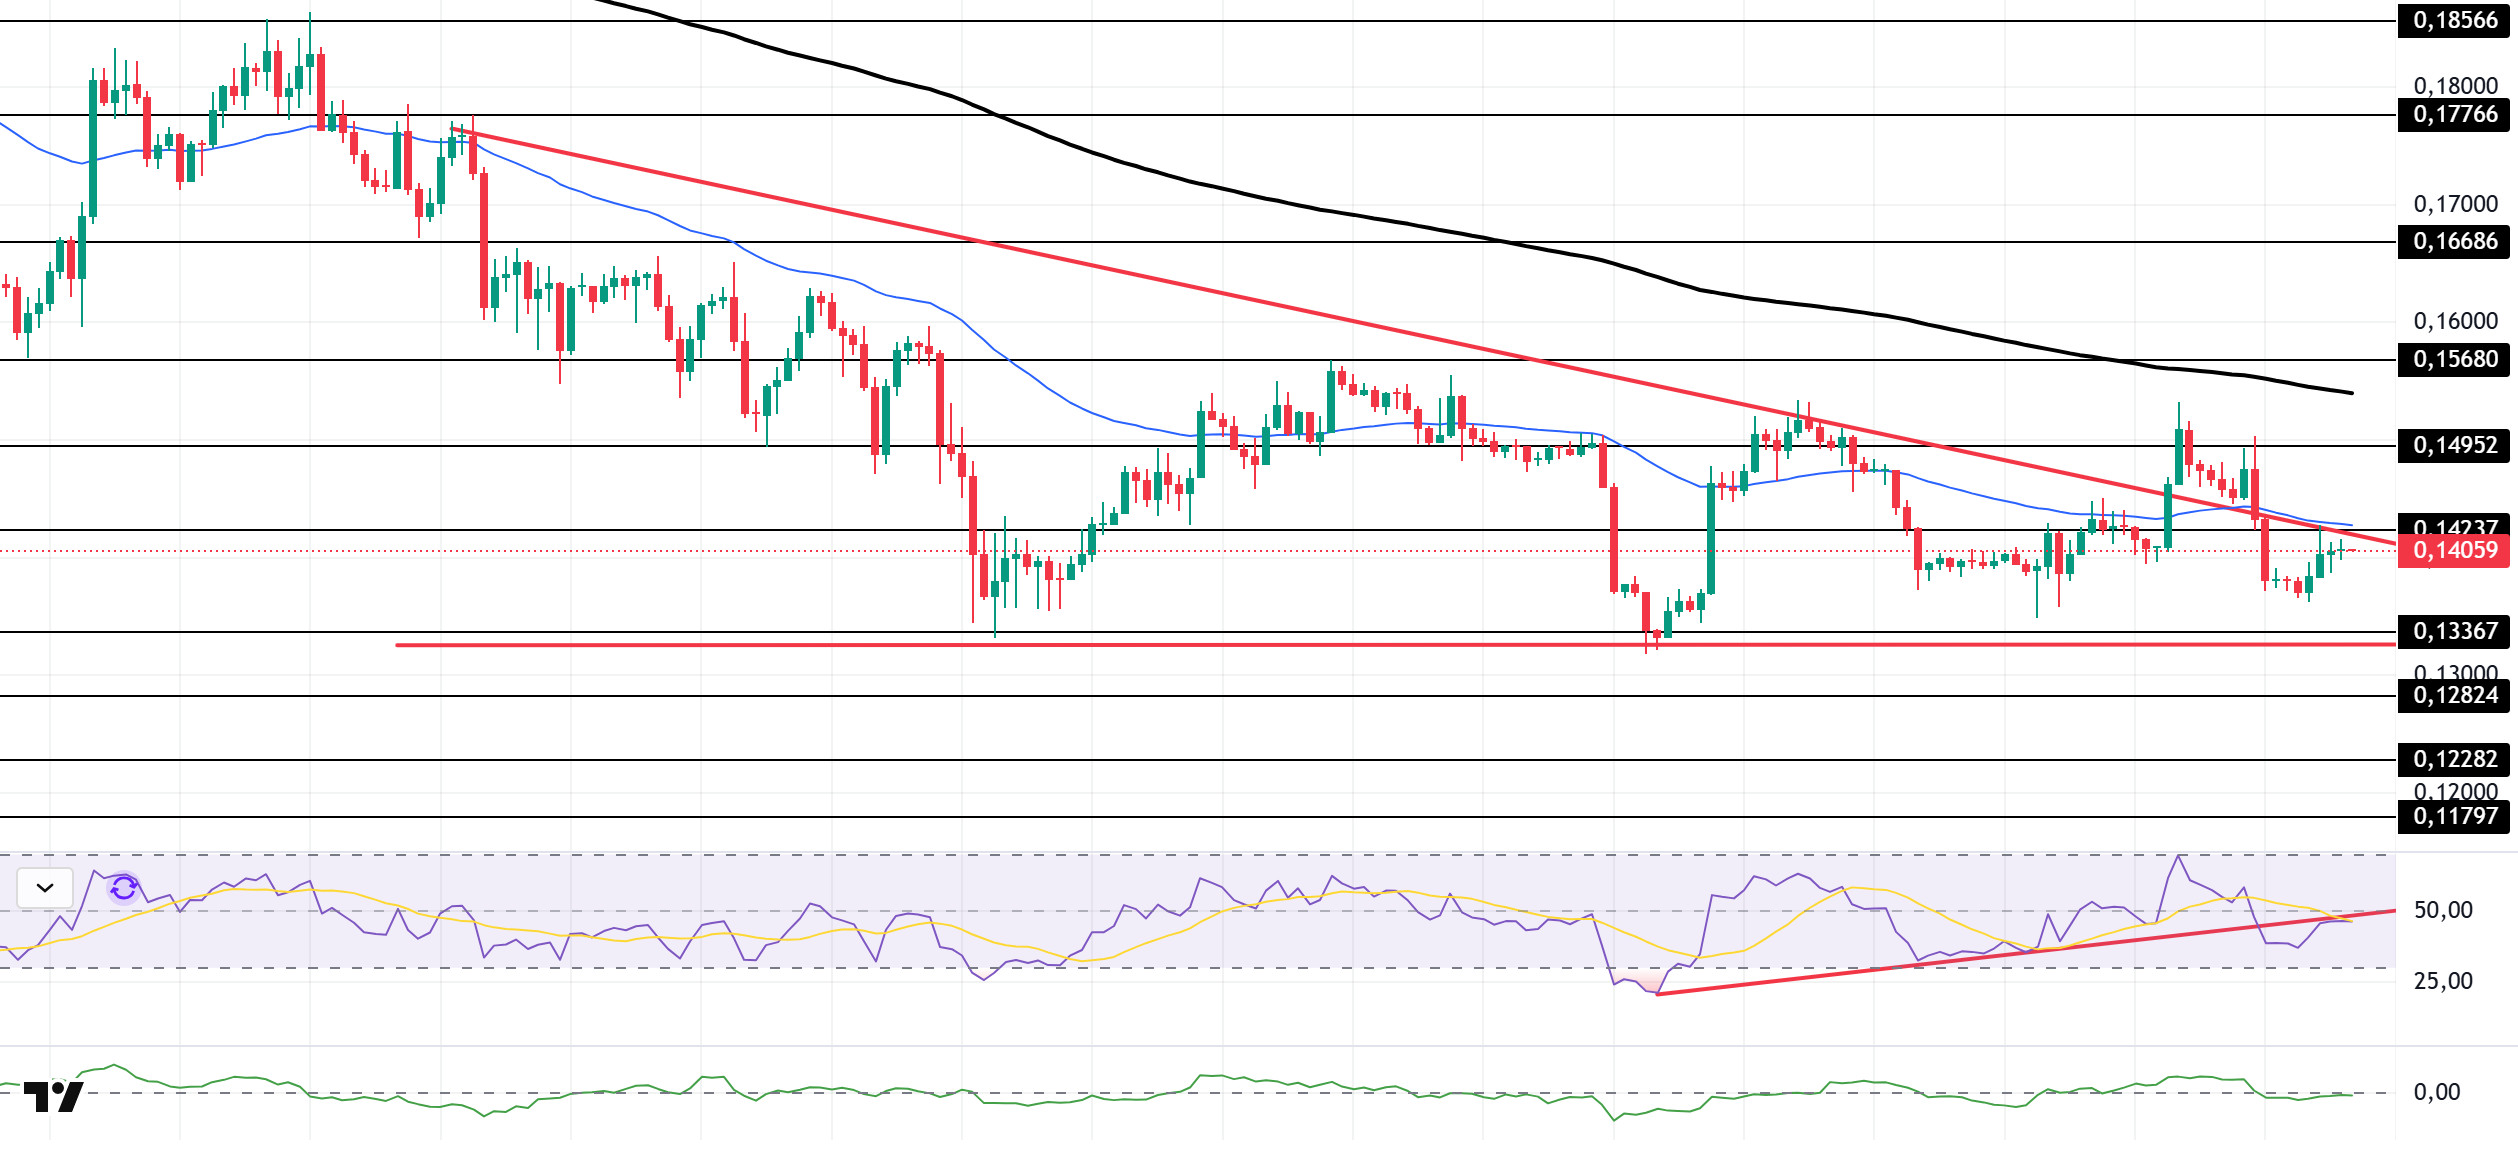
The DOGE price has shown an upward trend. The asset is currently testing the ceiling level of the descending triangle formation that began on November 13 and the 50 EMA (Blue Line) moving average as resistance. The asset, which is gaining momentum, may test the 200 EMA (Black Line) moving average as resistance if the uptrend continues. If a pullback begins, it may test the base level of the descending triangle formation.
On the 4-hour chart, the 50 EMA (Exponential Moving Average – Blue Line) remained below the 200 EMA (Black Line). This indicates that the downtrend may continue in the medium term. The price being below both moving averages suggests a downward trend in the short term. The Chaikin Money Flow (CMF-20) is at a neutral level. Additionally, the balance of money inflows and outflows may keep the CMF at a neutral level. The Relative Strength Index (RSI-14) has risen to a neutral level. At the same time, it is testing the resistance level of the upward trend that began on December 1. If it breaks through this level, buying pressure may increase. In the event of an uptrend driven by political developments, macroeconomic data, or positive news flow in the DOGE ecosystem, the $0.15680 level stands out as a strong resistance zone. Conversely, in the event of negative news flow, the $0.13367 level could be triggered. A decline to these levels could increase momentum and initiate a new wave of growth.
Supports: 0.13367 – 0.12824 – 0.12282
Resistances: 0.14237 – 0.14952 – 0.15680
AVAX/USDT
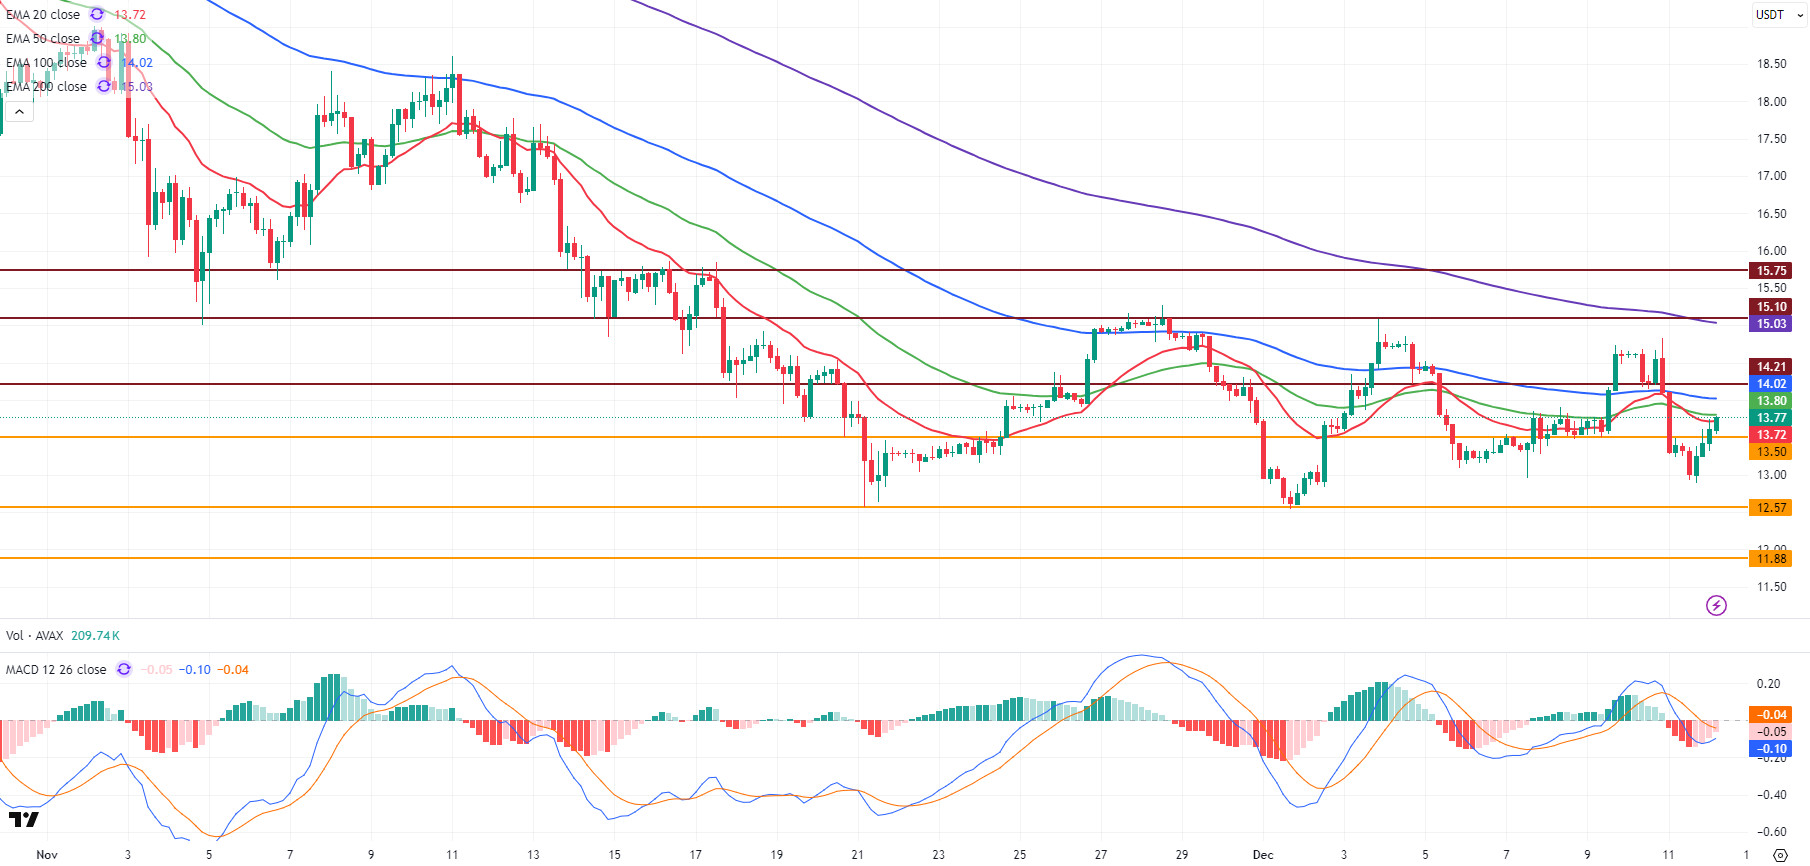
AVAX started yesterday at $14.11, then fell to $12.90 during the day amid increasing selling pressure. Buying from this level led to a rebound in the second half of the day, with AVAX closing at $13.42, down about 4.9% on the day. Starting the new day with an uptick from $13.42, AVAX is currently trading at $13.75, continuing its recovery trend with an approximate 2.5% increase compared to the opening price. AVAX, which tested the $13.50 level before yesterday’s close, broke above this level in the first 4-hour candle of the new day and continued its rise, indicating that short-term rebound buying is in play. In the current uptrend, the 20, 50, and 100-period Exponential Moving Average (EMA) levels stand out as critical resistance zones.
On the 4-hour chart, the Moving Average Convergence/Divergence (MACD) line remains below the signal line and continues to trade in negative territory. Although this outlook is technically negative, the MACD line turning upward signals that momentum could recover in the short term. If the MACD crosses above the signal line and moves into positive territory, the upward momentum in AVAX could strengthen. On the Exponential Moving Average (EMA) side, AVAX fell below all critical EMA levels following yesterday’s sharp decline. Starting the new day with an uptrend, AVAX is currently testing the EMA20 and EMA50 levels. If it closes above these levels for 4 hours, the EMA100 level may come back into focus as the uptrend continues. However, as long as it fails to stay above the EMA levels, the technical outlook remains cautious.
From a technical perspective, the first critical resistance zone for AVAX’s rise is the $14.21 level, along with the band formed by the EMA levels. If this zone is broken upwards, the $15.10 and then the $15.75 resistance levels could be targeted in the continuation of the rise. In a downward scenario, the $13.50 level is the first important support position. If this level is broken downward again, selling pressure may increase, and AVAX could retreat towards the $12.57 and $11.88 support levels. In the overall outlook, although the MACD is still in negative territory, its upward shift and AVAX testing the EMA20 and EMA50 levels indicate that the short-term rebound may continue. However, as long as sustainability above the EMA levels cannot be achieved, the upward movement is likely to remain limited at resistance levels.
(EMA20: Red Line, EMA50: Green Line, EMA100: Blue Line, EMA200: Purple Line)
Support levels: 13.50 – 12.57 – 11.88
Resistances: 14.21 – 15.10 – 15.75
LINK/USDT
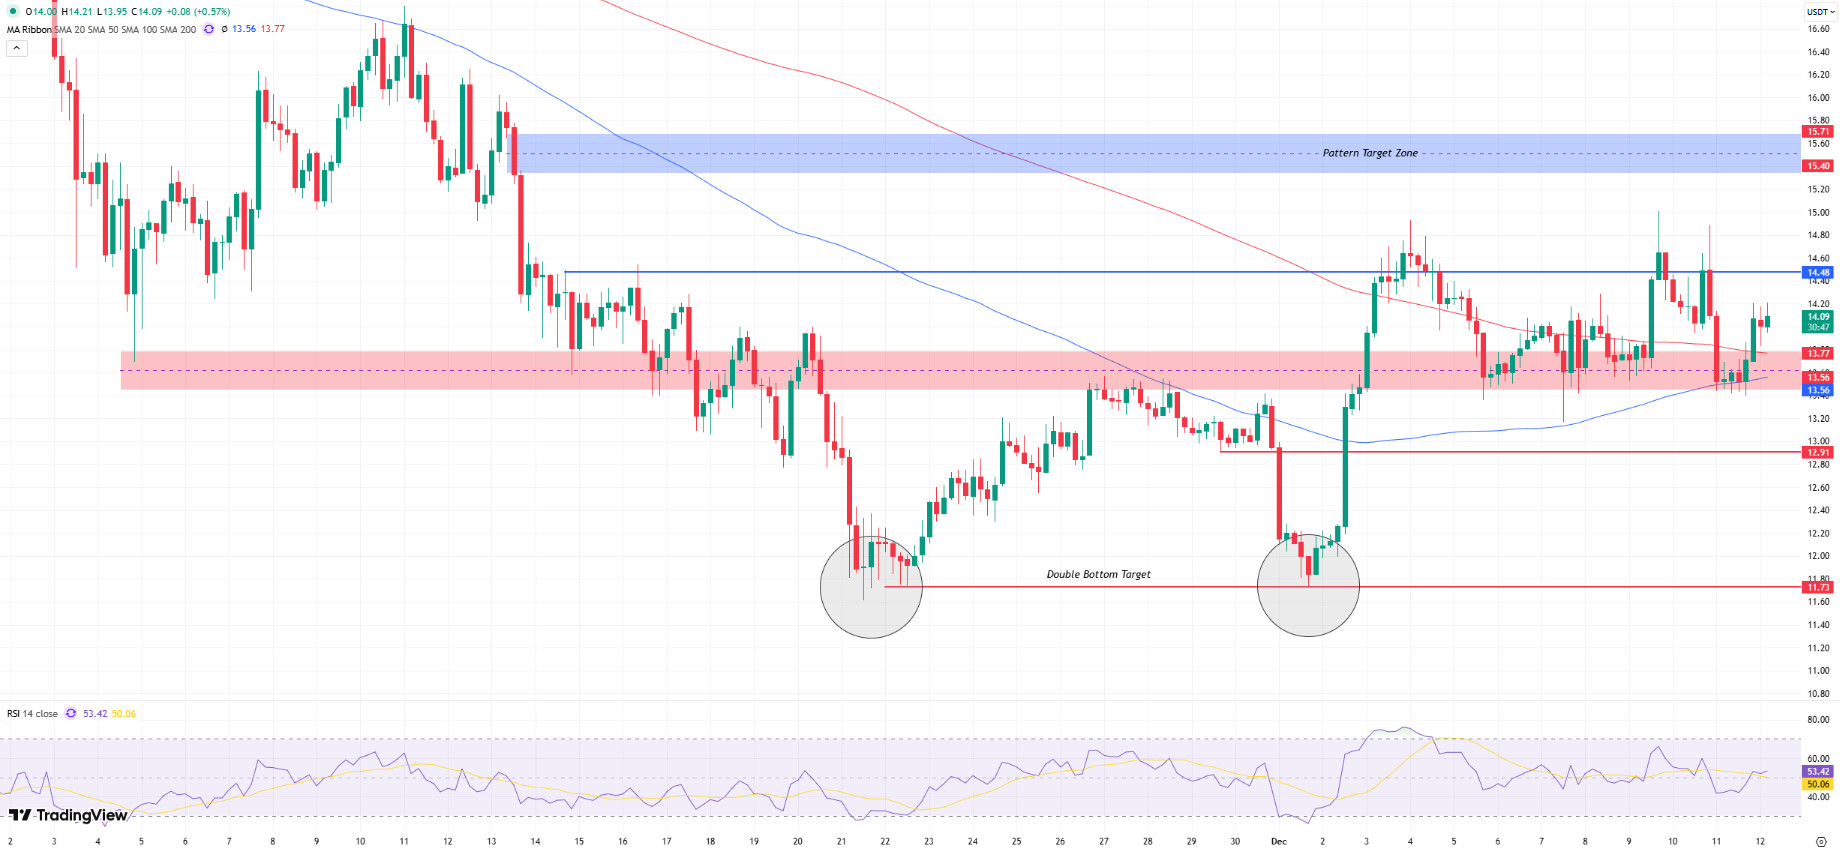
Following the recent downward movement, the price returned to the 13.30–13.50 range, forming a strong demand base in this area. The double bottom formation in the 11.73–11.80 range on the chart remains structurally valid, and we can say that buyers have regained momentum with the price breaking out of the current horizontal squeeze. However, closes below the 13.50 level could weaken the momentum provided by the formation and put the short-term outlook under negative pressure.
The first resistance level to watch for upward expectations is the 14.45–14.48 zone. Although the price has tested this range several times, no solid breakout has occurred yet, suggesting that sellers still dominate here. If this barrier is overcome, the 15.40–15.80 target zone indicated by the formation could come back into play, calling into question the price’s broader downward trend and significantly increasing medium-term positive expectations.
On the downside, the 13.30–13.50 demand zone remains the first line of defense in the short term. As seen on the chart, we have not had any 4-hour closes below the red shaded area. Therefore, this area is a strong demand zone. If this range is lost, the price may first fall to the 12.91 level and then to the double bottom zone at 11.73. In particular, pricing below 12.91 could seriously weaken the resilience of the upward trend.
The Relative Strength Index (RSI) is fluctuating in positive territory, slightly above the middle band at the 53 level. For the uptrend to gain strength, the price must be supported by closes above 14.48.
Supports: 13.56 – 12.91 – 11.73
Resistances: 14.48 – 15.40 – 15.71
Legal Notice
The investment information, comments, and recommendations contained herein do not constitute investment advice. Investment advisory services are provided individually by authorized institutions taking into account the risk and return preferences of individuals. The comments and recommendations contained herein are of a general nature. These recommendations may not be suitable for your financial situation and risk and return preferences. Therefore, making an investment decision based solely on the information contained herein may not produce results in line with your expectations.

