
Technical Analysis
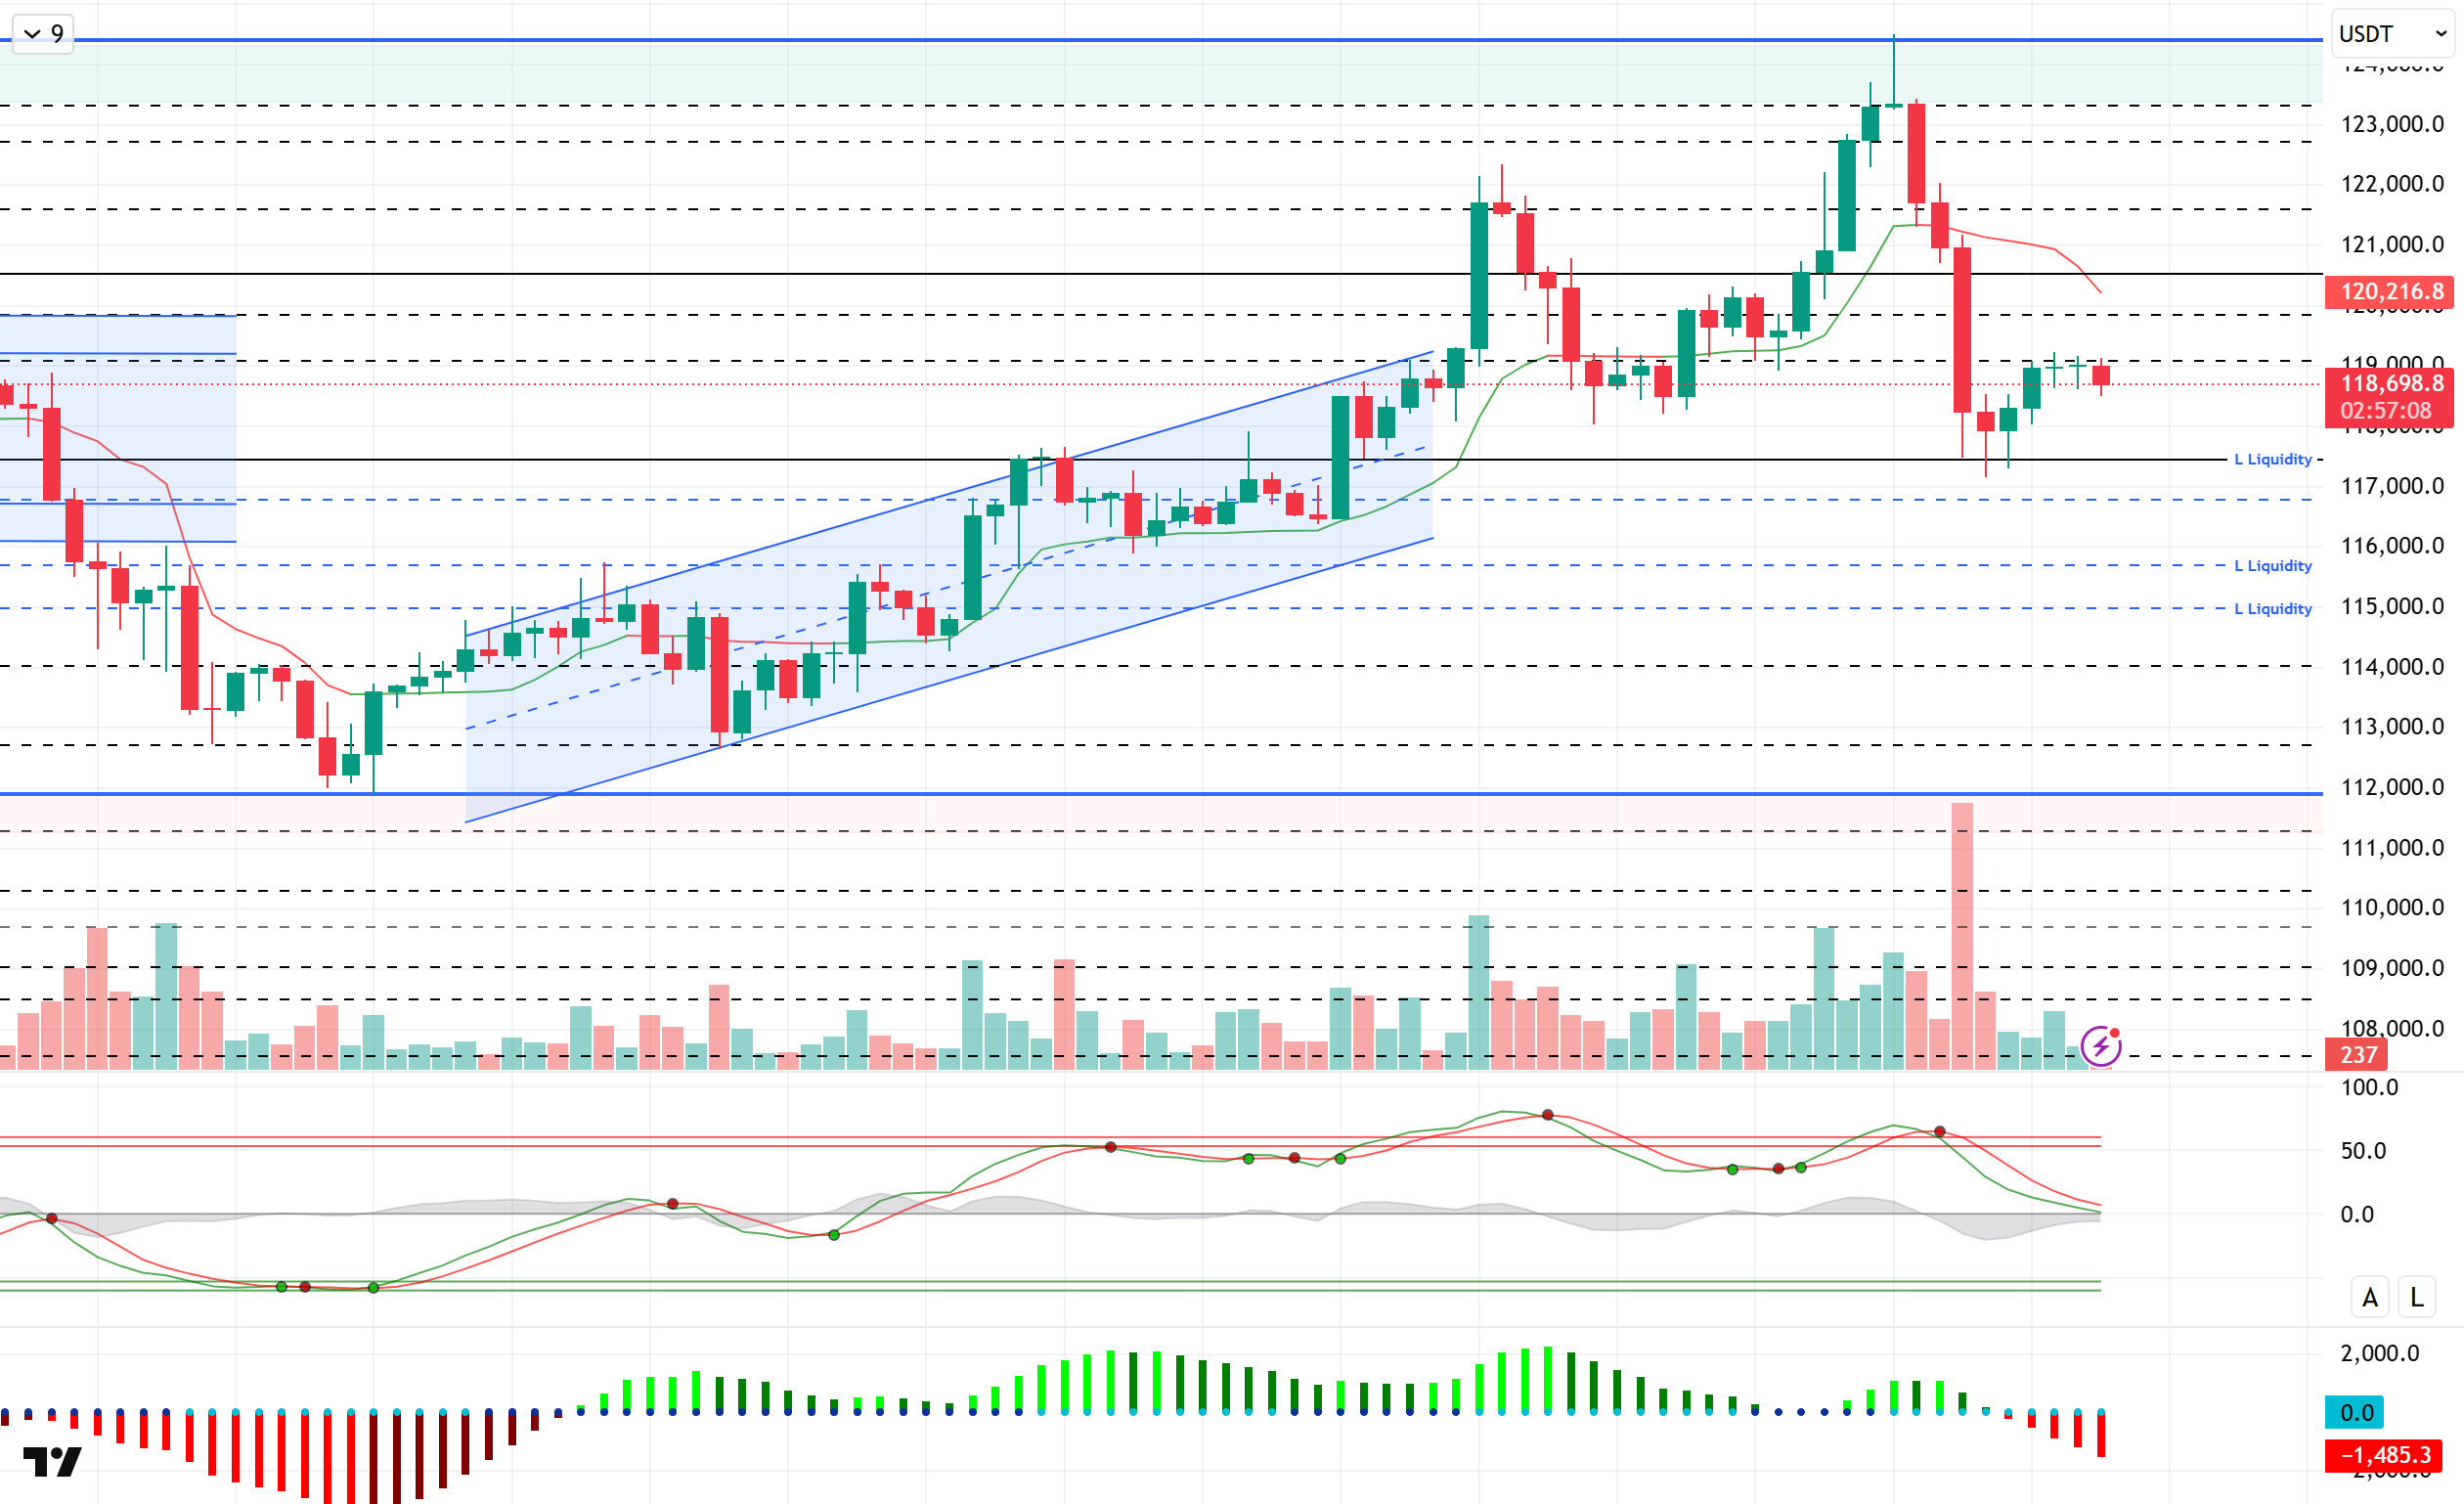
BTC/USDT
In August, the New York Fed Manufacturing Index rose to 11.9, reaching its highest level since November 2024. In July, the US Import Price Index increased by 0.4% month-on-month, marking its largest increase since April 2024. Barclays stated that the latest employment data is unlikely to prompt Fed Chair Jerome Powell to alter his cautious stance on interest rates, and that they expect a 25-basis-point cut in December. The GENIUS Act in the U.S. has sparked debate among banks, state regulators, and consumer groups, particularly due to Section 16(d). In the options market, 39,000 BTC options will expire; the total nominal value is approximately $4.78 billion, with a maximum pain point of $118,000. Later today, SEC Chairman Paul Atkins and the Trump-Putin negotiation meeting will be monitored, while U.S. futures are trading positively sideways.
From a technical perspective, volatility has increased within a narrow trading range compared to the previous analysis. The price, which has been moving within the 118,500–119,100 band throughout the day, has entered a direction-seeking phase with increasing volatility at times. At the time of writing, volatility continues, with the price trading at 118,700.
Technical indicators show that the Wave Trend oscillator (WT) is preparing for a trend reversal in the middle band of the channel, while the Squeeze Momentum (SM) indicator, despite remaining in the positive zone since the beginning of the month, has moved into the negative zone following yesterday’s decline. The Kaufman moving average is currently above the price at the 120,200 level.
Looking at liquidity data, we noted that short-term sell positions have re-emerged at 119,300 and 119,700, while buy positions continue to show aggressive concentration at 117,000 and 115,000. Indeed, the price retreating to the 117,200 level forced some positions to liquidate and others to close due to a Long Squeeze. However, the 115,000 level continues to remain a dense accumulation zone.
In summary, the disappearance of the recent optimistic mood due to fundamental developments and the US Treasury’s announcement that it will use BTC as a store of value, coupled with a hacking attack on a local exchange and an increase in US CPI data, created significant selling pressure on prices. Technically, indicators reaching their saturation point, along with increasing buy positions in liquidity data, have contributed to rising volatility, causing prices to decline from the new all-time high (ATH) of 124,000 to 117,200. Following the recent decline, BTC is attempting to recover and is once again heading toward the 120,000 level. Breaking above this level is seen as crucial for the completion of the selling pressure and regaining momentum. In the event of continued selling pressure, we will monitor the 118,000 and then the 117,300 levels.
Support levels: 120,000 – 121,500 – 122,700
Resistance levels: 119,000 – 117,300 – 115,000
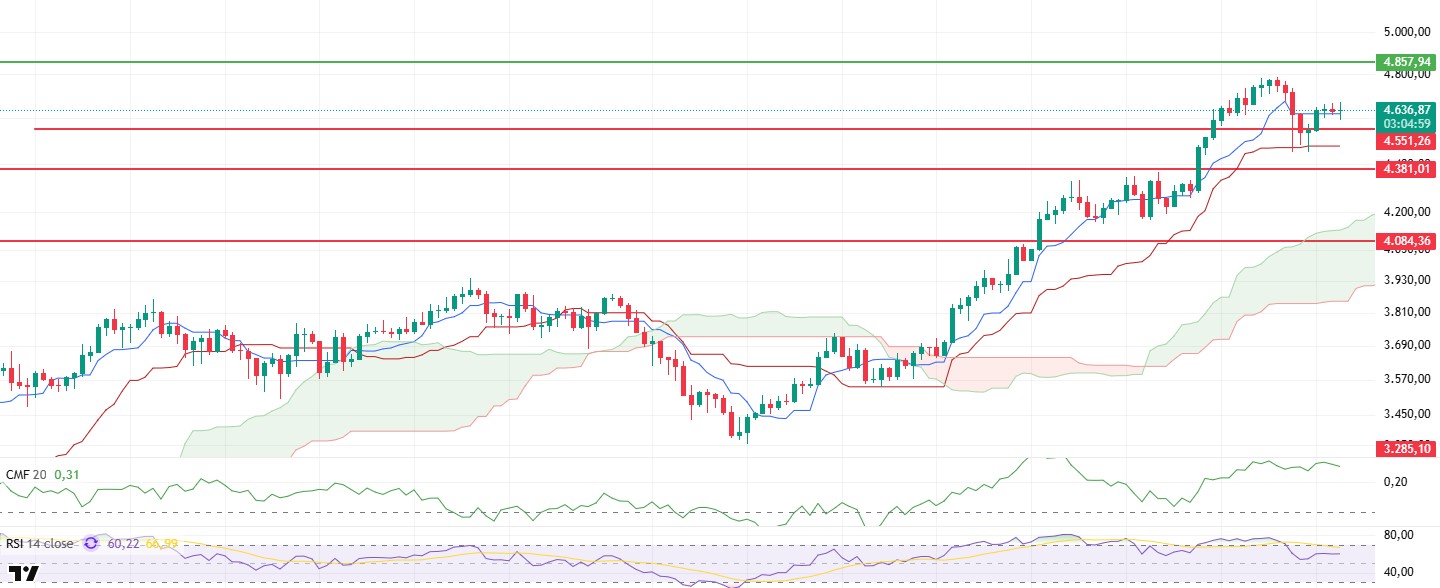
ETH/USDT
ETH continued its sideways movement within a narrow price range during the day, successfully maintaining the technically critical Tenkan level. This contributed to the continuation of the current positive technical outlook.
When examining Cumulative Volume Delta (CVD) data in particular, it can be seen that the recovery movement that began after the recent pullback was mainly driven by the spot market. The increase in spot-based purchases indicates that the upward movement is now grounded on a healthier and more sustainable foundation. Additionally, the decline in the funding rate level suggests that short-term downside risks for the market have diminished.
The Chaikin Money Flow (CMF) indicator, which measures liquidity flow, remains in positive territory, confirming continued net capital inflows into the market. The Relative Strength Index (RSI) is maintaining its horizontal movement at the 60 level, indicating that the price is moving within a short-term equilibrium zone. This technical structure suggests that there is neither excessive buying nor selling pressure in the market, and that the search for direction continues.
When evaluating the overall outlook, maintaining the Tenkan support level of $3,619 in the evening hours is of critical importance. Remaining above this level has the potential to reignite buying appetite and accelerate upward price movements. However, if this support level is broken downward, increased selling pressure and the possibility of the price entering a downward correction process may come into play. Therefore, based on current technical data, the 3,619 dollar level is a decisive threshold for both buyers and sellers in the short term.
Support levels: 4,550 – 4,381 – 4,084
Resistance levels: 4,857 – 5,000 – 5,350
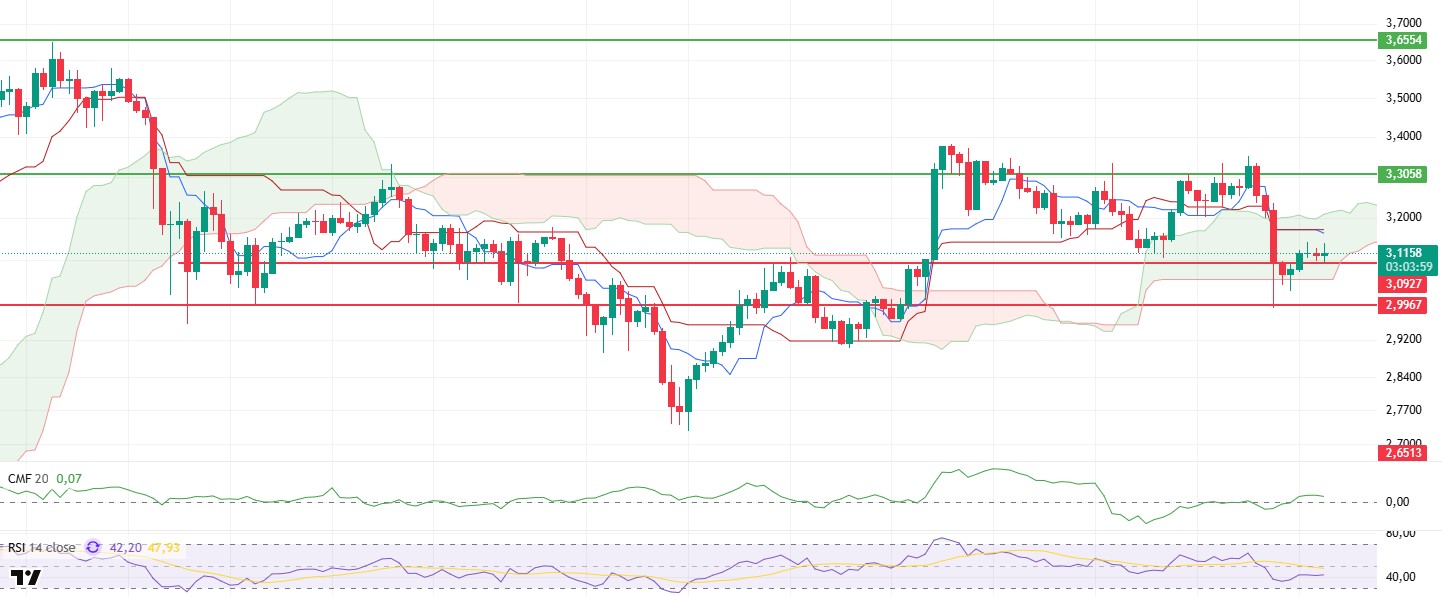
XRP/USDT
XRP maintained its horizontal trend within a narrow price range during the day and managed to hold its critical support level at $3.09.
Upon examining technical indicators, the Chaikin Money Flow (CMF) indicator’s continued upward movement in the positive zone confirms that liquidity inflows into the market have begun to increase significantly. The rising capital inflow stands out as a key factor supporting the price’s upward potential.
From the Ichimoku indicator perspective, the price losing both the Tenkan and Kijun levels and entering the kumo cloud indicates that short-term technical risks are still present. Entering the kumo cloud indicates increased uncertainty about the trend direction and suggests that the market is in a decision-making phase. This technical situation highlights that the price must first exit the cloud before the upward trend can regain momentum.
The Relative Strength Index (RSI) is flat at around 42, confirming that the current momentum has not yet gained sufficient strength. This indicates that buyers need additional volume and momentum to increase pressure.
In general, maintaining the $3.09 level in the evening hours is critical in the short term. Staying above this level could pave the way for upward momentum to regain momentum. However, if the 3.09 dollar support level is broken downward, there is a high probability that the price will test the main support level at 2.99 dollars again. If this main support level is strongly maintained, the market may regain momentum and enter an upward trend.
Support levels: 3.0927 – 2.9967 – 2.7355
Resistance levels: 3.3058 – 3.6554 – 4.0055
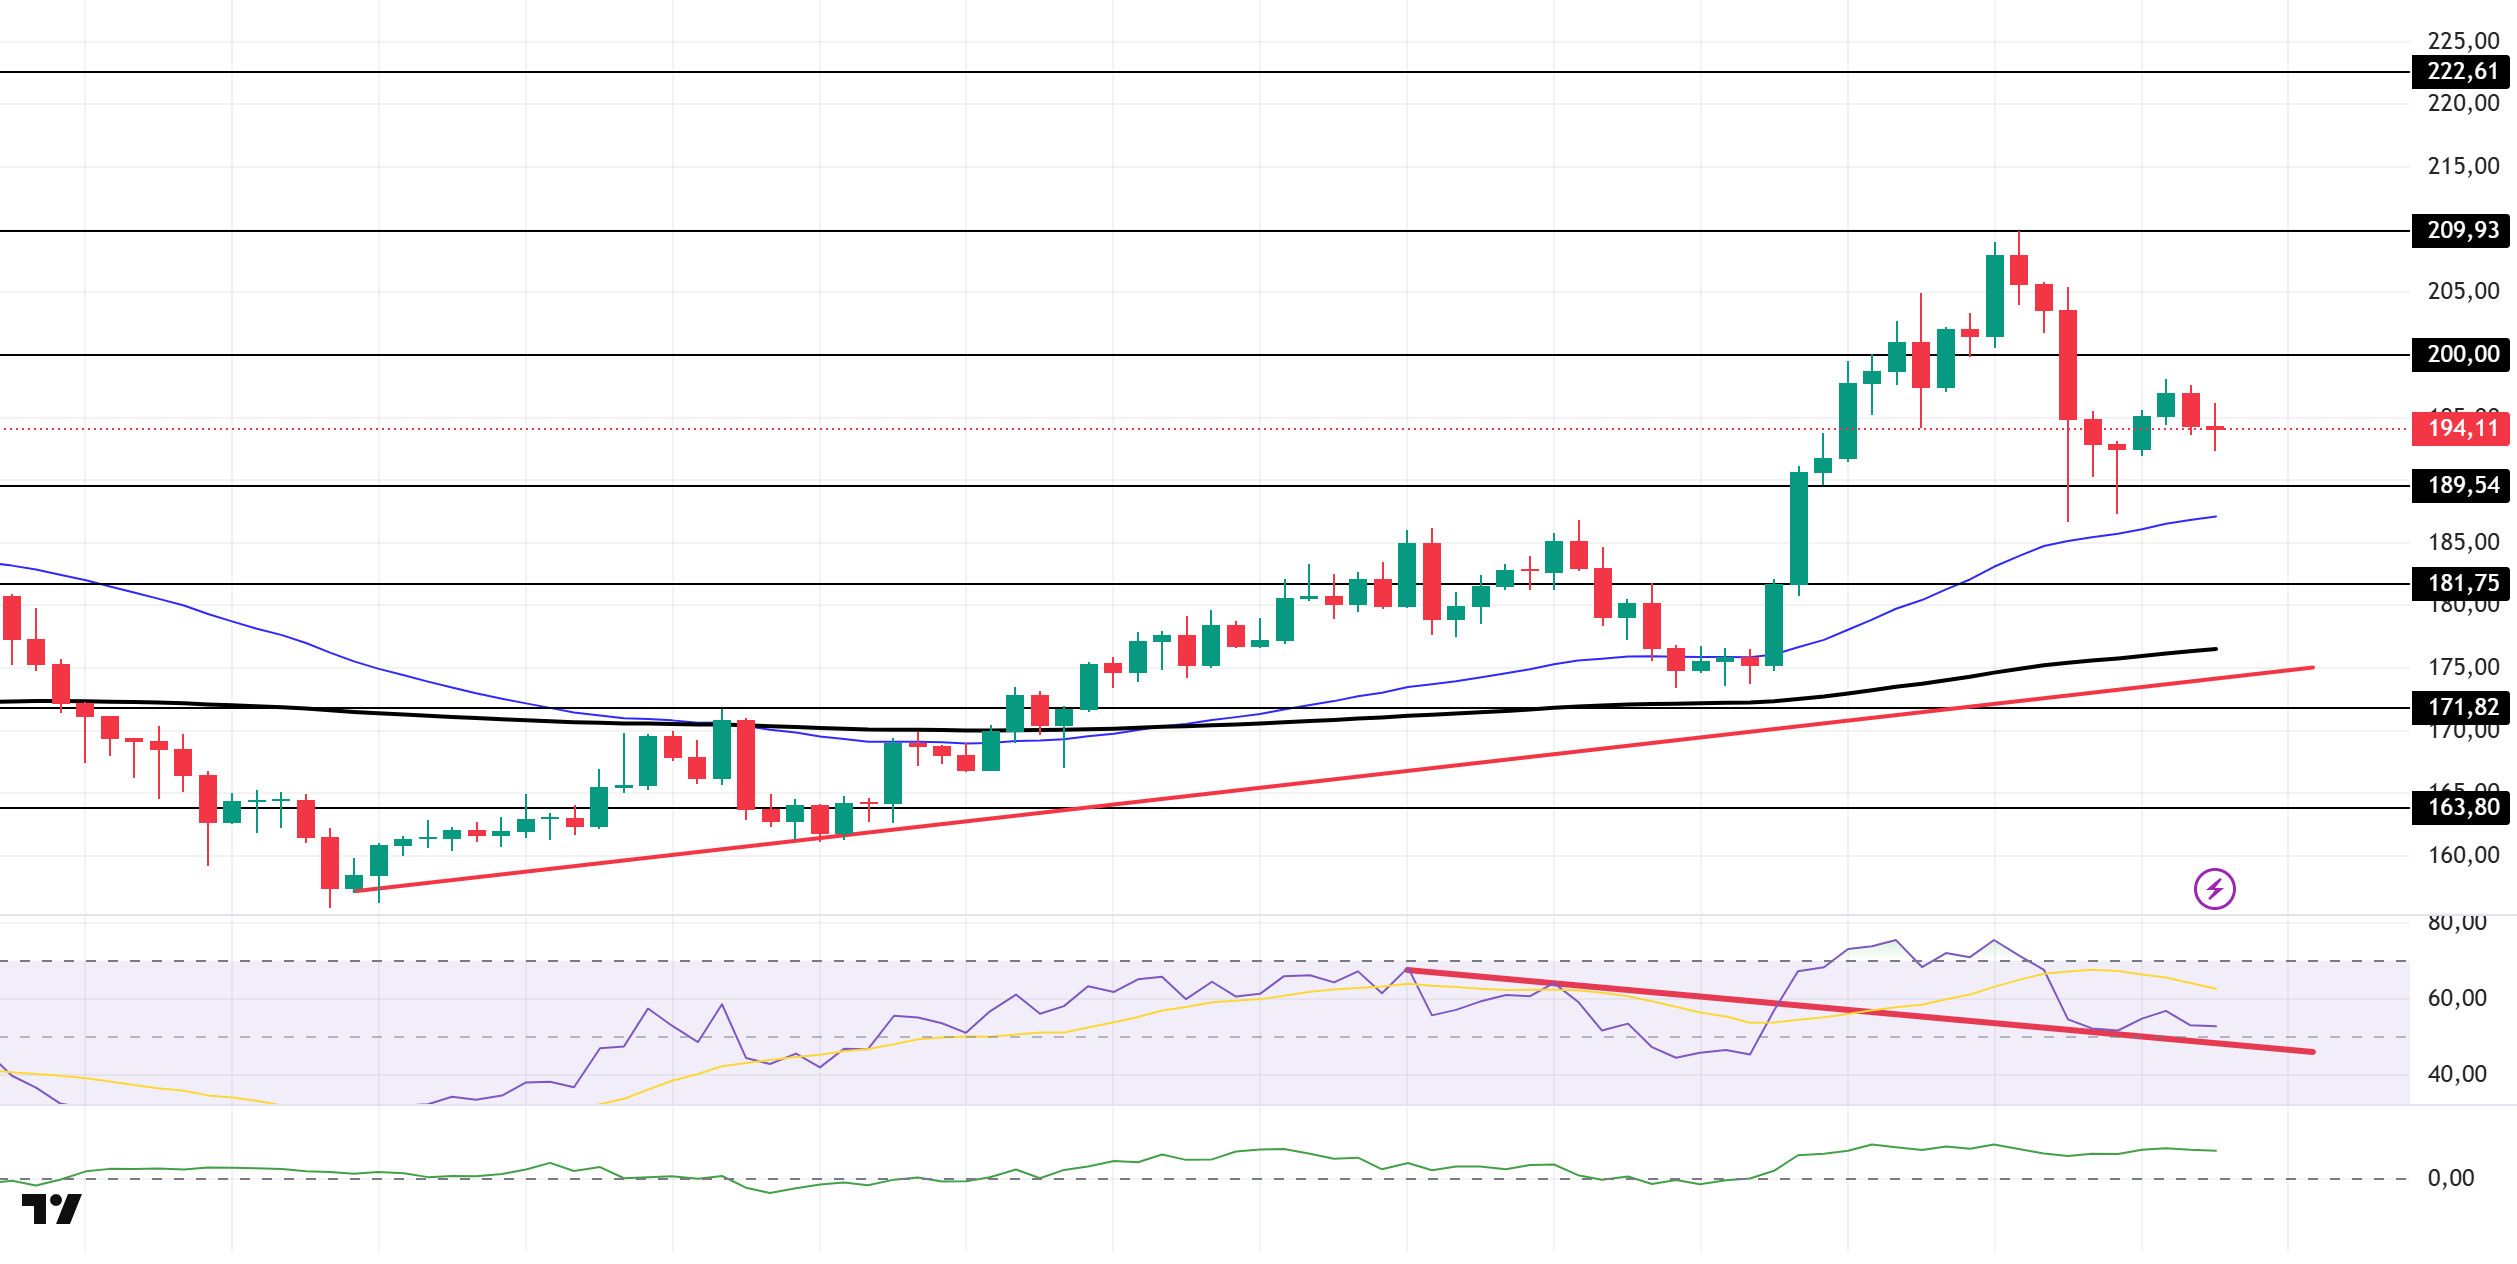
SOL/USDT
The SOL price remained flat during the day. The asset continued to stay above the upward trend that began on August 2, but remained below the strong and psychological resistance level of $200.00. The price showed a slight increase, supported by the strong support zone of $189.54 and the 50 EMA (Blue Line) moving average. As of now, if the price manages to stay above these levels, it could test the 200.00 dollar level as resistance if the upward trend continues. Otherwise, the 50 EMA moving average should be monitored.
On the 4-hour chart, the 50 EMA (Blue Line) remains above the 200 EMA (Black Line). This indicates that the upward trend could continue in the medium term. Additionally, the price being above both moving averages suggests that the market is in an upward trend in the short term. Chaikin Money Flow (CMF-20) is in the middle of the positive zone. However, a decrease in money inflows could push the CMF into the negative zone. The Relative Strength Index (RSI-14) remains above the downward trend that began on August 10. This indicates that buying pressure is continuing. In the event of an upward movement due to macroeconomic data or positive news related to the Solana ecosystem, the $200.00 level emerges as a strong resistance point. If this level is broken to the upside, the upward movement is expected to continue. In case of pullbacks due to developments in the opposite direction or profit-taking, the 181.75 dollar level could be tested. A decline to these support levels could increase buying momentum, presenting a potential opportunity for an upward move.
Support levels: 189.54 – 181.75 – 171.82
Resistance levels: 200.00 – 209.93 – 222.61
DOGE/USDT
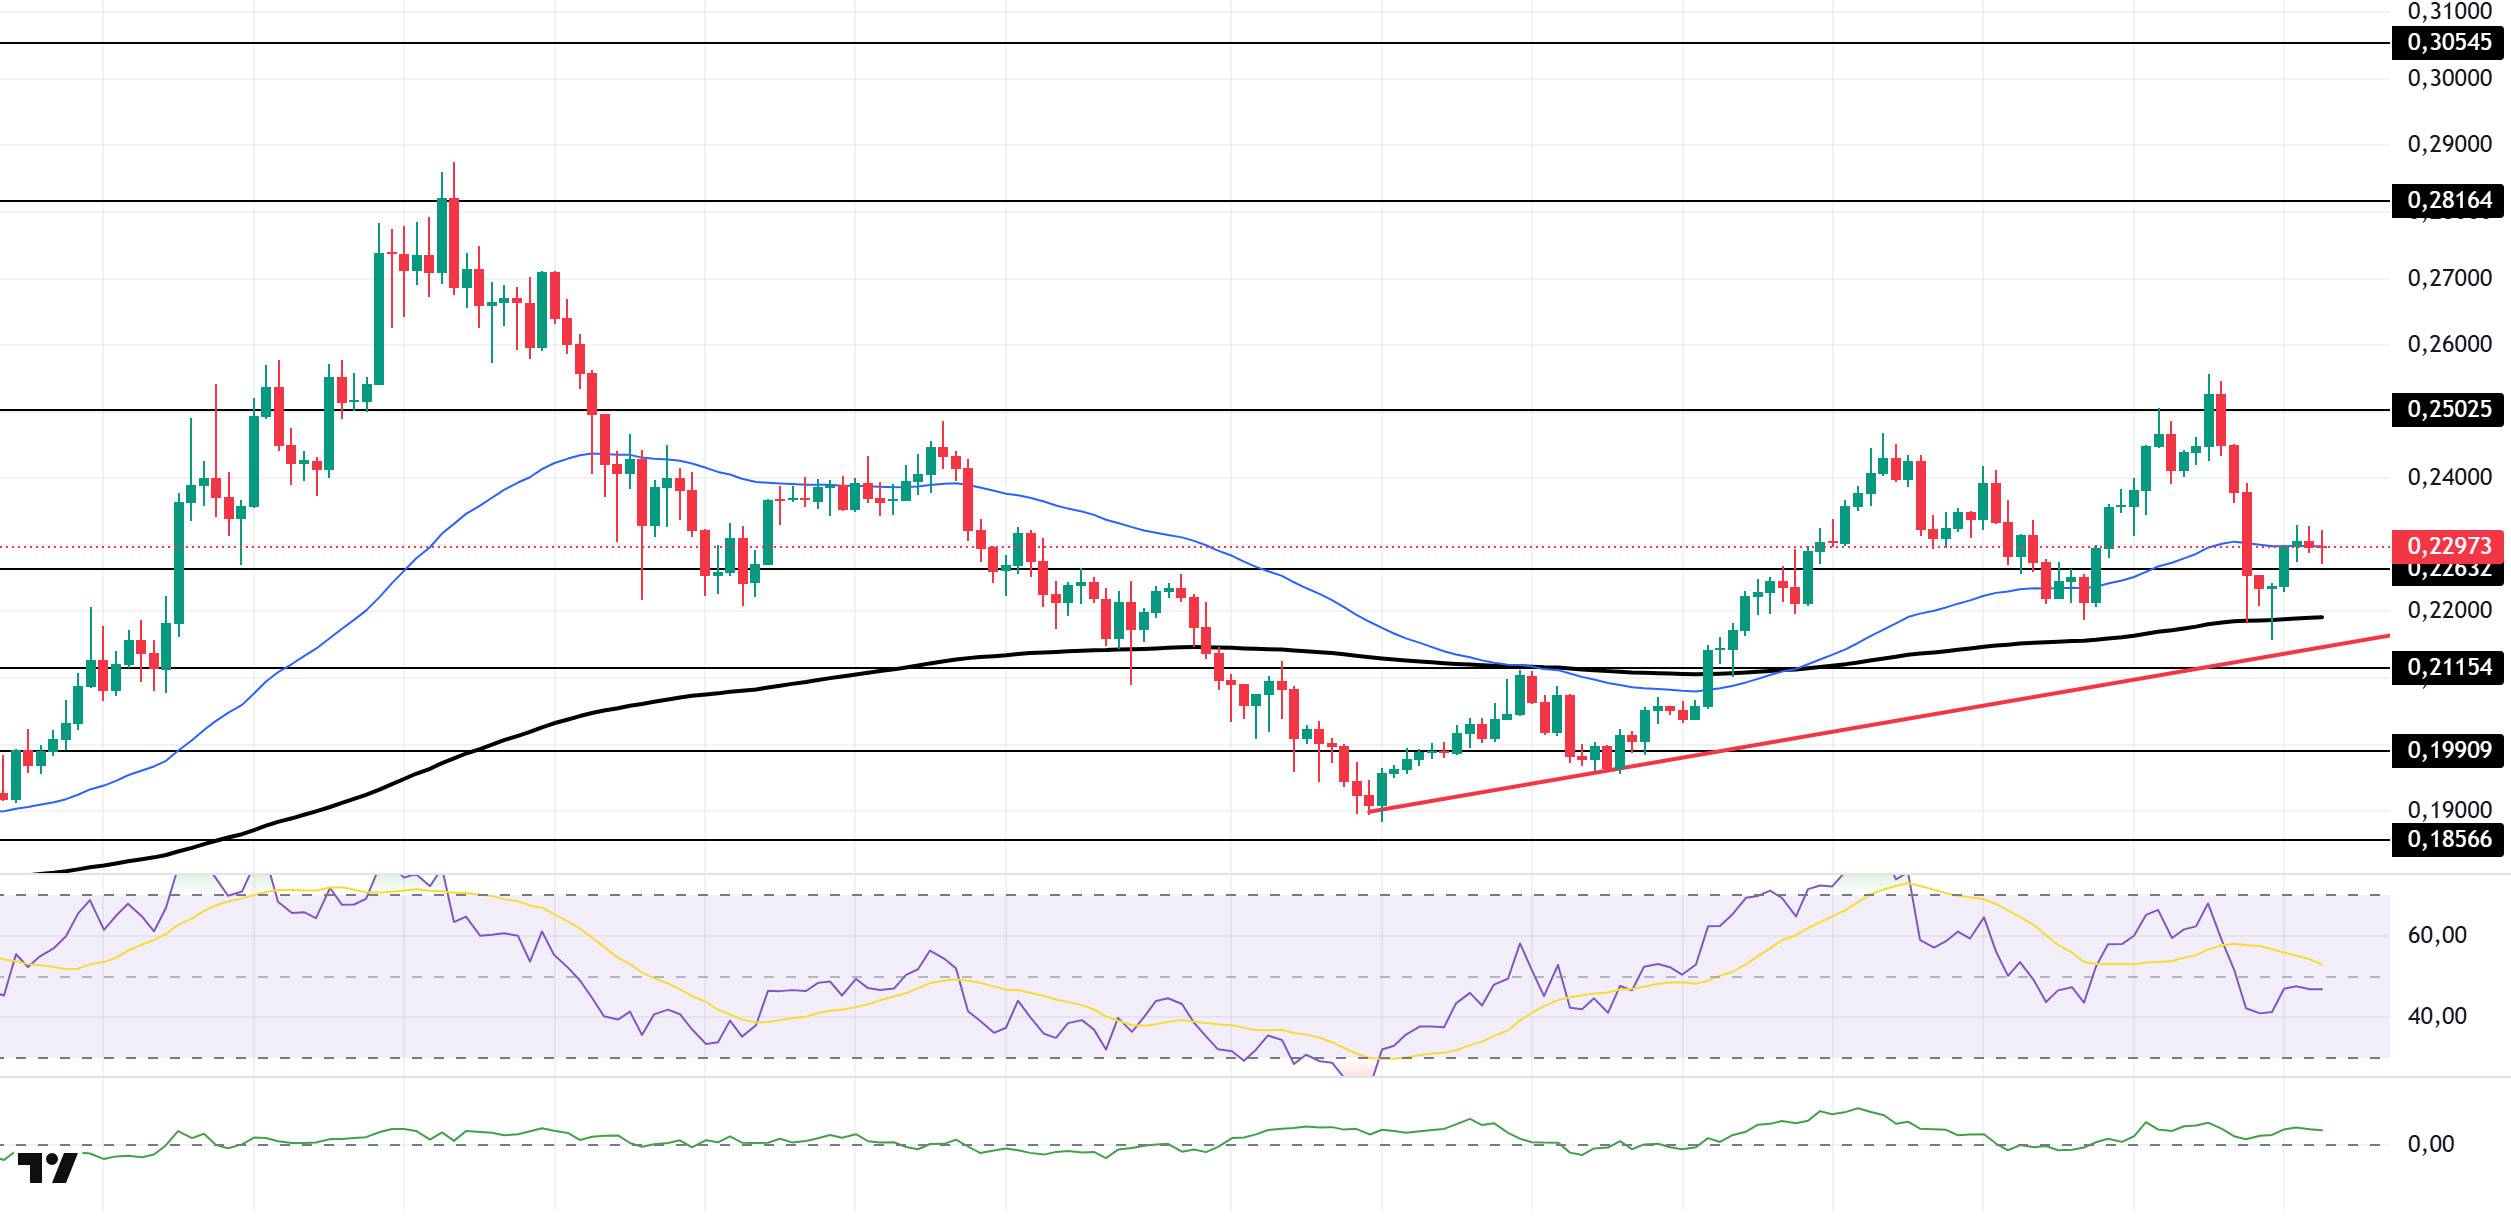
The DOGE price remained flat during the day. The asset continues to trade above the upward trend that began on August 2. As of now, the price is testing the 50 EMA (Blue Line) moving average as resistance. If it closes above this level, it could test the 0.25025 dollar level. If it continues to pull back, the 200 EMA (Black Line) moving average should be monitored.
On the 4-hour chart, the 50 EMA (blue line) remains above the 200 EMA (black line). This indicates that the asset is in an upward trend in the medium term. The price being between the two moving averages also indicates that the asset is in a decision-making phase in the short term. The Chaikin Money Flow (CMF-20) continues to accelerate in the positive zone. Additionally, balanced cash inflows could keep the CMF in the positive zone. The Relative Strength Index (RSI-14) remains in the negative zone. In the event of potential upward movements driven by political developments, macroeconomic data, or positive news flow within the DOGE ecosystem, the $0.25025 level emerges as a strong resistance zone. In the opposite scenario or in the event of negative news flow, the 0.21154 dollar level could be triggered. A decline to these levels could increase momentum and potentially initiate a new upward wave.
Support levels: 0.22632 – 0.21154 – 0.19909
Resistance levels: 0.25025 – 0.28164 – 0.30545
SHIB/USDT
The most notable development in the Shiba Inu ecosystem during the second half of the day was the consolidation of all Shibarium network components under a central access point. According to the official announcement, validator and delegator transactions, the faucet, bridge, and token burning portal are now managed through “shib.io/shibarium.” This change aims to provide developers with a more integrated working environment while improving access speed, security, and transaction process efficiency for users. Additionally, access through a single secure address offers extra protection against fraud attempts via fake links.
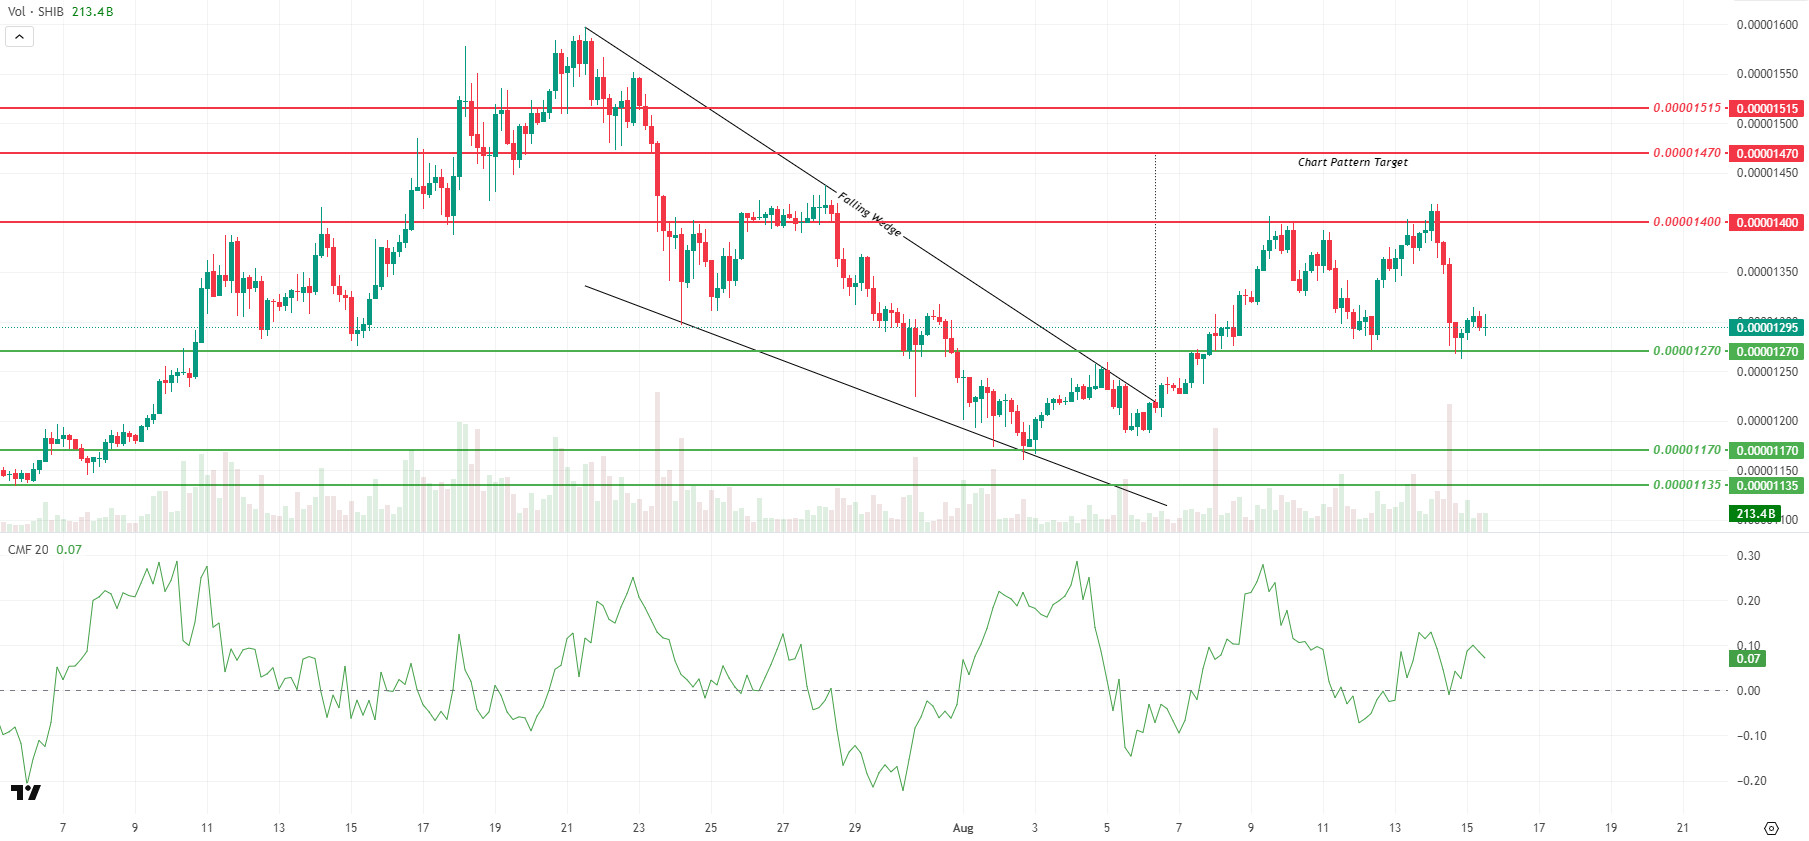
On the technical front, SHIB is showing limited recovery efforts by maintaining its support at $0.00001270 during the day. Currently trading at $0.00001295, the price is seeking a new upward momentum toward the critical resistance level of $0.00001400 in the short term. If it closes above this level, the 0.00001470 and 0.00001515 dollar levels could come into focus as targets. On the downside, a sustained move below the 0.00001270 dollar level could bring the 0.00001170 and 0.00001135 dollar support levels back into play.
The Chaikin Money Flow (CMF) indicator is at 0.07 in the positive zone, indicating that capital inflows are continuing. The increase in trading volume indicates that buyers are still active in the market. The Falling Wedge formation that has been forming since July 21 remains valid, and strong volume support and the break of critical resistance levels are crucial for reaching the formation’s target of 0.00001470 dollars.
Support levels: 0.00001270 – 0.00001170 – 0.00001135
Resistances: 0.00001400 – 0.00001470 – 0.00001515
LINK/USDT
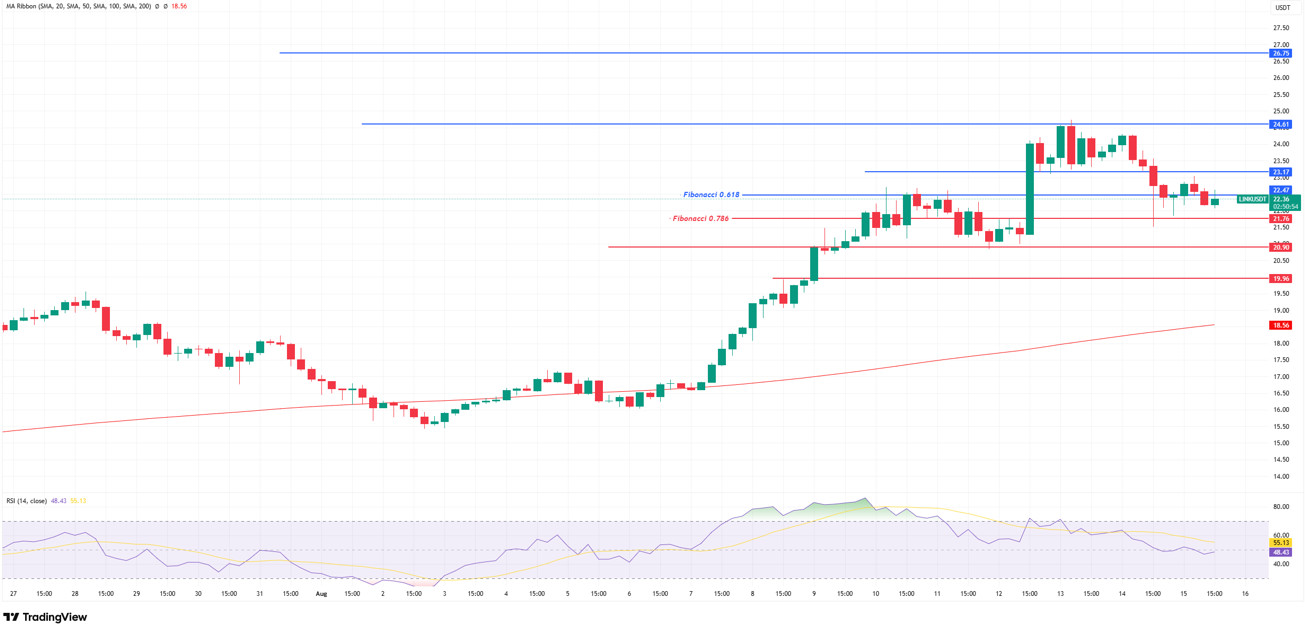
LINK, after pulling back from the 24.61 level, is attempting to stabilize at the Fibonacci 0.618 retracement level of 22.47. This level can be considered a critical threshold for determining the short-term direction. If it manages to hold above 22.47, the price is expected to first test the intermediate resistance level at 23.17, followed by the strong resistance level at 24.61. If there is a sustained break above 24.61, the upward trend is likely to gain momentum and bring the medium-term target of 29.75 back into focus.
On the other hand, if the price closes below the 22.47 level, it could lead to increased selling pressure. In such a scenario, the 21.98 level and then the Fibonacci 0.786 retracement at 21.76 would be critical support levels. A break below these supports could accelerate the decline, causing the price to retreat to the 20.90 and 19.90 levels.
The Relative Strength Index (RSI) is at 41 levels, indicating a weakening of momentum in the short term. While the RSI remaining below the 50 level suggests weak buyers, the fact that it has not entered the oversold zone keeps the possibility of a rebound alive. For an upward movement to gain strength, the RSI must rise back into the 50–55 band and the price must maintain its level above 23 dollars.
Support levels: 21.76 – 20.90 – 19.96
Resistance levels: 22.47 – 23.17 – 24.61
Legal Notice
The investment information, comments, and recommendations contained herein do not constitute investment advice. Investment advisory services are provided individually by authorized institutions taking into account the risk and return preferences of individuals. The comments and recommendations contained herein are of a general nature. These recommendations may not be suitable for your financial situation and risk and return preferences. Therefore, making an investment decision based solely on the information contained herein may not produce results in line with your expectations.


