
Technical Analysis
BTC/USDT
A dormant Bitcoin wallet was activated after 12 years and 330 BTC was transferred. The current value of this asset exceeds $39 million. Bitcoin fund management company K33 bought another 5 BTC, bringing its total holdings to 126 BTC. Turkey-based Martı Technologies Inc. announced that it will allocate 20% of its cash reserves to Bitcoin
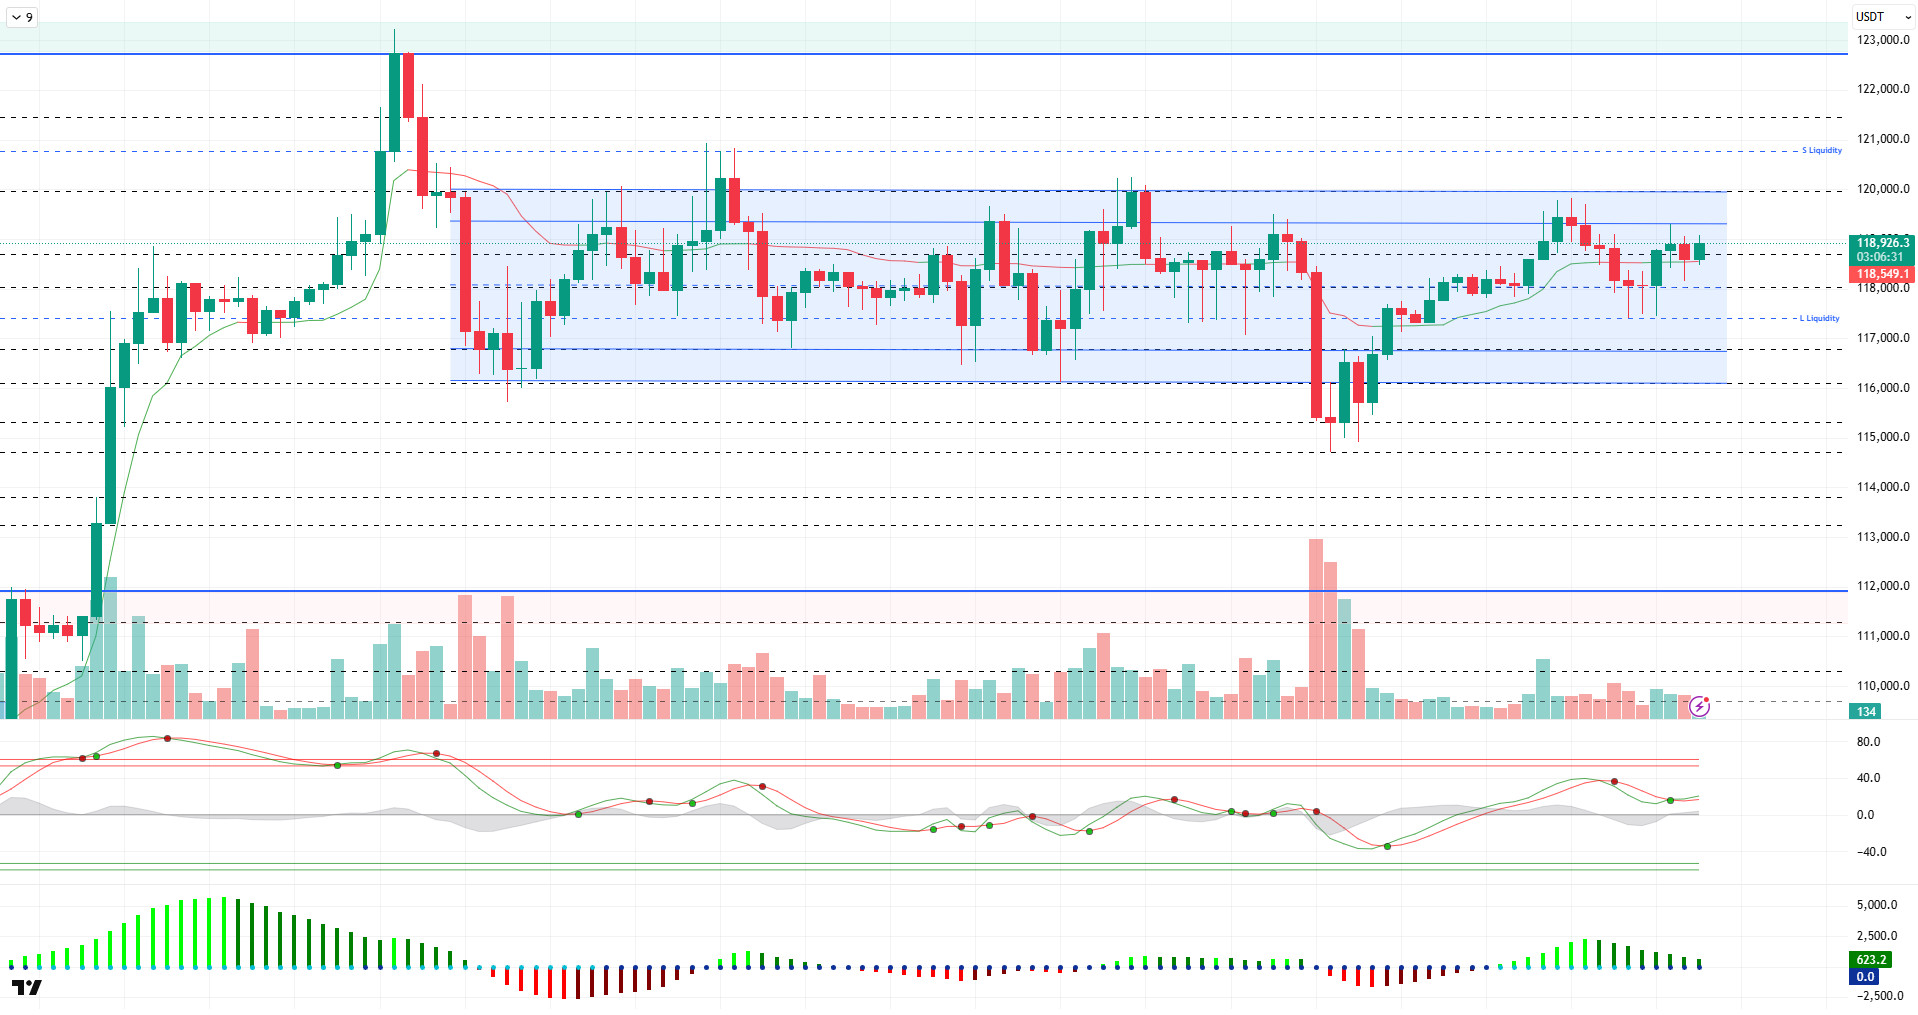
When we look at the technical outlook, it fell to 118,300 during the day, moving slightly sellers who pushed over 119,000 in the previous analysis. BTC, which then rebounded, continues to push the 119,000 level once again at the time of writing the analysis.
On the technical indicators front, the Wave Trend (WT) oscillator turned its direction back to the overbought zone after the trend reversal in the channel mid-band with the decline. The Squeeze Momentum (SM) indicator is trying to regain momentum in the positive zone. The Kaufman moving average is just below the price at 118,500.
Looking at the liquidity data, it is seen that the buying levels in the 115,000 – 116,000 band were liquidated with the decline, while the selling transactions in the 118,000 – 119,000 band were liquidated with the rise. While the 120,600 level stands out as the closest liquidity area, it is observed that the buying level is re-accumulating at 117,000.
To summarize, BTC, which once again gained momentum amid fundamental developments, came back to its consolidated bandwidth. The technical outlook is approaching overbought territory, while liquidity data continues to define price limits. While a further rise in the price seems likely from a technical and liquidity perspective, the breach of the 120,000 resistance point will be followed in the first stage. If it breaks, it may face selling pressure from the 120,600 liquidity zone. In case of a possible new selling pressure, 117,500 stands out as a support point in case of a break of 118,600.
Supports 118,600 – 118,000 – 117,500
Resistances 120,000 – 120,600 – 121,500
ETH/USDT
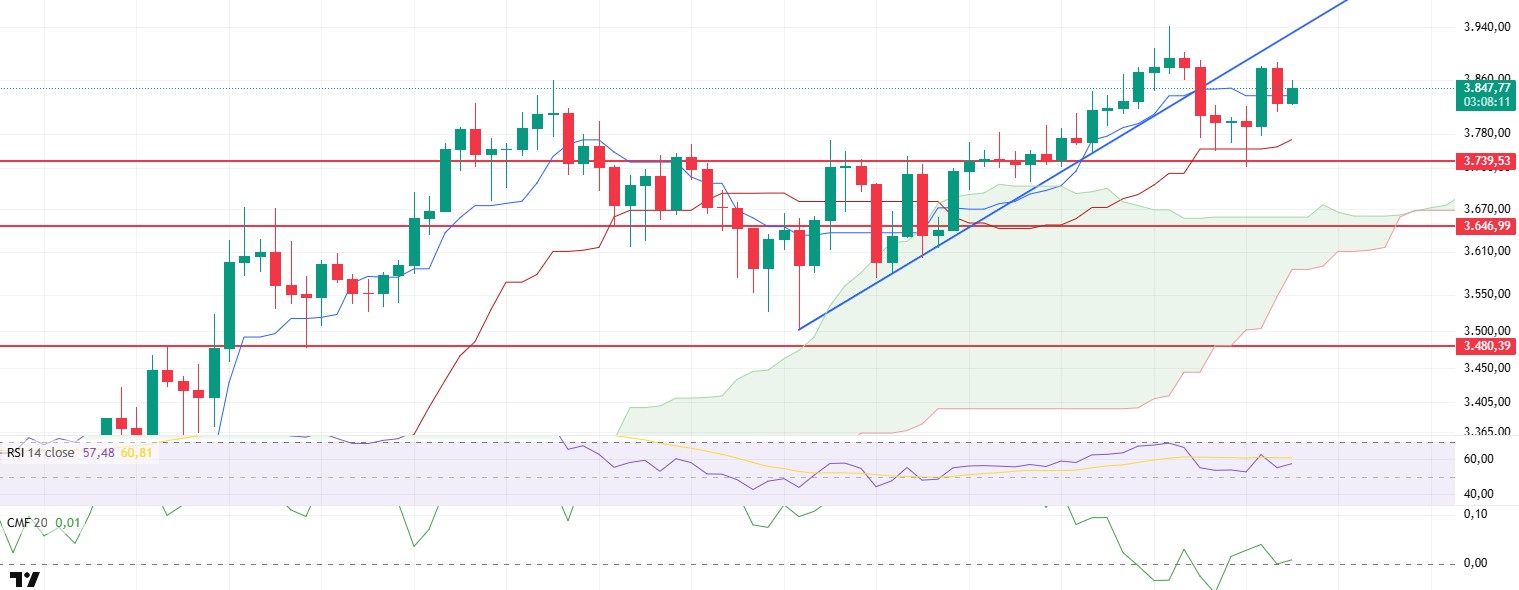
ETH price followed a buying trend during the day and managed to rise to the level of $ 3,884. However, with the selling pressure from this level, the price retreated slightly and is currently trying to hold around $3,850. This pullback indicates continued weakness in the short-term outlook, especially when considered together with the fact that the descending trend line indicated in blue on the chart has still not been crossed. The price’s inability to break this trend suggests that buyers are not strong enough and the sell side is still dominant.
Technical indicators support this weakness. Although the Relative Strength Index (RSI) tried to rise above the MA-based average line by increasing momentum with the price rise during the day, it could not stay in this region and retreated again. The failure of the RSI to hold above the average line in this way suggests that the upside remains limited and there is a clear weakness in momentum. This reflects that buyers are powerless to sustain the momentum and a cautious stance persists across the market.
The Chaikin Money Flow (CMF) indicator presents a similar picture. Despite the upward movement in the price, the flat course of CMF reveals that the rise is not supported by liquidity inflows and the buying side is not strong in terms of volume. In other words, even if the price goes up, there is no serious money inflow behind this movement, which raises serious questions about the permanence of the rise.
In general terms, downside risks can be expected to increase if the price fails to break through the trend line at $2.930 in the evening. Breaking this trend upwards is critical for recovery in the short term. However, unless this happens, the price is likely to face selling pressure again and continue its downward movement. Below, the $2,739 level is monitored as an important support. If this area is broken, a technically stronger wave of selling may come into play and the decline may gain momentum.
Supports 3,739 – 3,646 – 3,480
Resistances 4,084 – 4,381 – 4,857
XRP/USDT
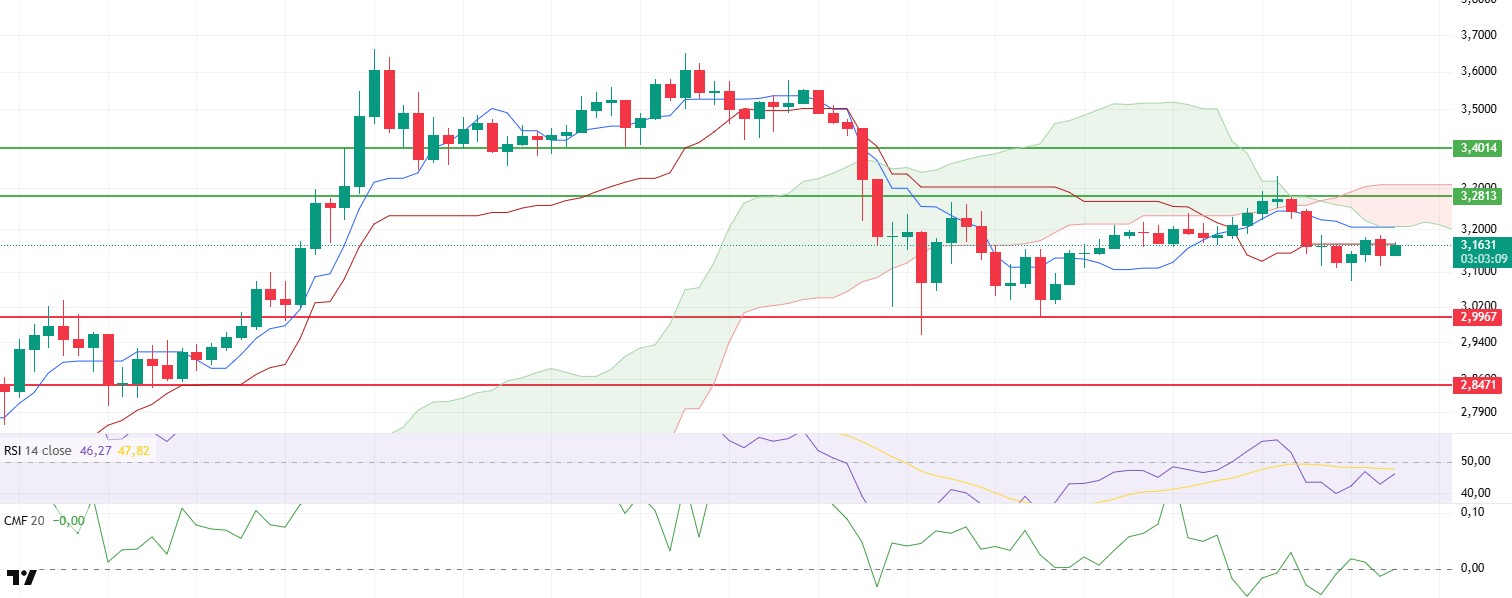
XRP price managed to maintain its position above the $3.15 level by moving sideways in a narrow band during the day. However, this sideways movement shows that the search for direction in the short term continues and the market is moving in uncertainty. In particular, the lack of a clear upward momentum and the inability of the price to break through critical resistance levels indicate that a cautious attitude prevails in the current outlook.
When technical indicators are analyzed, the ichimoku indicator shows that the price continues to hover below both the tenkan and kijun levels, as well as pricing below the kumo cloud. This situation reveals that technically, bearish pressure is still in effect and a bullish structure has not yet formed. In particular, staying below all the main components of ichimoku indicates that the buyer side remains weak and the negative scenario is stronger in the short term.
The fact that the Chaikin Money Flow (CMF) indicator remained flat around the zero line supports this view. The lack of a clear direction in liquidity flows suggests that there is no fresh money flowing into the market and buying volume remains weak. While this shows that the price lacks the basic support necessary for the price to go up, it is a warning that possible rises may remain limited.
The Relative Strength Index (RSI) indicator also remains weak, confirming that the current lack of momentum continues. The fact that the RSI is close to neutral levels and does not give a bullish signal to support upward momentum indicates that the price is struggling to start a new uptrend and remains weak in the short term.
Within this overall technical picture, it is critical to overcome the kumo cloud and kijun resistances, which coincided with the $3.2068 level in the evening. If this level is breached, a short-term upward movement may be triggered and the price may be able to move towards higher resistance levels again. However, if this resistance zone cannot be overcome, selling pressure may increase again and the possibility of the price continuing its downward movement may become stronger. For this reason, The $3.2068 level should be closely monitored; the price’s reaction to this region will be decisive in determining the short-term direction.
Supports 2.9967 – 2.8471 – 2.6513
Resistances 3.2813 – 3.4014 – 3.8615
SOL/USDT
Cboe BZX filed for a Solana ETF with spot access and built-in staking rewards.
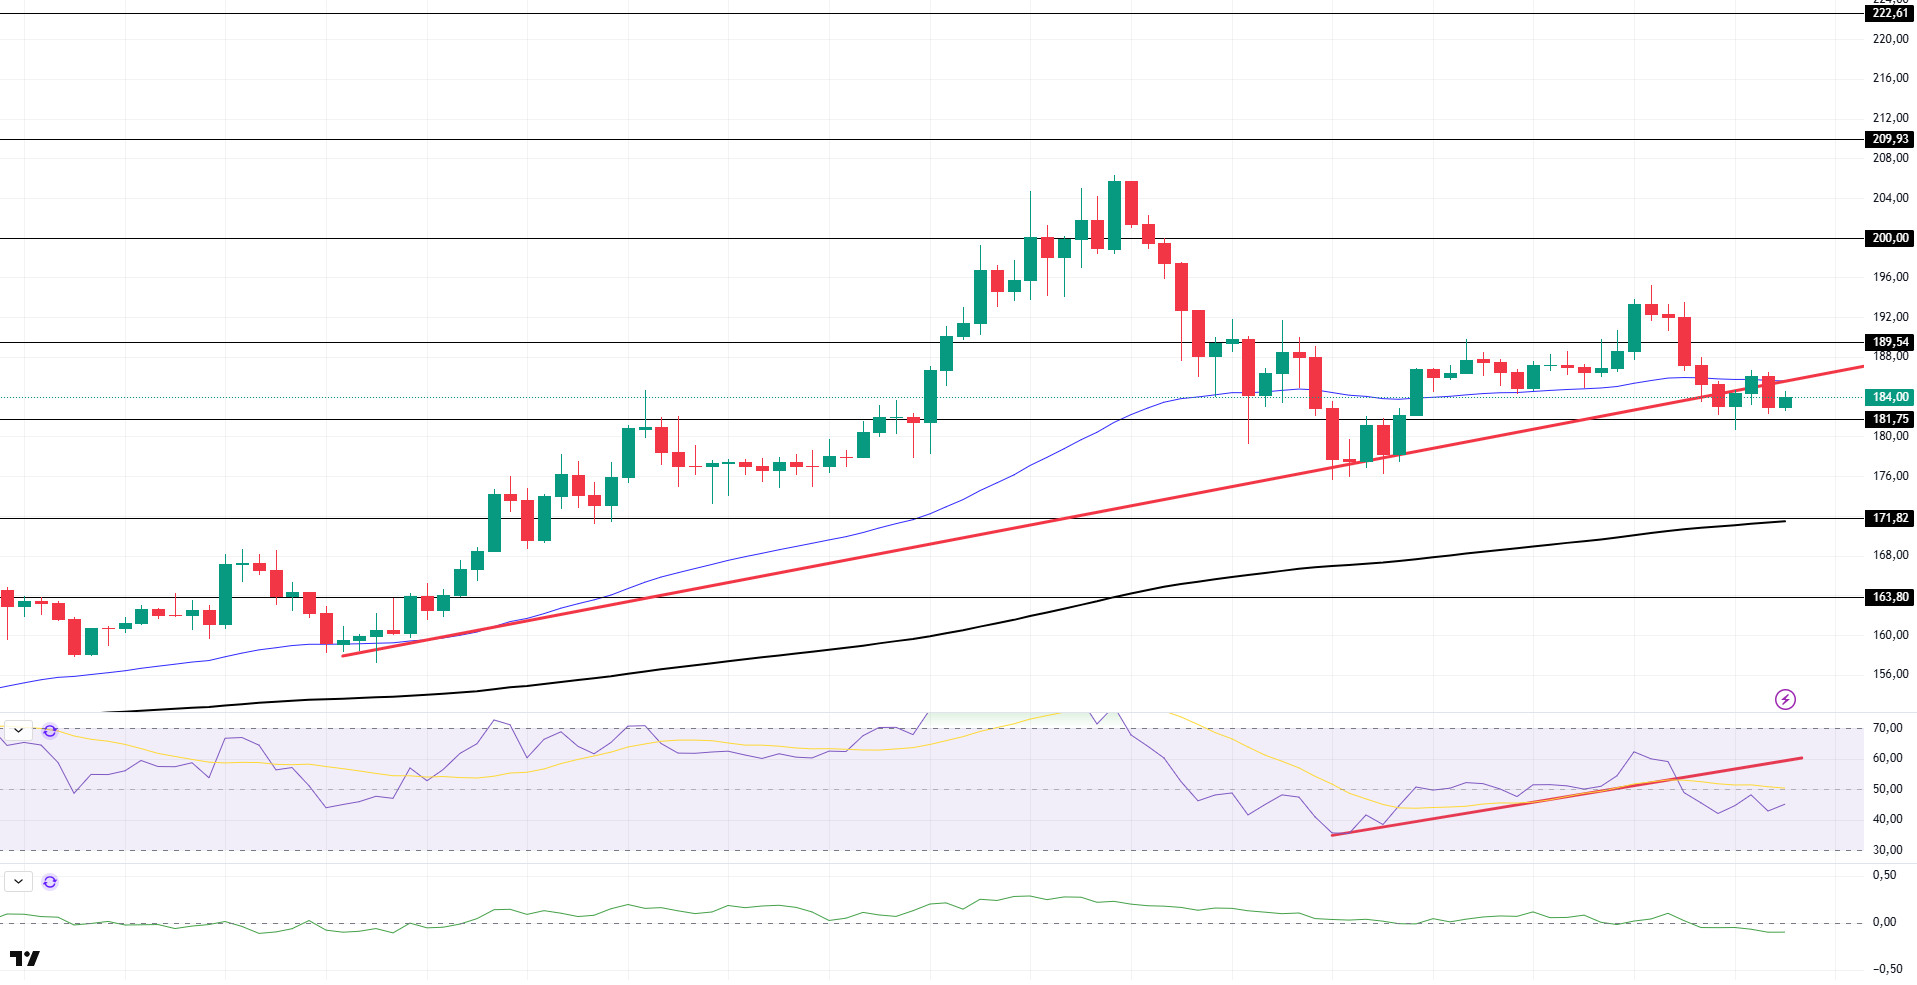
SOL price was slightly lower during the day. The asset tested the uptrend that started on July 15 as resistance but failed to break it and retreated from there. It is currently testing the strong support level of $ 181.75. If the pullback continues, the 200 EMA (Black Line) moving average can be followed. If the rises begin, the $ 189.54 level can be followed.
On the 4-hour chart, the 50 EMA (Blue Line) continues to be above the 200 EMA (Black Line). This indicates that the upward trend may continue in the medium term. At the same time, the fact that the price is between both moving averages suggests that the market is currently in the decision phase. Chaikin Money Flow (CMF-20) started to be in negative territory. However, a decline in inflows could take CMF deeper into the negative territory. Relative Strength Index (RSI-14) continued to be below the uptrend that started on July 25. The $189.54 level stands out as a strong resistance point in the event of a rally on the back of macroeconomic data or positive news on the Solana ecosystem. If this level is broken upwards, the rise can be expected to continue. If there are pullbacks due to contrary developments or profit realizations, the $ 171.82 level can be tested. In case of a decline to these support levels, the increase in buying momentum may offer a potential bullish opportunity.
Supports 181.75 – 171.82 – 163.80
Resistances 189.54 – 200.00 – 209.93
DOGE/USDT
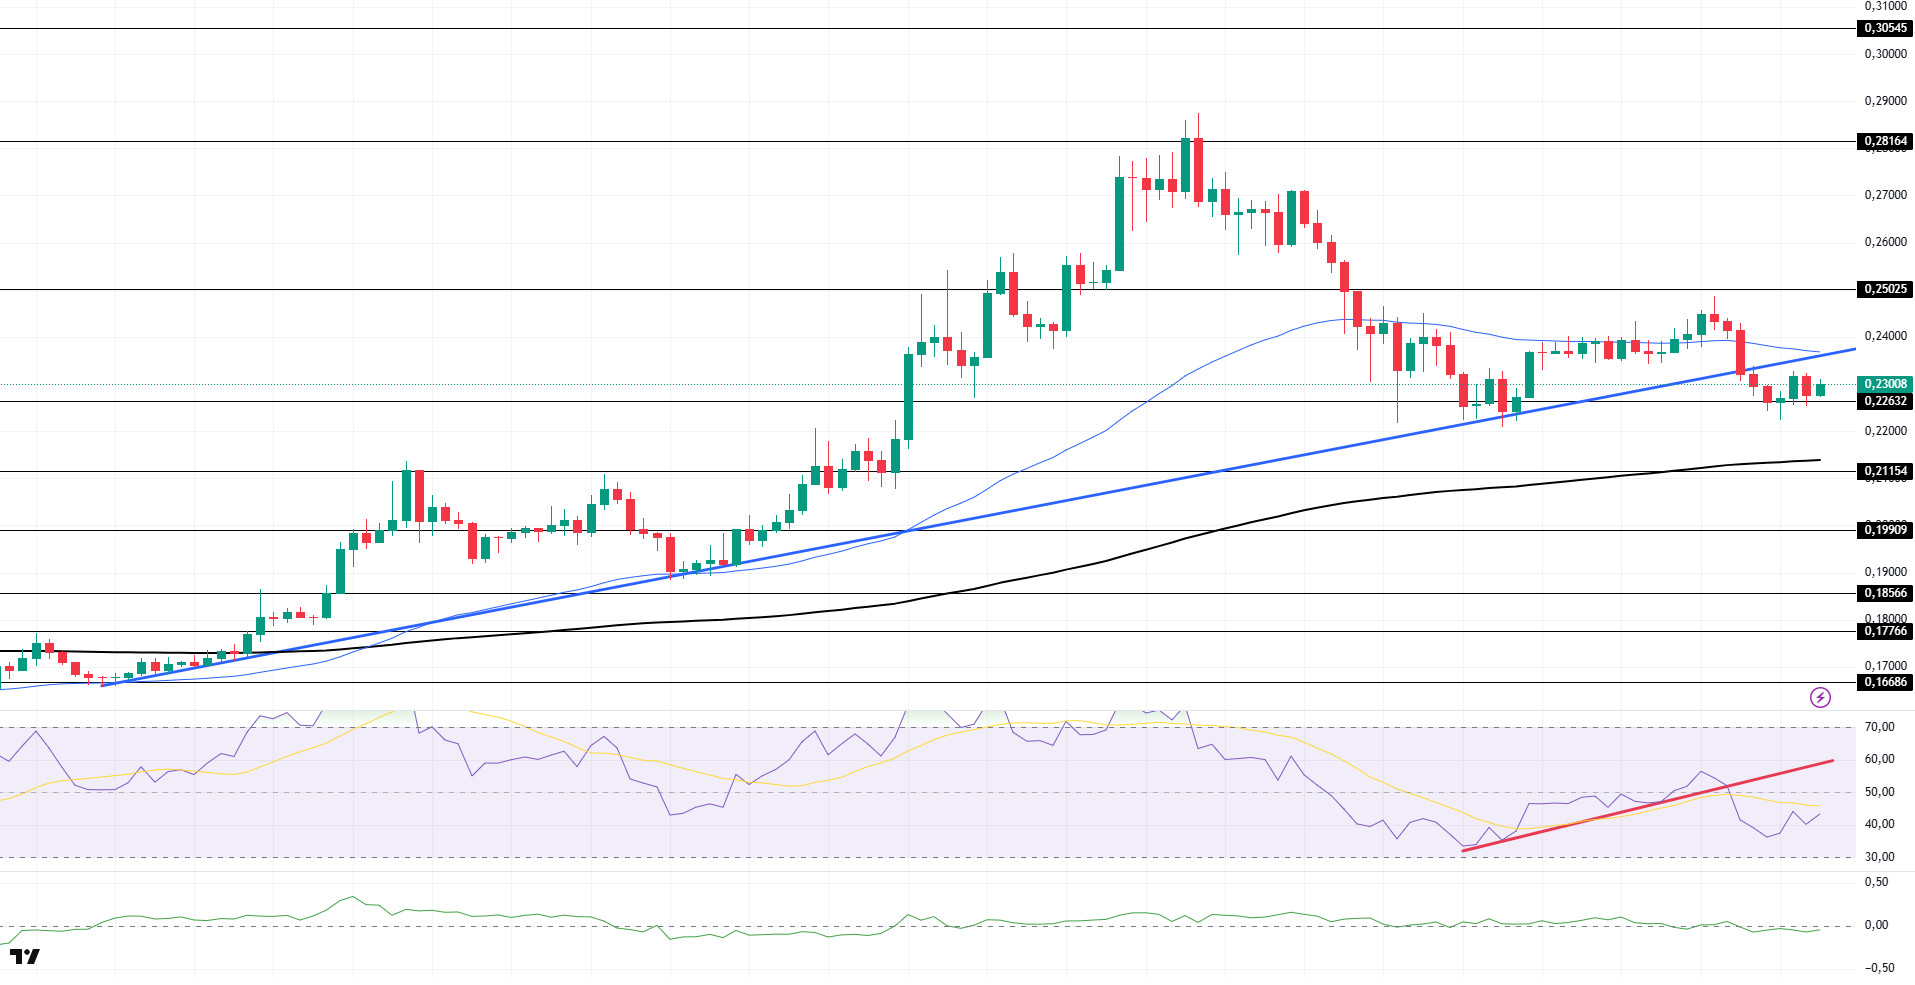
DOGE price was flat during the day. The asset continued to be below the 50 EMA (Blue Line) moving average with the uptrend that started on July 7. The price is currently testing the $0.22632 level as support. If the pullback continues, the 200 EMA (Black Line) moving average can be followed as a support level. If the uptrend starts, the $0.25025 level should be followed.
On the 4-hour chart, the 50 EMA (Blue Line) continues to be above the 200 EMA (Black Line). This suggests that the asset is bullish in the medium term. The fact that the price is between both moving averages suggests that the asset is in the decision phase in the short term. Chaikin Money Flow (CMF-20) continued to be negative. In addition, negative inflows may push CMF deeper into the negative territory. Relative Strength Index (RSI-14) continued to be in negative territory. In addition, it started to be below the uptrend that started on July 25. This may continue the decline. The $0.25025 level stands out as a strong resistance zone in case of a possible rise in line with political developments, macroeconomic data or positive news flow in the DOGE ecosystem. In the opposite case or possible negative news flow, the $0.21154 level may be triggered. In case of a decline to these levels, the momentum may increase and a new bullish wave may start.
Supports 0.22632 – 0.21154 – 0.19909
Resistances 0.25025 – 0.28164 – 0.30545
Legal Notice
The investment information, comments and recommendations contained herein do not constitute investment advice. Investment advisory services are provided individually by authorized institutions taking into account the risk and return preferences of individuals. The comments and recommendations contained herein are of a general nature. These recommendations may not be suitable for your financial situation and risk and return preferences. Therefore, making an investment decision based solely on the information contained herein may not produce results in line with your expectations.

