
Technical Analysis
BTC/USDT
Hawkish statements from Fed Chair Powell and members, coupled with weaker-than-expected employment data, triggered a sell-off in markets, reducing expectations for a December rate cut to 51.6%. With the government reopening, non-farm payroll reports are expected next week, though October data may be incomplete due to the shutdown’s impact. Meanwhile, Trump announced that the shutdown cost the country $1.5 trillion and that TSA employees would receive $10,000 in compensation.
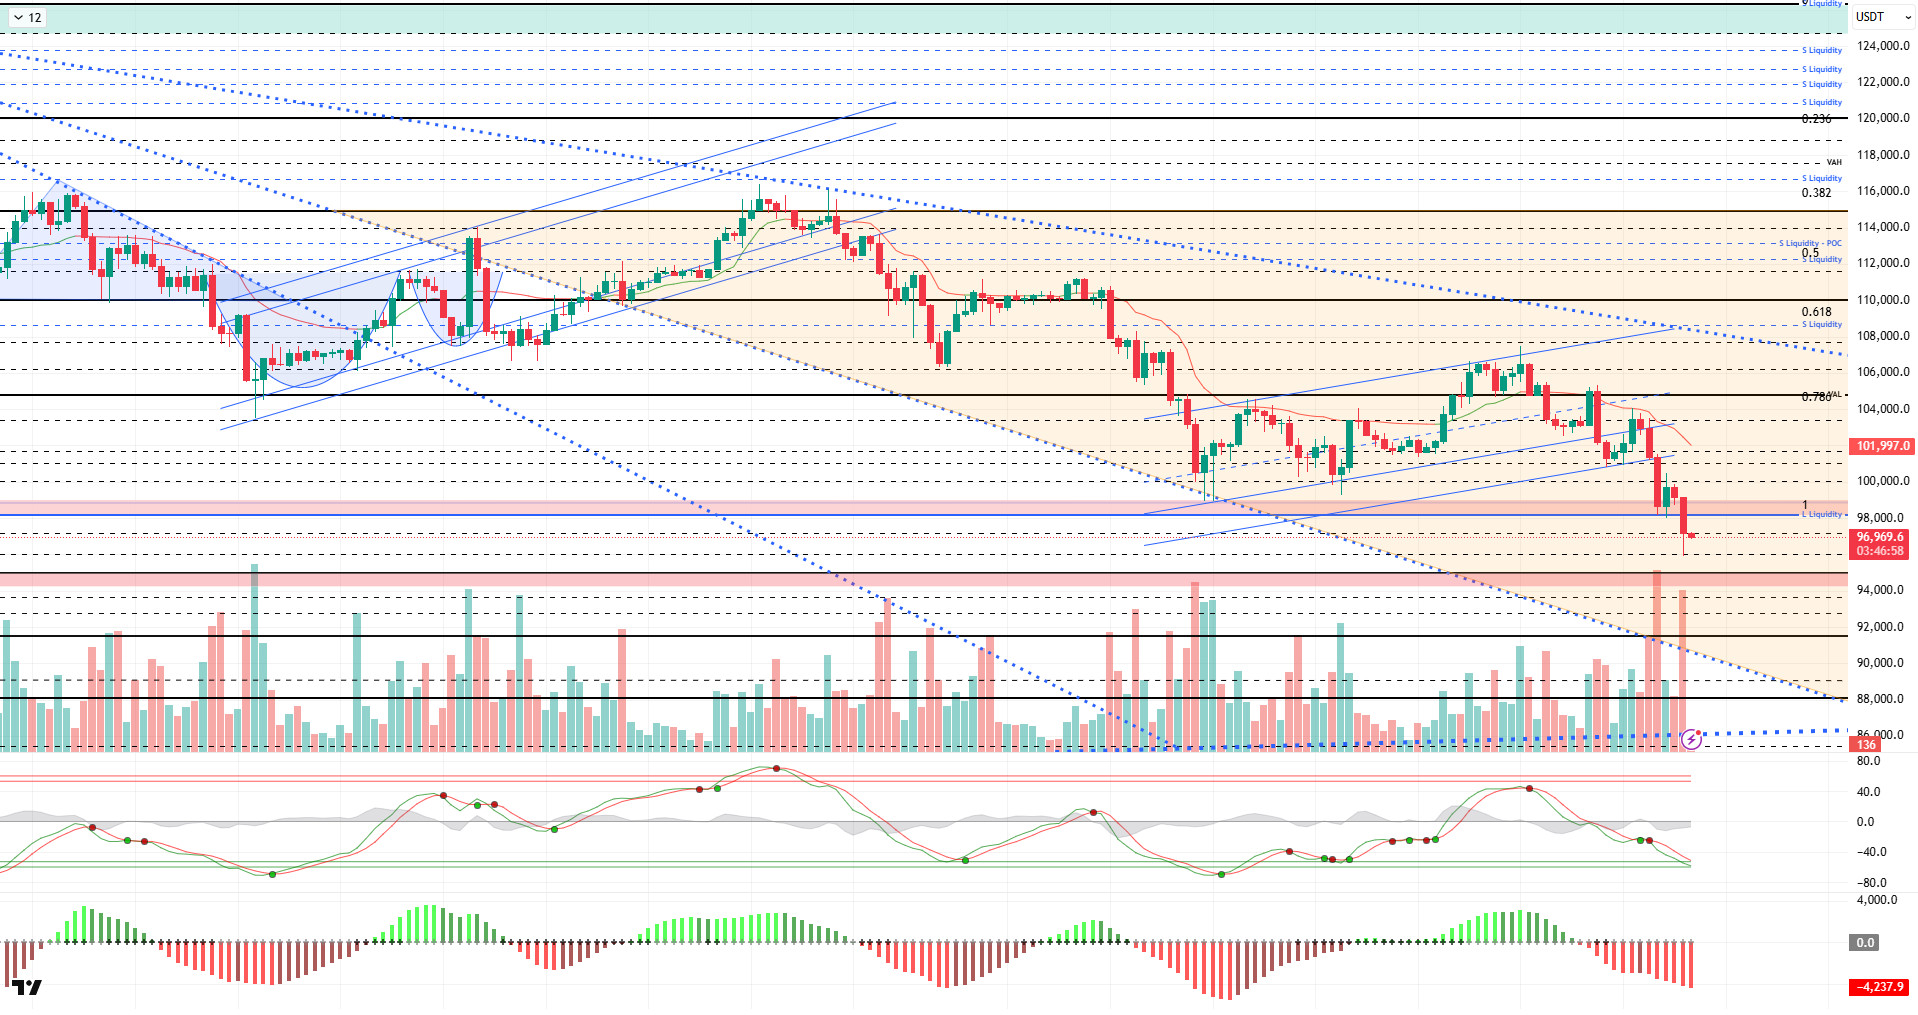
From a technical perspective, BTC was testing the 103,300 level within the minor uptrend channel mentioned in previous analyses, but faced heavy selling pressure due to the developments mentioned above and lost six-figure levels. The price fell to the 98,000 level after losing the 101,800 and 100,000 support points, respectively. Although it subsequently surpassed the 100,000 level again, it was unable to sustain it, spiking to the 96,000 level and exhibiting high volatility. At the time of writing, the price continues to trade at the 97,200 level, seeking equilibrium.
Technical indicators have reversed the buy signal given in the middle band of the Wave Trend (WT) channel back to a sell signal and have entered the oversold zone. The Momentum (SM) indicator’s histogram continues its momentum within the negative zone. The Kaufman Moving Average (KAMA) is currently at $102,450, positioned above the price.
According to liquidation data, trading clusters at the 100,000 – 102,000 level were liquidated with the recent decline. In a broader time frame, the buy level resulted in liquidation at the 98,000 level.In the short term, the selling level is concentrated above the 98,000 and 100,000 levels, while in the broader time frame, the 104,000 – 105,000 band has become the liquidity zone. In the last 24 hours, a total of $1.1 billion in liquidations were recorded in the market.
In summary, with the 49-day shutdown officially ending following the Senate vote in the US government, attention turned to the macro data set. While Fed members remain divided on interest rate cuts, Fed Chair Powell highlighted the lack of data and maintained his cautious stance. Technically speaking, the price first broke below the minor uptrend channel, then slipped below the six-digit level to retreat to the 96,000 region. If selling pressure persists, the 95,000 support level, last tested in May and long monitored as an important reference area, could come back into play. On the other hand, if the pullback stabilizes and a short-term rebound occurs, the 98,000 level will be monitored first as a resistance and liquidity zone.
Supports: 97,200 – 96,000 – 95,000
Resistances: 98,000 – 100,000 – 101,800
ETH/USDT
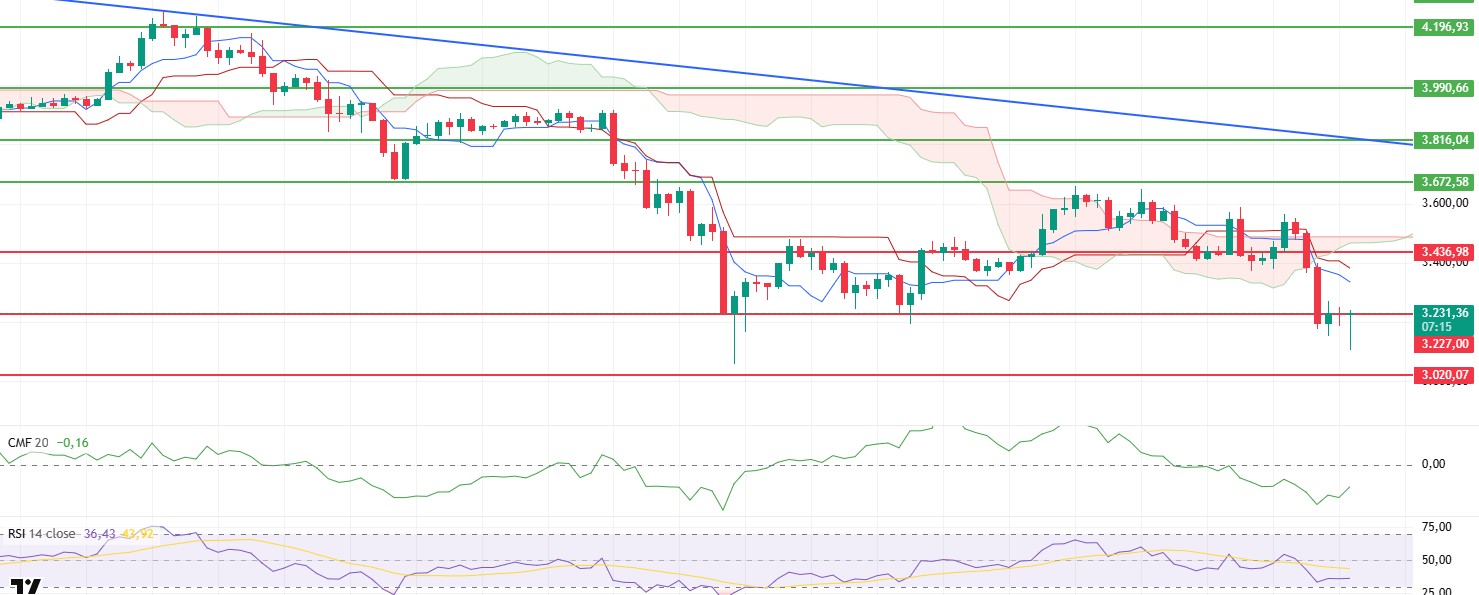
The ETH price fell to $3,104 after losing its $3,436 support level yesterday evening, as selling pressure accelerated. Reactionary buying in the morning hours pushed the price up to the $3,227 resistance level, and it is currently attempting to gain ground in this area. The reactive nature of the movement indicates that uncertainty persists in the short term.
The CMF indicator plunged sharply into negative territory during the decline, revealing strong liquidity outflows. Although a slight recovery was seen in the morning hours, the CMF’s continued stay in negative territory indicates that the upward movement lacks liquidity support. This structure reveals that buyers have not yet gained strength.
On the RSI side, the horizontal trend at the 35 level indicates that weakness persists and momentum loss has not yet stopped. This situation signals that short-term rises may be limited.
The Ichimoku indicator confirms a weak technical outlook as the price remains below the Kumo cloud and trades below the Tenkan and Kijun levels. Risks remain dominant as the trend structure has not yet begun to recover.
As there is no clear reversal in the indicators, it seems difficult at this stage for the current rises to become permanent. However, if the price manages to hold above the $3,227 level, a recovery attempt towards the $3,436 level may come to the fore. If it remains below this region, the possibility of a continued decline will be at the forefront.
Below the Form
Support levels: 3,227 – 3,020 – 2,900
Resistances: 3,436 – 3,672 – 3,816
XRP/USDT
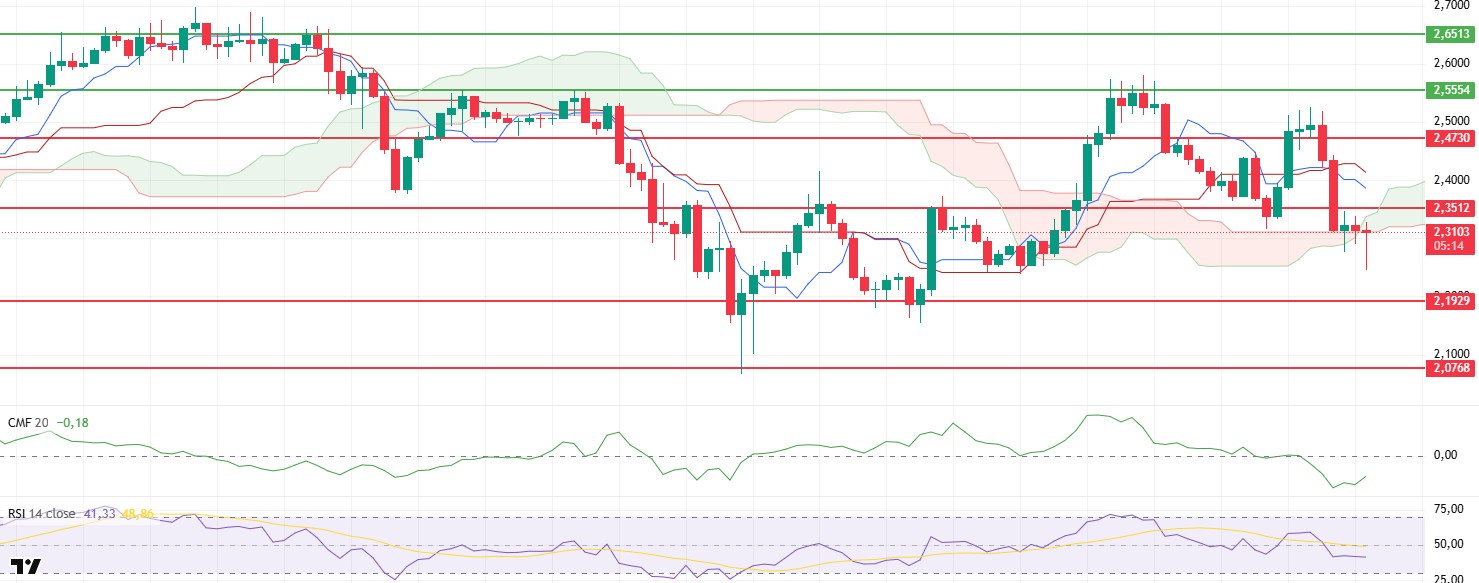
XRP fell below the $2.35 level yesterday amid selling pressure and retreated to the $2.24 region during the day. Buying activity in the morning pushed the price back above the $2.30 level. The fact that the move was reactive indicates that the pressure on the trend has not completely subsided.
The CMF indicator continued its downward trend in negative territory yesterday. With the recovery seen this morning, it began to signal an upward reversal. This slight recovery in liquidity flow supports the price’s desire to take a breather in the short term.
The RSI indicator fell below the 50 level, revealing a weak momentum structure. Price movements remain sensitive as the process of buyers gaining strength is not yet complete.
The price fell below the Tenkan Kijun and kumo cloud levels yesterday, weakening the technical outlook. With the rise in the morning hours, the price managed to re-enter the kumo cloud. This structure keeps the possibility of a short-term recovery alive.
The price may retest the $2.35 resistance level during the day. Reclaiming this level could strengthen the upward momentum. Conversely, remaining below $2.35 would signal that intraday pullbacks may continue.
Supports: 2.1929 – 2.0768 – 1.9092
Resistances: 2.3512 – 2.4730 – 2.5554
SOL/USDT
Solana-focused Upexi approved a $50 million share buyback as digital asset treasuries turn to buybacks. VanEck filed an 8-A form indicating that its Solana spot ETF will be launched soon.
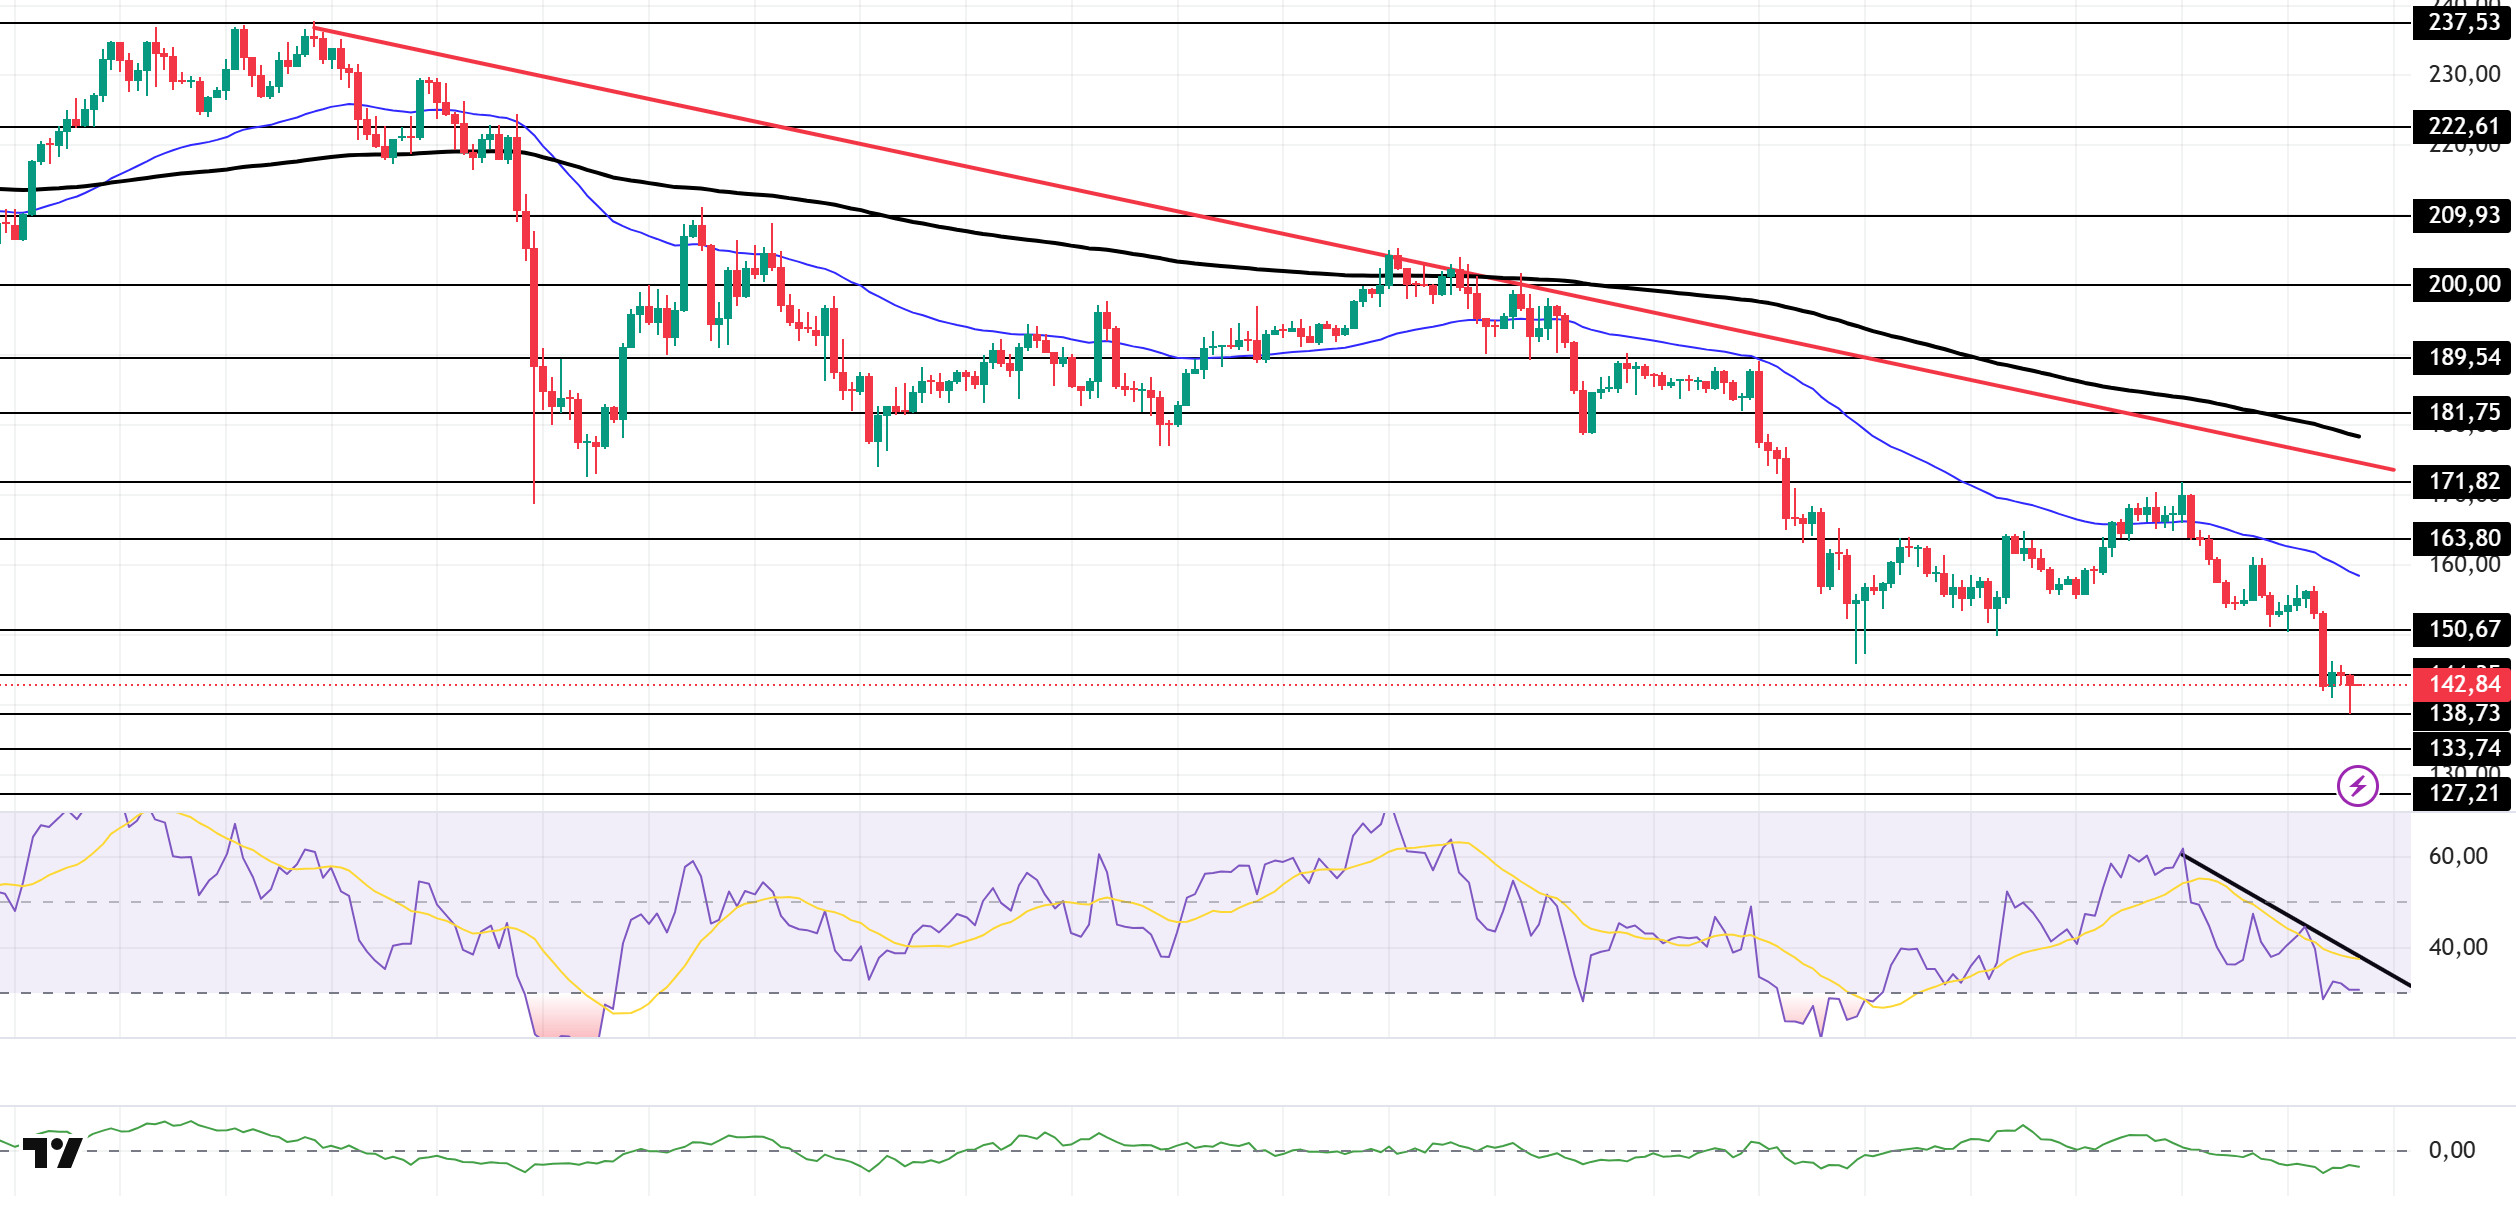
The SOL price deepened its decline, losing approximately 12% in value. The asset remained in the lower region of the downtrend that began on October 6. It also broke below the strong support level of $150.67 and continued to trade below this level. Currently experiencing a slight uptick from the strong support level of $138.73, the price could test the 50 EMA moving average if the uptrend continues. If the pullback deepens, the $127.21 level could act as support.
On the 4-hour chart, it remained below the 50 EMA (Exponential Moving Average – Blue Line) and 200 EMA (Black Line). This indicates a possible downtrend in the medium term. At the same time, the price being below both moving averages shows us that the asset is in a downward trend in the short term. The Chaikin Money Flow (CMF-20) is in negative territory. However, the decrease in money inflows could push the CMF deeper into negative territory. The Relative Strength Index (RSI-14) is in the oversold zone. It also remained below the downward trend that began on November 11. These indicate increased selling pressure. If there is an upturn due to macroeconomic data or positive news related to the Solana ecosystem, the $163.80 level stands out as a strong resistance point. If this level is broken upwards, the uptrend is expected to continue. If pullbacks occur due to developments in the opposite direction or profit-taking, the $127.21 level could be tested. A decline to these support levels could increase buying momentum, presenting a potential upside opportunity.
Supports: 138.73 – 133.74 – 127.21
Resistances: 144.35 – 150.67 – 163.80
DOGE/USDT
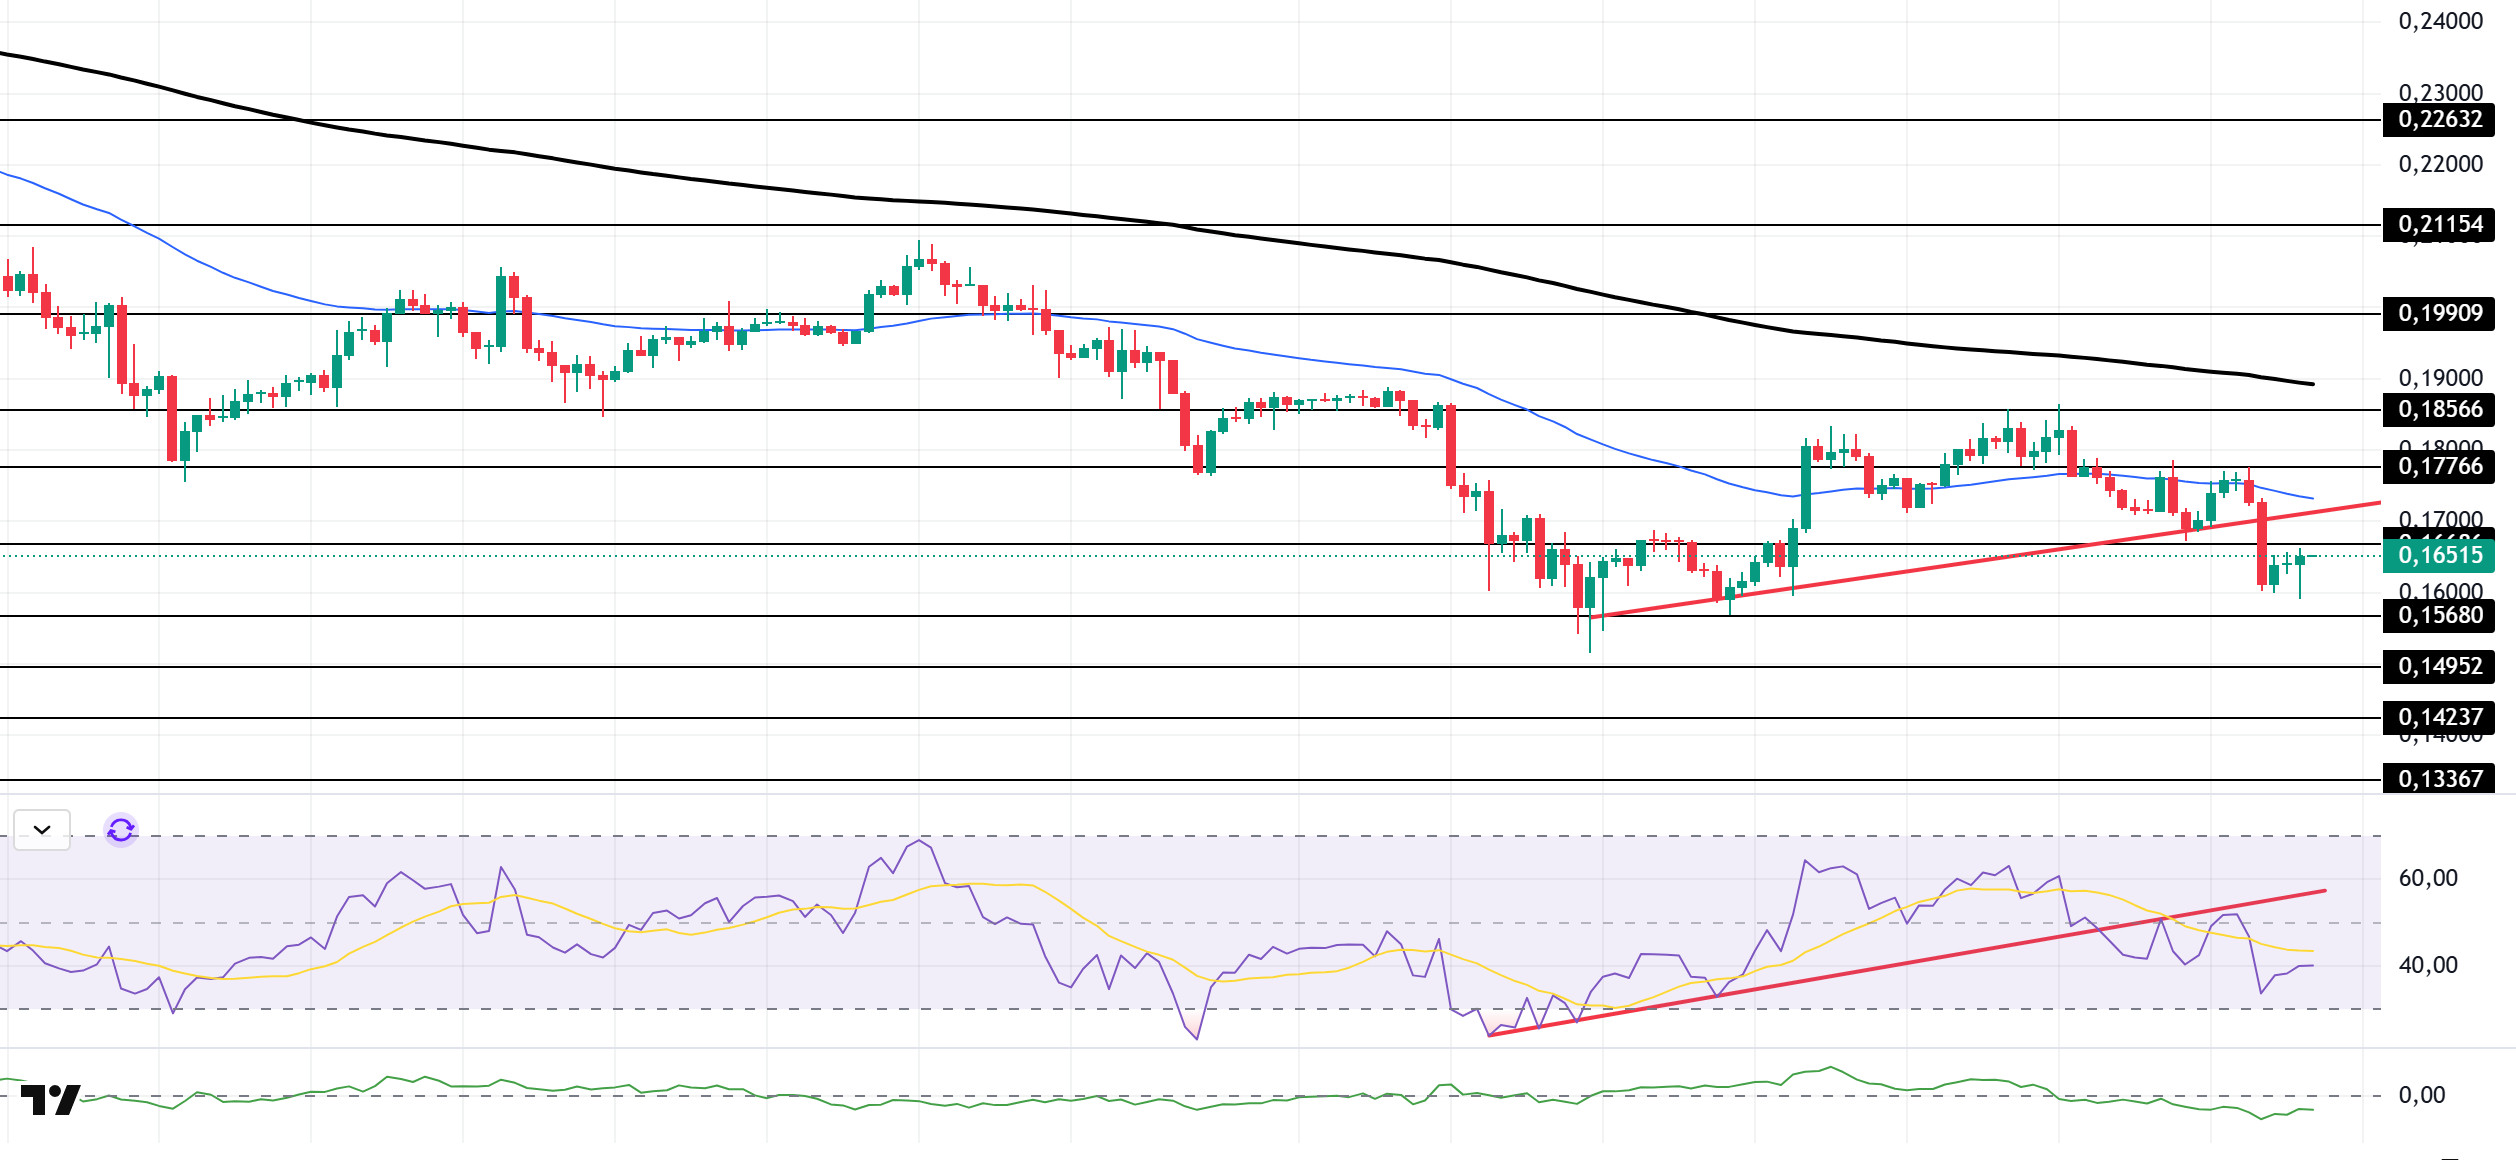
DOGE price has declined. The asset broke below the upward trend that began on November 4 with a strong bearish candle, continuing its decline and remaining below this trend. The asset, which faced resistance from the 50 EMA (Blue Line) moving average, lost approximately 8% in value. The price is currently experiencing a slight uptick. If the uptrend continues, it may test the 50 EMA (Blue Line) moving average as resistance. If the pullback continues, the $0.14952 level may act as support.
On the 4-hour chart, the 50 EMA (Exponential Moving Average – Blue Line) remained below the 200 EMA (Black Line). This indicates that a medium-term downtrend may begin. The price being between the two moving averages indicates that the price is in a decision phase in the short term. The Chaikin Money Flow (CMF-20) continues to be in the negative zone, close to the neutral zone. Additionally, a decrease in cash inflows could push the CMF deeper into negative territory. The Relative Strength Index (RSI-14) retreated to the middle of the negative zone. It also remained below the upward trend that began on November 3, signaling continued selling pressure. In the event of potential increases driven by political developments, macroeconomic data, or positive news flow within the DOGE ecosystem, the $0.17766 level stands out as a strong resistance zone. Conversely, in the event of negative news flow, the $0.14237 level could be triggered. A decline to these levels could increase momentum and initiate a new wave of growth.
Supports: 0.15680 – 0.14952 – 0.14237
Resistances: 0.16686 – 0.17766 – 0.18566
LTC/USDT
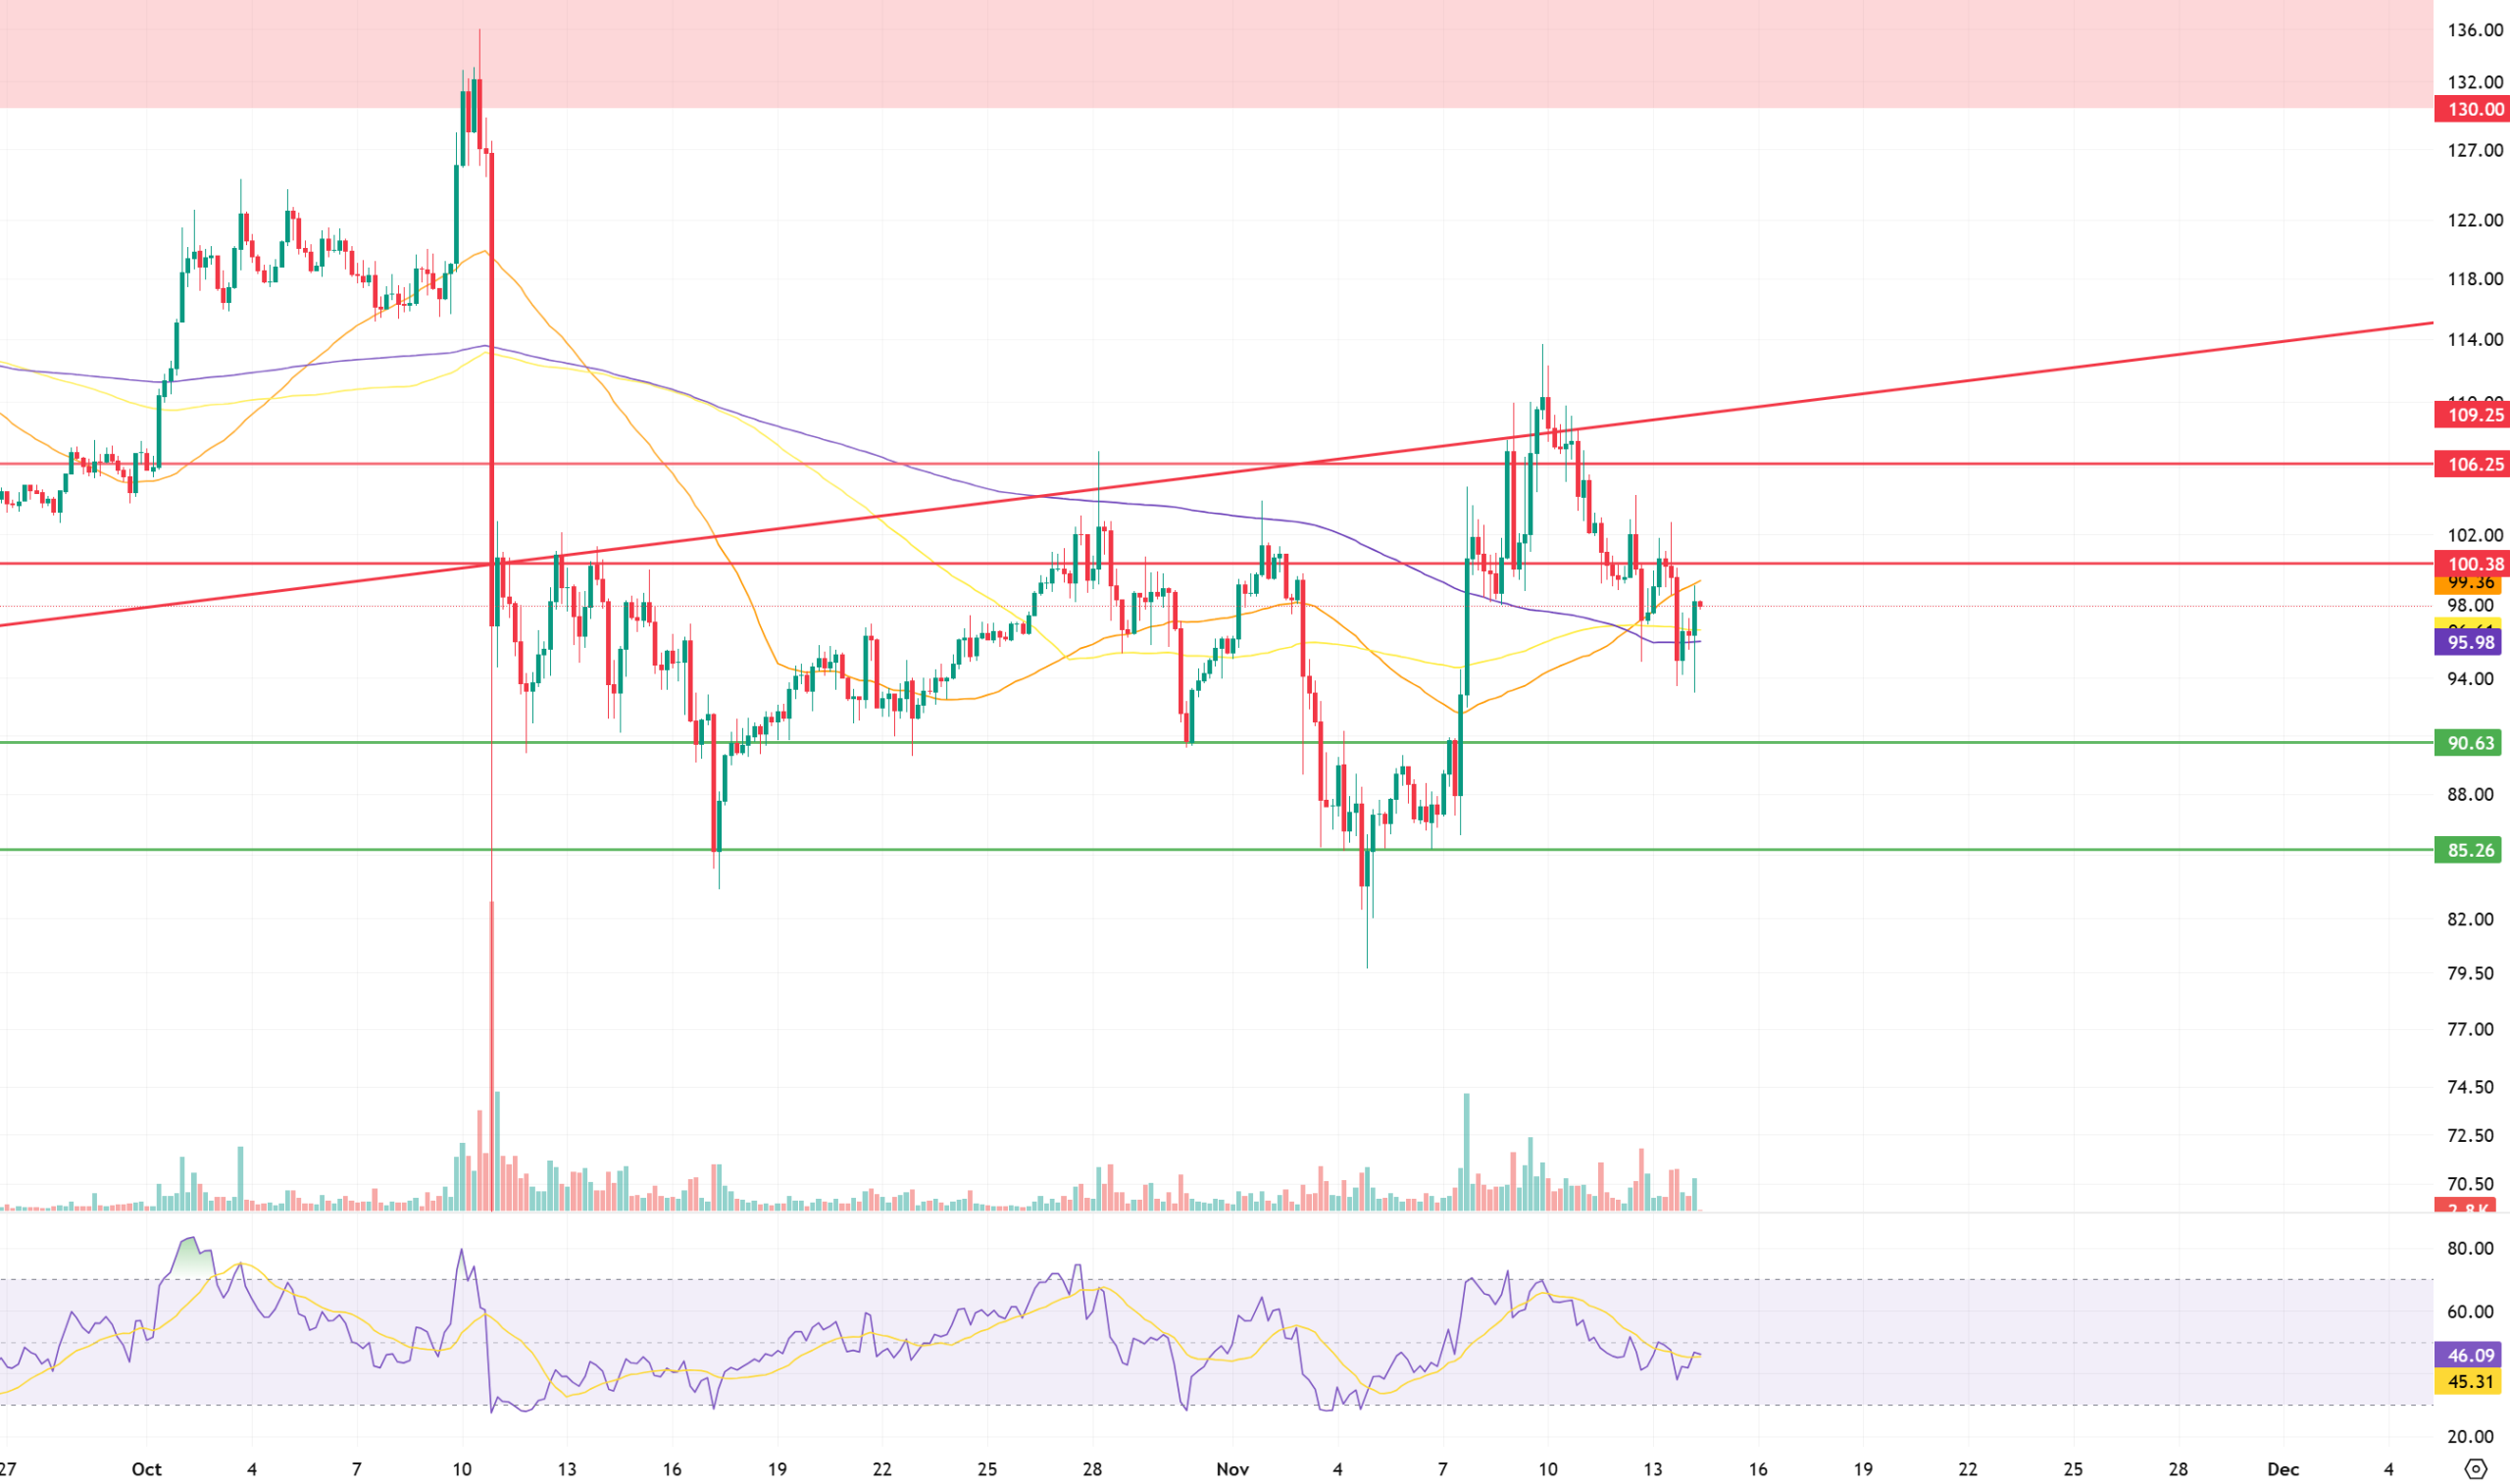
Litecoin (LTC) / USDT pair price movements closed the previous day with a 1.07% loss in value. During the same period, LTC showed a 0.83% increase compared to Bitcoin, indicating that Litecoin has maintained its value to some extent against the movement experienced by Bitcoin. On the futures side, the long/short position ratio opened in the last 24 hours being at 0.9662 reveals that derivative market participants’ expectations for a decline are slightly heavier. However, funding rates are positive.
Technically, examining Litecoin’s 4-hour USDT pair chart, the fact that it continues above the 200 and 100-period moving averages, but below the 50-period moving average and also below the rising trend, indicates a downward expectation, along with more short positions in the derivatives market. However, upward movements are also possible. If this possibility materializes, the first point where the rise could be suppressed is the 100.38 level, which is an important level that will create selling pressure at the horizontal resistance. Subsequently, it encounters another intraday horizontal resistance at 106.25. Finally, it should not be overlooked that short positions may increase partially if the price reaches the lower band of the rising trend, currently at 109.25.
If a pullback occurs in line with expectations, the 200- and 100-period moving averages (purple and yellow lines), which are close to each other on the chart, could support the price in the short term. However, if a clear level must be specified, the 95.98 level, where the 200-period average passes, stands out as strong support. Further down, horizontal support is positioned at 90.63. Finally, the potential for a local bottom forming at 85.26 intraday could be seen as an important level where support could hold during declines.
Supports: 95.98 – 90.63 – 85.26
Resistances: 100.38 – 106.25 – 109.25
BNB/USDT
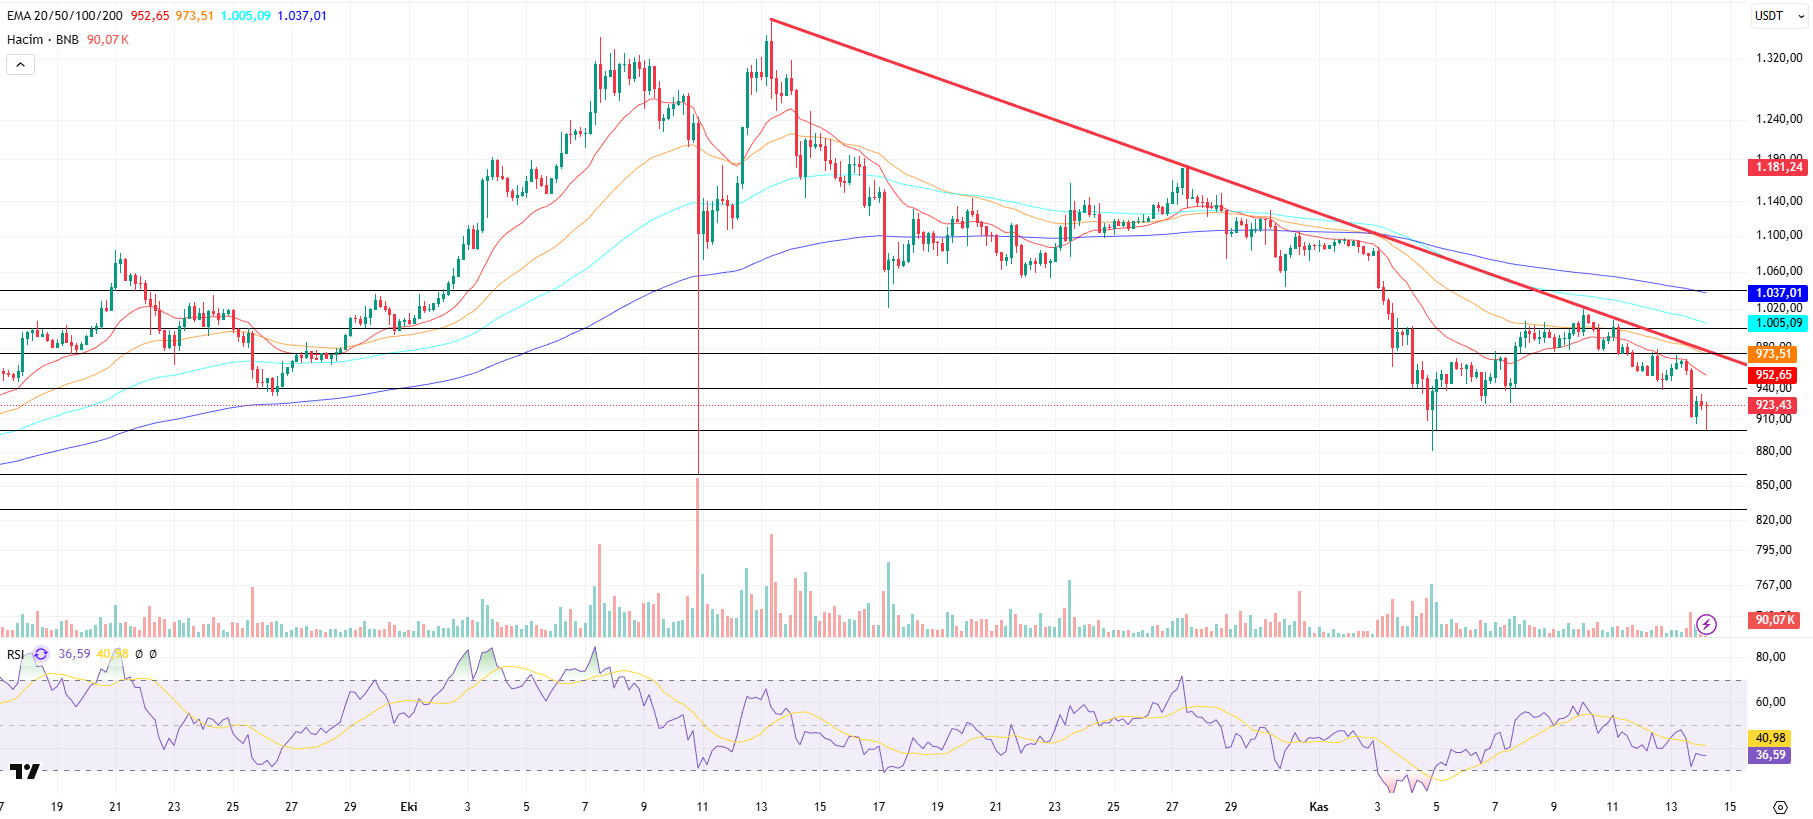
From a technical perspective, the pullback movement in the BNB/USDT pair, which continues within a downward trend, has persisted due to pressure encountered below the falling trend line, and the price has retreated to the $900 level.
Therefore, based on the current outlook, the BNB/USDT pair continues to trend downward due to selling pressure below the short-term downtrend line.
Technical indicators for BNB, currently trading in the $900–940 range, show that the low trading volume in recent periods has limited the positive outlook. Furthermore, it is observed that the current volume levels are not strong enough to break the downward trend. In addition, the Relative Strength Index (RSI) indicator has shown a renewed downward trend due to weak momentum.
Based on the current technical picture, if selling pressure increases, the price is expected to test the $900 support level. If this level is broken downward, the price may retreat to the $860 and $830 support zones, respectively.
On the other hand, if buying appetite is maintained and market momentum recovers, BNB is likely to retest the $940 resistance level in the first stage. If this level is exceeded, the price is expected to rise above the downtrend line. If the downward trend breaks upward and stability is achieved in this region, it is technically possible for the price to rise towards the $975 and $1,000 levels.
Supports: 900 – 860 – 830
Resistances: 940 – 975 – 1,000
LEGAL NOTICE
The investment information, comments, and recommendations contained herein do not constitute investment advice. Investment advisory services are provided individually by authorized institutions taking into account the risk and return preferences of individuals. The comments and recommendations contained herein are of a general nature. These recommendations may not be suitable for your financial situation and risk and return preferences. Therefore, making an investment decision based solely on the information contained herein may not produce results in line with your expectations.


