
Technical Analysis
BTC/USDT
Fed Board Member Michelle Bowman signaled a positive outlook for the integration of traditional finance and crypto, stating that large banks are not being prevented from entering the digital asset space with appropriate regulatory frameworks. On the corporate side, Sequans sold 970 BTC, covering half of its debt; BlackRock transferred $293 million worth of BTC and ETH to a centralized exchange. On the mining front, DMG Blockchain produced 23 BTC in October, increasing its total holdings to 359 BTC.
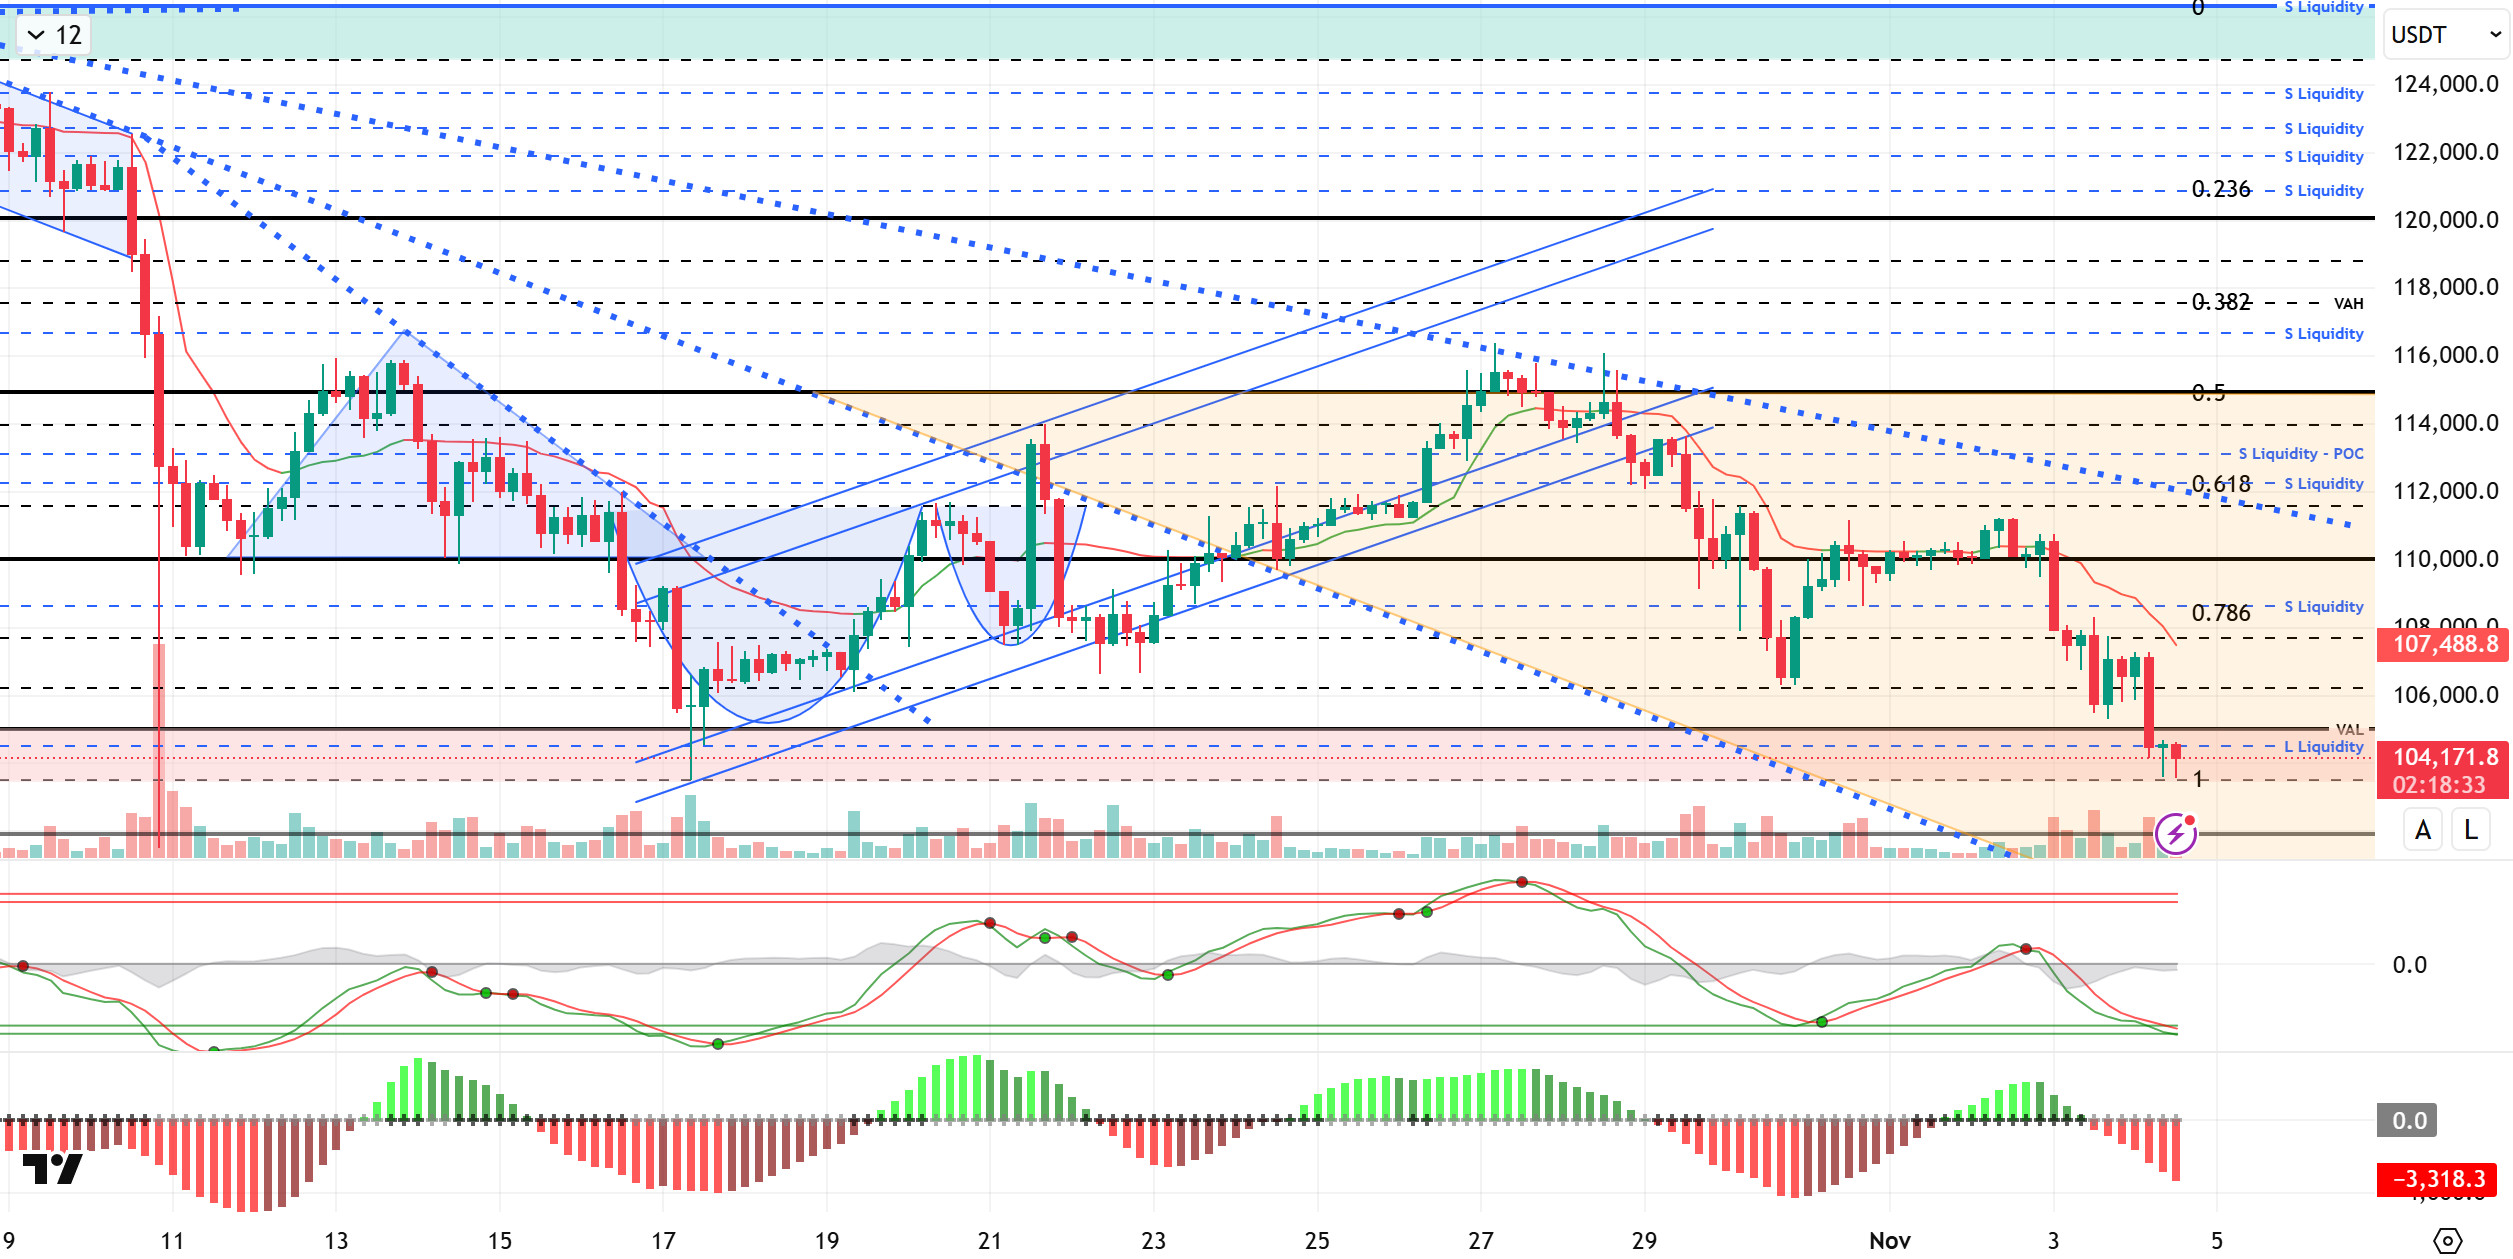
From a technical perspective, BTC failed to maintain its upward jump to the 108,300 level and fell back to the 104,200 level under heavy selling pressure. Continuing its movement within a downward trend structure, the price fell below the VAL level. Having managed to bounce back from the red band range it has tested many times before, this area could be critical for the price to hold at six-figure levels.
Technical indicators recorded a short-term rebound in the Wave Trend (WT) channel middle band but moved into oversold territory with the latest decline. The Squeeze Momentum (SM) indicator’s histogram moved back into negative territory after showing signs of a short-term rebound. The Kaufman moving average (KAMA) is currently at $107,400, positioned above the price.
According to liquidation data, transactions at the last level where the buy order was accumulated, 104,500, also resulted in liquidation. On the other hand, while there is intensity in the short term at the 108,500 level in the sell order, it has reached a serious intensity in the broader time frame at 112,000 – 113,000.
In summary, while the effects of the US-China tariff crisis being suspended for a year and resulting in a compromise continue, optimistic developments continue to emerge from both sides. However, the Fed’s hawkish tone on interest rate cuts continues to put pressure on the market, while the US government shutdown has reached an all-time high. On the technical side, although BTC has recorded short-term gains from time to time, it is seen that the rises parallel to the descending trend channel it has formed are not sustainable. Liquidity data also shows that the selling pressure continues to prevail. Moving forward, 103,300 will be monitored as a critical support level. A breach of this level could deepen selling pressure, potentially leading to a loss of six-figure levels. In the event of a potential rebound, we will monitor resistance levels at 106,600, 107,400, and 108,600, respectively.
Supports: 103,300 – 101,800 – 100,000
Resistances: 106,600 – 107,400 – 108,600
ETH/USDT
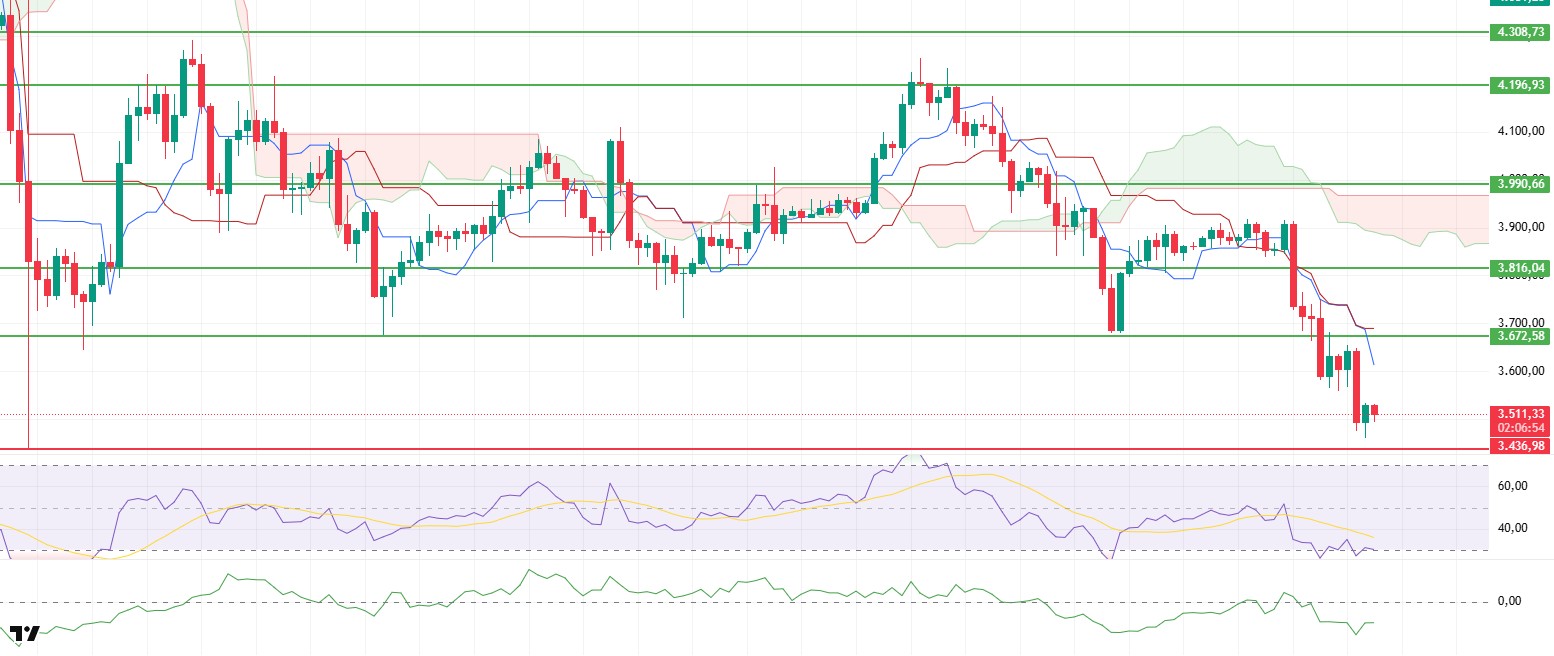
After falling to $3,460 during the day, the ETH price showed a short-term recovery due to buying pressure in this region and rose back above $3,500. This price movement indicates that selling pressure has eased for a while, but the overall market structure remains weak.
The Chaikin Money Flow (CMF) indicator continues to move in negative territory. However, the slight upward trend in the indicator signals that liquidity is starting to enter the market, albeit limited. Nevertheless, the CMF remaining in negative territory indicates that the market continues to be dominated by selling and that buyers remain weak.
The Relative Strength Index (RSI) indicator has rebounded slightly from the oversold zone. However, this recovery has not been enough to eliminate the weakness in momentum. The RSI’s current position indicates that selling pressure is still effective and that gains may remain limited for now.
In the Ichimoku indicator, the price is still moving below the kumo cloud and behind the Tenkan and Kijun levels. This technical structure confirms that the downtrend continues and that any potential recovery attempts may face resistance in the short term.
The overall outlook remains negative. If the price fails to sustainably regain the $3,672 level, the downward trend is expected to continue, and the $3,436 level may be retested. A break below this support could increase selling pressure, while a close above $,.672 could mark the beginning of a short-term rebound.
Supports: 3,436 – 3,227 – 3,020
Resistances: 3,672 – 3,816 – 3,990
XRP/USDT
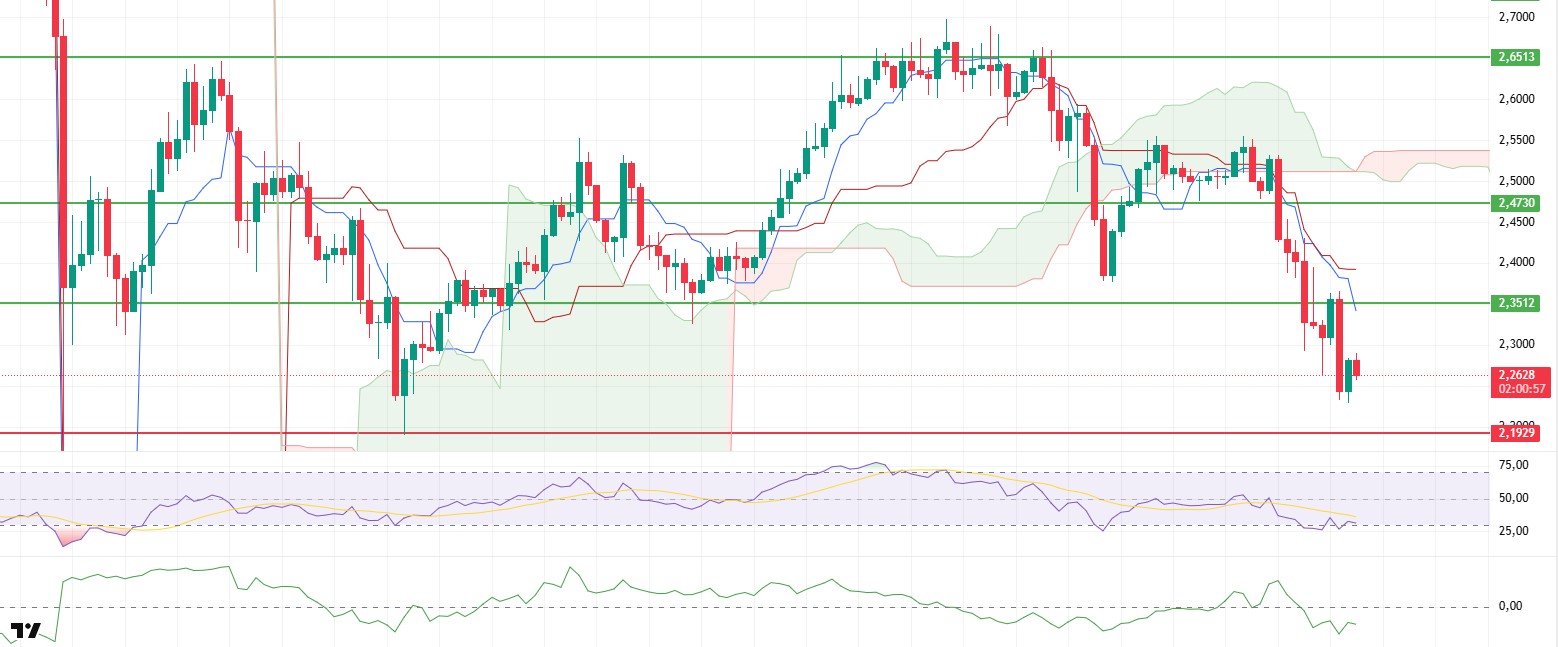
After falling to $2.23 during the day, the XRP price showed a slight rebound from this level and recovered to $2.27. This price movement indicates that selling pressure is still in effect, but limited rebound buying is coming from support levels in the short term.
The Chaikin Money Flow (CMF) indicator continues to move in negative territory. This outlook signals that strong liquidity outflows continue in the market and investor confidence remains weak. The CMF remaining at current levels signals that downward pressure on the price may continue in the short term.
Although the Relative Strength Index (RSI) indicator has emerged from the oversold zone, it maintains its weak outlook. The acceleration in momentum loss indicates that the selling trend remains strong. While the RSI at these levels technically allows for short-term rebound movements, the likelihood of these gains being sustained appears low due to weak momentum.
According to the Ichimoku indicator, the price is still moving below the kumo cloud and remains below the Tenkan and Kijun levels. This technical outlook indicates that the downtrend is still dominant and that any potential upward attempts may weaken at the cloud resistance.
The overall technical outlook remains weak. If the price fails to regain the $2.35 level, declines could extend to the $2.19 support. Breaking below this support could increase selling pressure, while a move above $2.35 could support a limited rebound in the short term.
Supports: 2.1929 – 2.0768 – 1.9092
Resistances: 2.3512 – 2.4730 – 2.6513
SOL/USDT
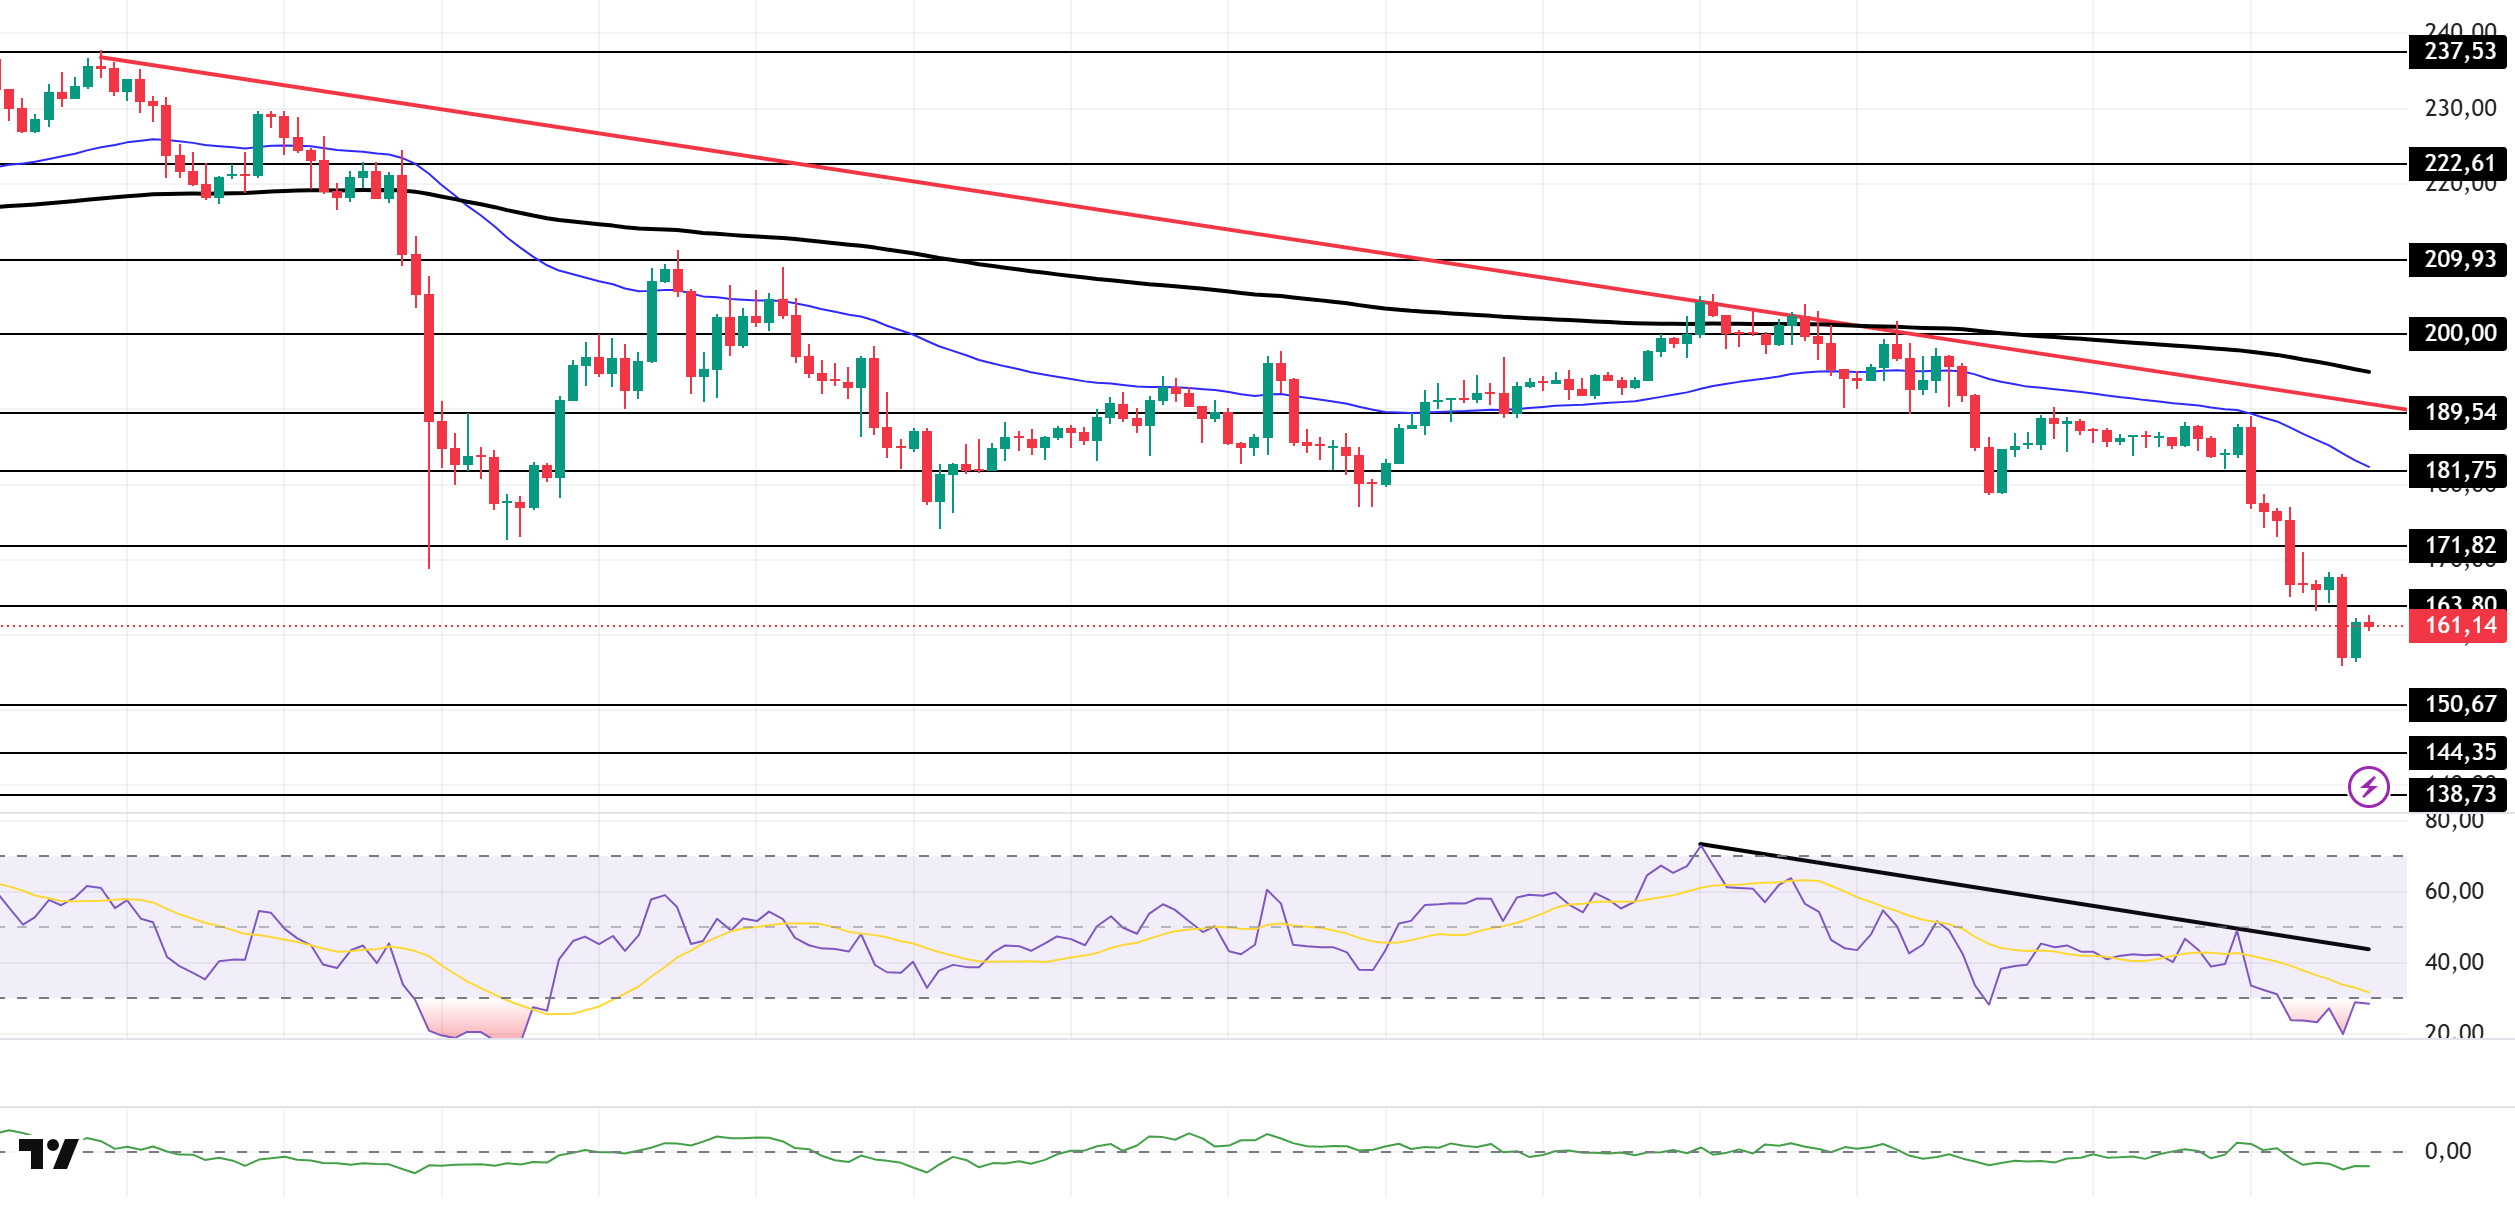
The SOL price showed a slight increase during the day. The asset tested the 50 EMA (Blue Line) moving average and the $189.54 level as resistance but failed to break through, continuing its pullback and remaining in the lower region of the downward trend that began on October 6. The price, which remains below the strong level of $163.80, could test the $150.67 level if the pullback continues. If the uptrend resumes, it could retest the $181.75 level.
On the 4-hour chart, it remained below the 50 EMA (Exponential Moving Average – Blue Line) and 200 EMA (Black Line). This indicates that it may be in a downtrend in the medium term. At the same time, the price being below both moving averages shows us that the asset is in a downward trend in the short term. The Chaikin Money Flow (CMF-20) is in the middle of the negative zone. However, an increase in money inflows could push the CMF into positive territory. The Relative Strength Index (RSI-14) remained in the oversold zone. It also continued to be in the lower region of the downward trend that began on October 27. In the event of an uptrend driven by macroeconomic data or positive news related to the Solana ecosystem, the $181.75 level stands out as a strong resistance point. If this level is broken upwards, the uptrend is expected to continue. In the event of pullbacks due to developments in the opposite direction or profit-taking, the $150.67 level could be tested. A decline to these support levels could increase buying momentum, presenting a potential opportunity for an uptrend.
Supports: 150.67 – 144.35 – 138.73
Resistances: 163.80 – 171.82 – 181.75
DOGE/USDT
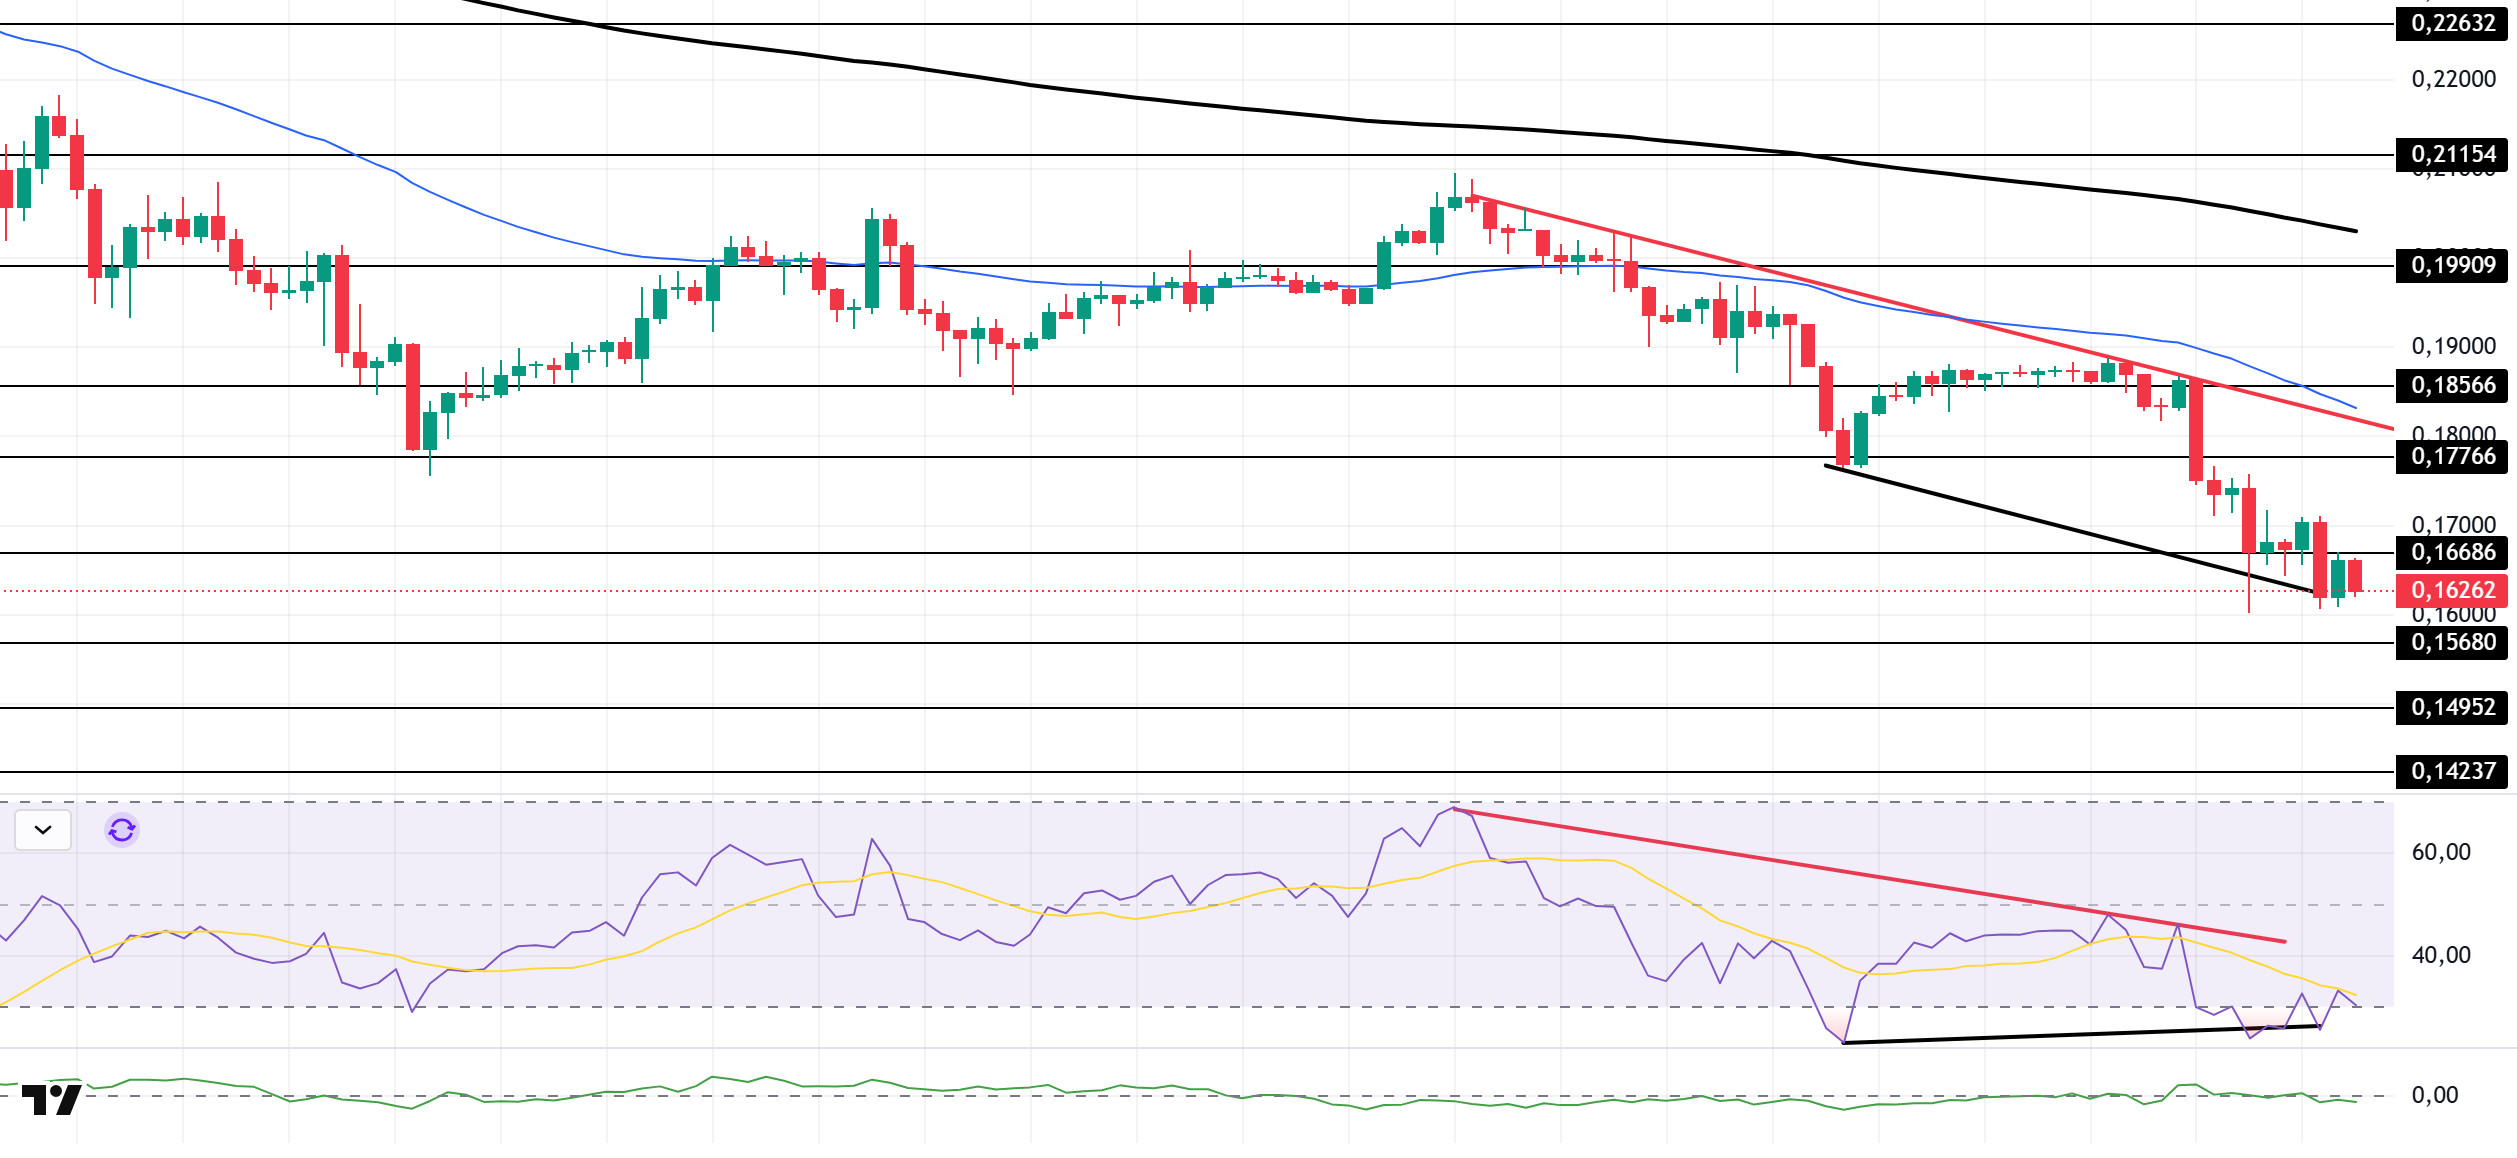
The DOGE price traded sideways during the day. The asset tested the downtrend that began on October 27 and the $0.18566 level as resistance and deepened its pullback. The price, which continues to be in the lower region of the downtrend, may test the $0.15680 level if it continues to pull back. If the uptrend begins, it may retest the downtrend line as resistance again.
On the 4-hour chart, the 50 EMA (Exponential Moving Average – Blue Line) remained below the 200 EMA (Black Line). This indicates that a medium-term downtrend may begin. The price being below both moving averages indicates a downward trend in the short term. The Chaikin Money Flow (CMF-20) has started to move into negative territory near the neutral zone. Additionally, a decrease in cash inflows could push the CMF deeper into negative territory. The Relative Strength Index (RSI-14) is in the oversold zone. It also remained below the downward trend line that began on October 27. On the other hand, there is a positive divergence. These factors could increase buying pressure. In the event of an uptrend driven by political developments, macroeconomic data, or positive news flow in the DOGE ecosystem, the $0.17766 level stands out as a strong resistance zone. Conversely, in the event of negative news flow, the $0.15680 level could be triggered. A decline to these levels could increase momentum and initiate a new wave of growth.
Supports 0.15680 – 0.14952 – 0.14237
Resistances 0.16686 – 0.17766 – 0.18566
BNB/USDT
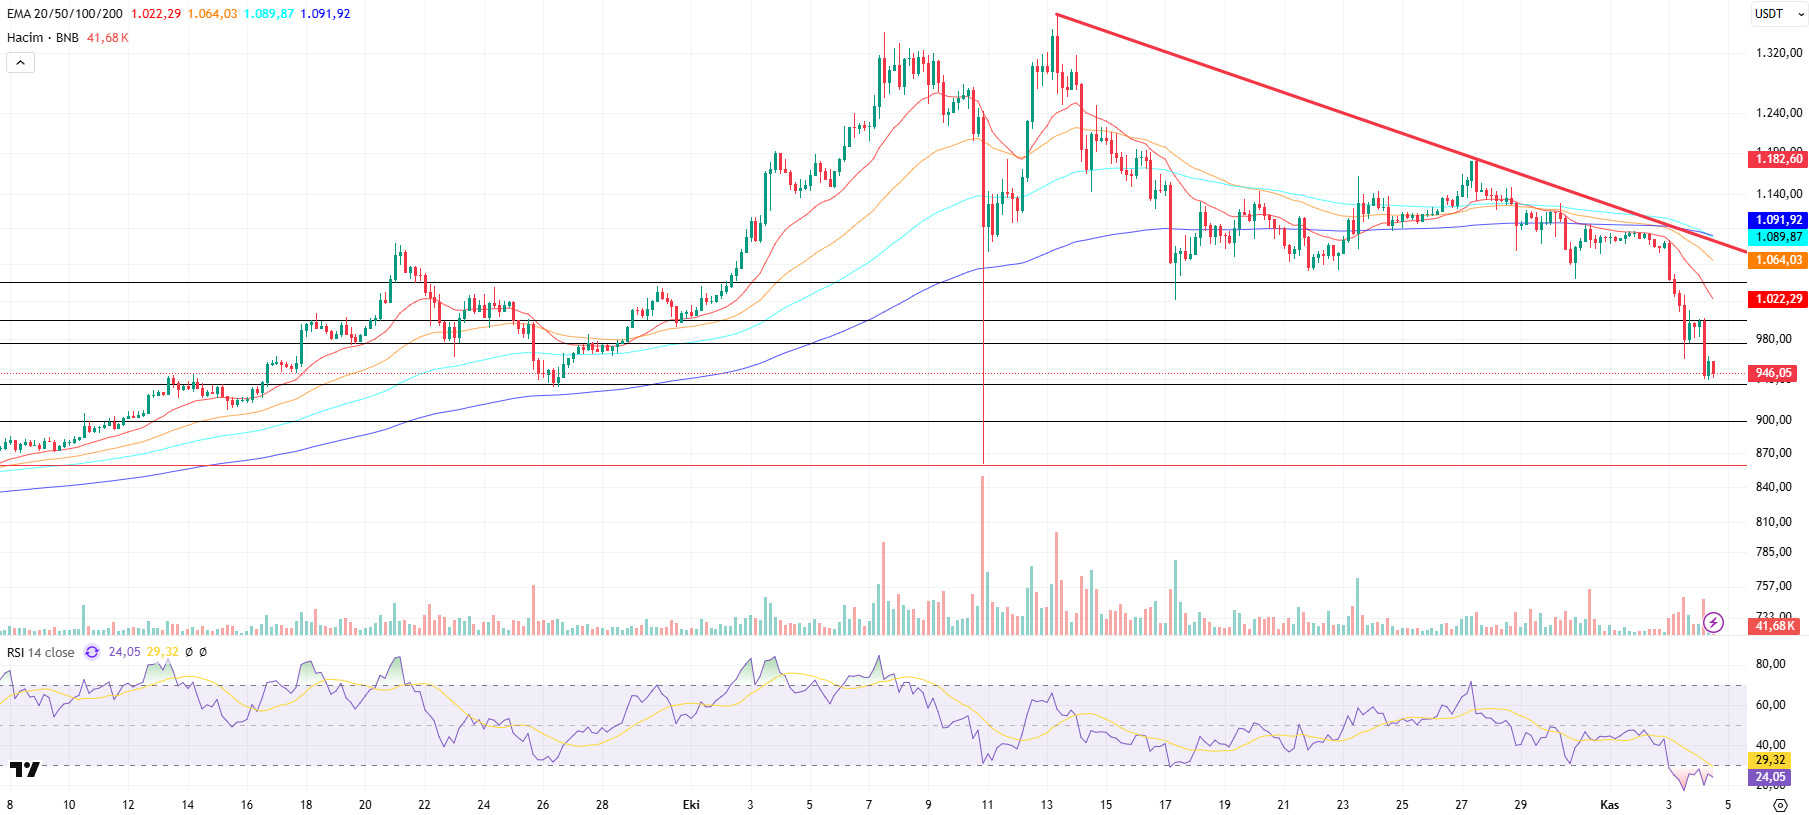
From a technical perspective, the correction that began after the all-time high (ATH) has regained momentum, resulting in a pullback to the $980 support zone identified in previous technical analyses. After seeking equilibrium at this level for a while, the asset increased its downward momentum with the formation of new candles and reversed its direction downward once again. Currently, the BNB/USDT pair has retreated to the second support level of $940 and has entered another decision phase in this region.
Technical indicators for BNB/USDT, currently trading in the $940–980 range, suggest that declining trading volume is supporting the downward momentum. Additionally, the Relative Strength Index (RSI) indicator has fallen below the 30 level due to increasing selling pressure. This indicates that the asset has entered the oversold zone and that the current technical outlook confirms this trend.
Based on the current technical picture, if selling pressure continues, the price is expected to retest the $940 support level. If this level is broken downwards, the price is likely to decline to the $900 and $860 support zones, respectively. On the other hand, if buying appetite is maintained and market momentum recovers, BNB is expected to retest the $980 resistance level in the first stage. If this level is broken, it is technically possible for the price to rise towards the $1,000 and $1,040 levels.
Supports: 940 – 900 – 860
Resistances: 980 – 1,000 – 1,040
ADA/USDT
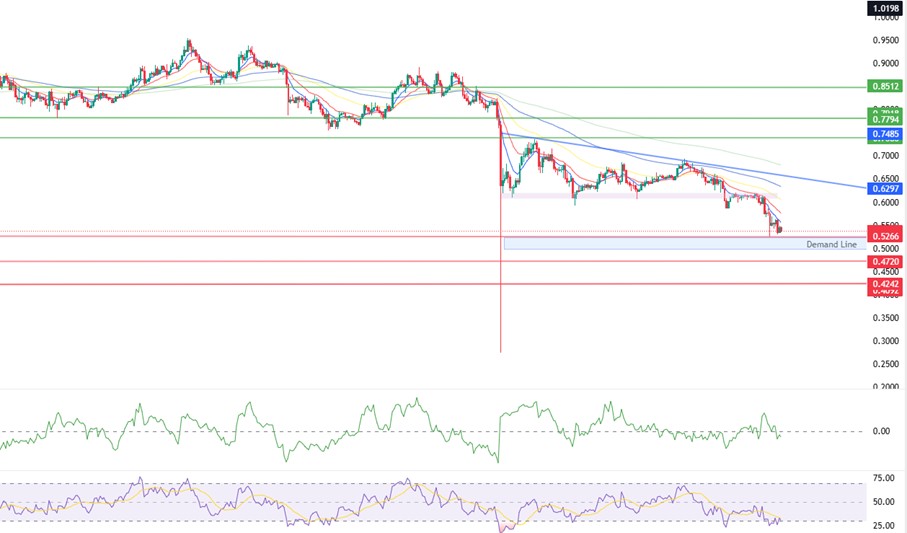
The ADA price fell to the $0.5380 level due to short liquidations in the second half of the day and price movements in major volatile coins in the market. As long as the price remains below the $0.5806 level, selling may continue towards the Demand Line region at the $0.5266 level.
While the price continues to move within the falling channel in the first retest zone (Pink Line), the Relative Strength Index (RSI-14) is expected to rise from the 40 level to the buy zone for the retest to be completed and the price to start moving in the trend direction again. The Chaikin Money Flow (CMF-20) shows divergence and is closer to the buy zone at the -0.06 level. Decreasing momentum and weak signals from the RSI indicator may keep the CMF in negative territory and continue selling pressure. In the event of an upturn due to macroeconomic data or positive news related to the Cardano ecosystem, the first resistance points we will follow can be tracked as a short-term uptrend level in the pullback area at the 0.6067 region. If it closes above this level, the $0.7163 level could be targeted. If pullbacks occur due to developments in the opposite direction or profit-taking, the $0.4720 level could be tested. A decline to these support levels could indicate an increase in selling momentum, signaling a potential downtrend. This week, the US ADP Nonfarm Employment Change data is expected to be released, along with the signing of the US-China tariff agreement. If the outcome of the agreement is positive, macroeconomic data or news related to the Cardano ecosystem could change the direction of ADA pricing.
Supports: 0.5266 – 0.4720 – 0.4242
Resistances: 0.7794 – 0.7163 – 0.6067
Legal Notice
The investment information, comments, and recommendations contained herein do not constitute investment advice. Investment advisory services are provided individually by authorized institutions taking into account the risk and return preferences of individuals. The comments and recommendations contained herein are of a general nature. These recommendations may not be suitable for your financial situation and risk and return preferences. Therefore, making an investment decision based solely on the information contained herein may not produce results in line with your expectations.


