
Technical Analysis
BTC/USDT
Throughout the day, the market experienced significant selling pressure due to the impact of macroeconomic data released from the US. In particular, jobless claims coming in below expectations and the Producer Price Index (PPI) data exceeding forecasts reinforced the perception that the US economy remains strong and inflationary pressures persist, significantly dampening investors’ risk appetite. U.S. Treasury Secretary Bessent reiterated that interest rates should be cut by 150–175 basis points, stating that a 50-basis-point cut in September is highly likely.
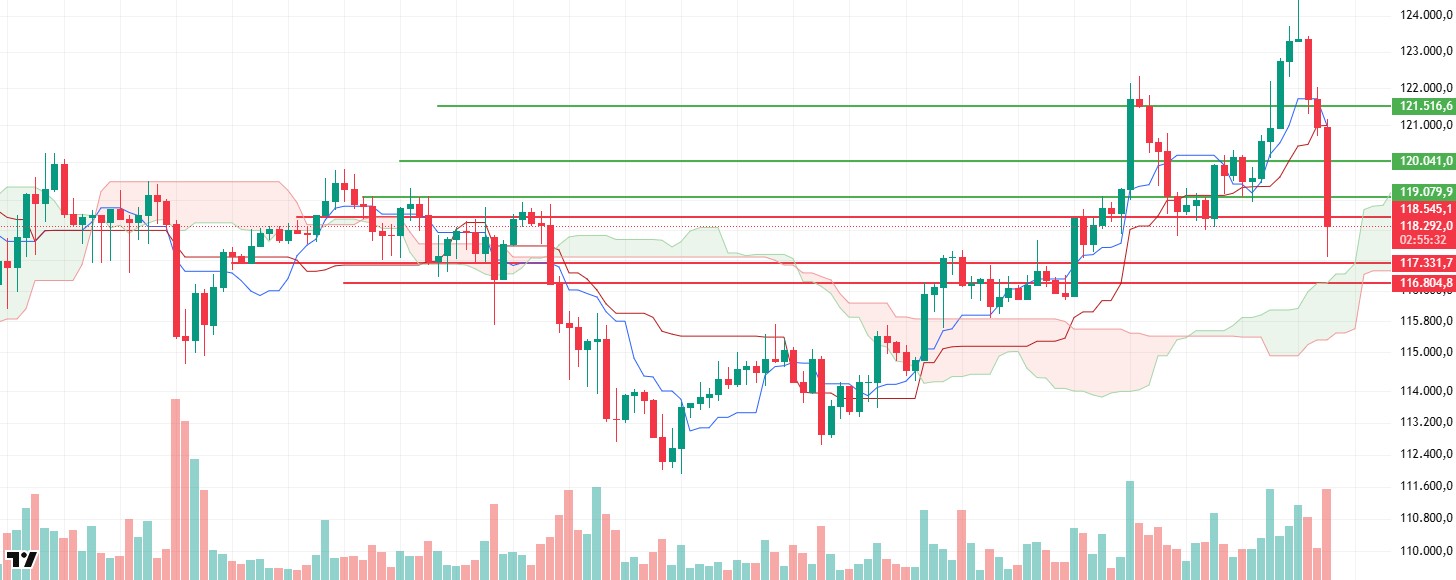
Looking at the technical picture, BTC fell sharply to $117,600 following the latest developments, compared to the previous analysis. It found support in this region and regained the $118,500 level. Technical indicators show that the Wave Trend oscillator (WT) is preparing for a trend reversal in the overbought zone, while the Squeeze Momentum (SM) indicator has regained momentum and the histogram continues to hold in the positive zone. The Kaufman moving average is currently acting as support at the 121,300 level below the price.
Looking at liquidity data, short positions are being liquidated at the 121,000 and 123,000 levels in the short term, while buy orders are continuing to show aggressive concentration at the 117,000 and 115,000 levels.
In summary, in the key developments section, calls for interest rate cuts continue alongside measures targeting tariffs. Whether Trump’s calls for a ceasefire with Putin will be heeded is the key development to watch from a market perspective. The technical structure points to a trend reversal at the saturation point, while liquidity data shows that 115,000 is still an important accumulation zone. After the price moved to the 124,000 band, selling pressure increased, supported by technical and liquidity factors. However, positive developments on the fundamental side continue to be a driving factor for upward attacks. In this context, the levels to watch for a continuation of upward momentum are 122,000 followed by 123,300, which could serve as key levels for regaining momentum and pushing the price above the ATH level. In case of a pullback, 121,300 acts as an intermediate support level, while a break below this level would bring 120,000 into focus as a new reference area.
Support levels: 118,500 – 117,300 – 116,800
Resistance levels: 119,000 – 120,000 – 121,500
ETH/USDT
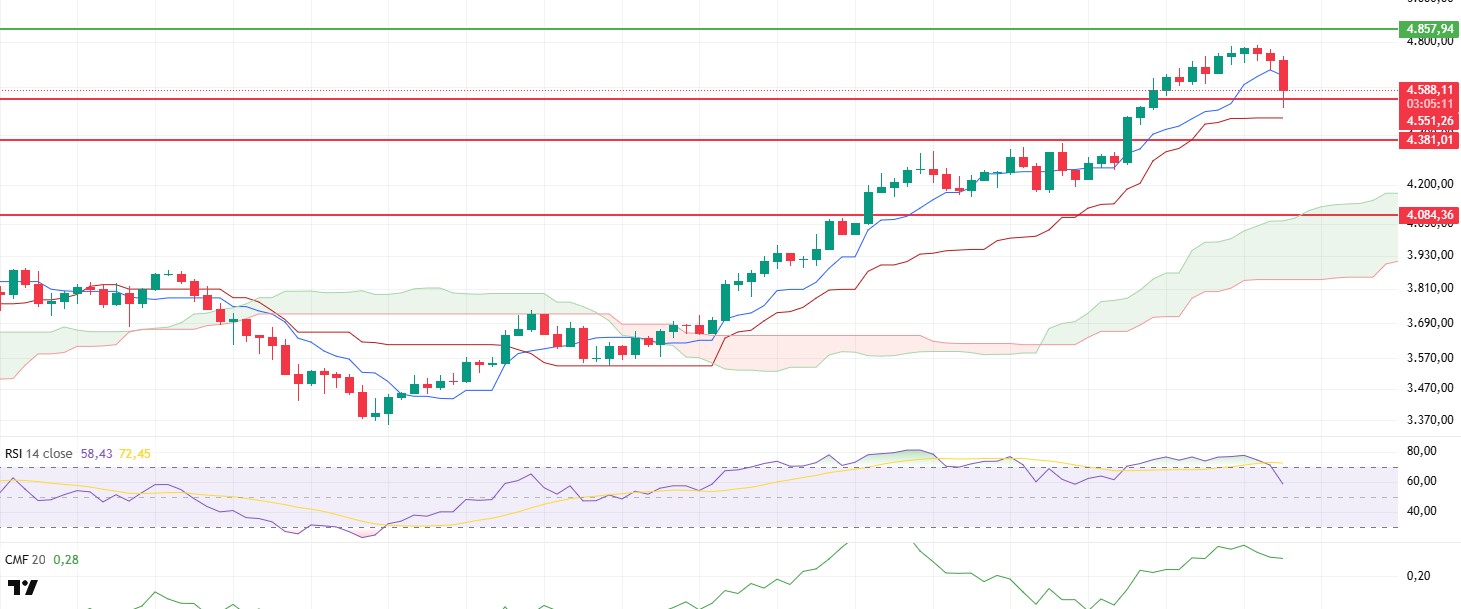
ETH experienced a sharp decline during the day under pressure from macroeconomic data released in the US. In particular, jobless claims came in below expectations, while Producer Price Index (PPI) data exceeded expectations, reinforcing the perception that the US economy remains strong and inflationary pressures persist, leading to a significant decline in risk appetite. In light of these developments, the ETH price faced intense selling pressure and dropped to the $4,500 level. At this level, buyers stepped in, allowing the price to attempt an intraday recovery and break above the $4,550 intermediate support level. However, the technical outlook and on-chain metrics suggest that this recovery could be fragile.
The approximately $2 billion decline in open interest data on the on-chain side indicates that high-volume long positions have been liquidated and that leverage positions have decreased significantly. This reveals that investors are increasingly risk-averse in the face of negative macroeconomic data, with market participants moving toward more cautious and lower-leverage positions. This development could also lead to reduced liquidity in futures markets and increased volatility in price movements.
On the technical side, as highlighted in the morning analysis, the Relative Strength Index (RSI) indicator has been moving sideways in the overbought zone for an extended period, clearly indicating that the expected correction risk has come into play. With selling pressure during the day, the RSI dropped sharply to the 58 level, signaling that the momentum loss is not only short-term but also a noteworthy weakening in terms of the medium-term trend.
The Chaikin Money Flow (CMF) indicator, meanwhile, has maintained its horizontal trend, suggesting that the price decline is primarily driven by the unwinding of leveraged long positions rather than heavy selling in the spot market.
When the Ichimoku indicator falls below the Tenkan level, it indicates that the negative outlook for the short-term trend is strengthening. The loss of the Tenkan line signals that the price has lost its short-term upward momentum and that the market is likely to test deeper support levels.
In particular, a downward break of the $4.551 level and 4-hour or daily closes below this level would technically increase the likelihood of testing the $4.381 support level. This level is of critical importance as it marks a key area where previous price reactions and short-term Fibonacci retracement levels converge. However, if the 4,551 dollar level holds and sustainability is maintained above it, a rebound in market sentiment could be observed.
Support levels: 4,550 – 4,381 – 4,084
Resistance levels: 4,857 – 5,000 – 5,350
XRP/USDT
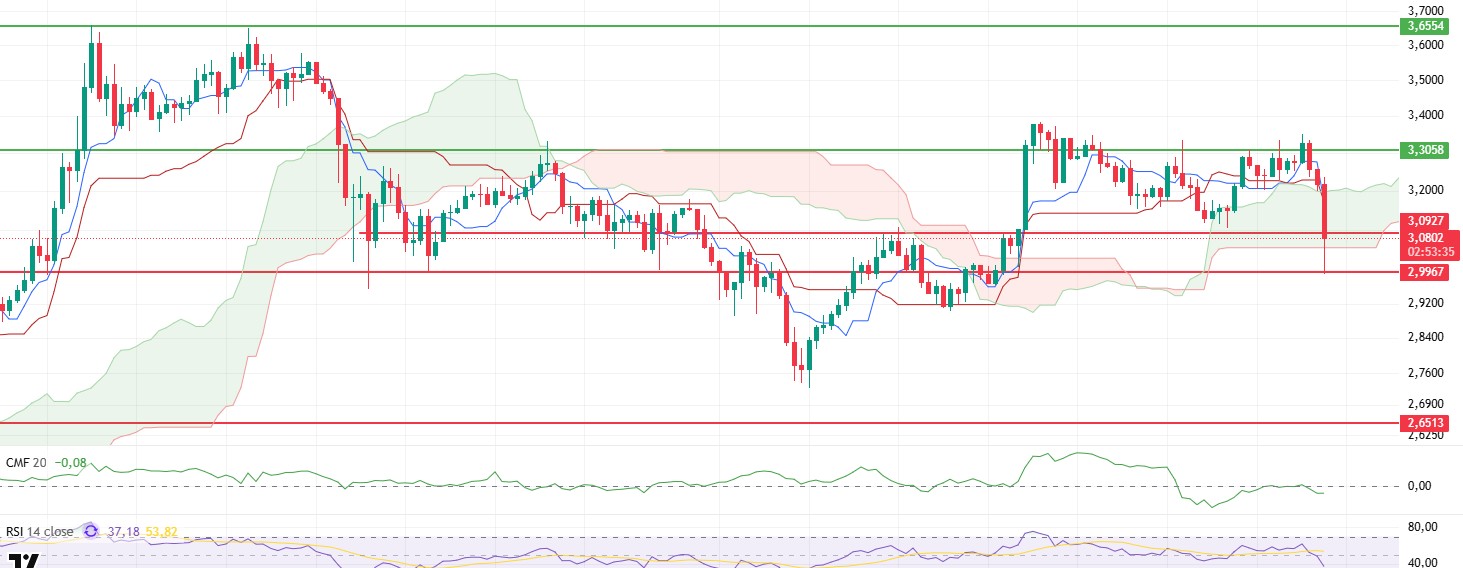
XRP faced heavy selling pressure due to the negative macroeconomic picture created by jobless claims from the US that fell short of market expectations and Producer Price Index (PPI) data that exceeded expectations. This wave of selling pushed the price back to the $2.99 support level, and weaknesses in technical indicators became more apparent.
In particular, the Chaikin Money Flow (CMF) indicator, despite showing a slight reaction to the decline, fell below the zero line, signaling the start of liquidity outflows in the market. The data reveals that selling pressure in spot markets remained relatively limited, but long positions in futures markets began to close, while short positions started to open. This suggests that the pressure on prices is primarily driven by leveraged trading and that traders are taking positions based on expectations of further declines.
On the technical side, the Ichimoku indicator shows that the price has lost both the tenkan and kijun levels and then retreated into the kumo cloud, confirming that the negative trend is strengthening in the short term. The return into the kumo cloud can be interpreted as a strong signal that the market has entered a directionless and indecisive structure, and that sales could accelerate if support levels are broken.
Considering the current technical and market dynamics, if the price breaks below the support levels of $3.09 and $2.99 in the evening, the likelihood of selling pressure deepening and more severe pullbacks occurring is high. However, if these levels hold, short-term rebound buying could come into play, allowing the price to recover to a limited extent. Nevertheless, the overall outlook still suggests that risks remain tilted more toward the downside scenario compared to the upside scenario.
Support levels: 3.0927 – 2.9967 – 2.7355
Resistance levels: 3.3058 – 3.6554 – 4.0055
SOL/USDT
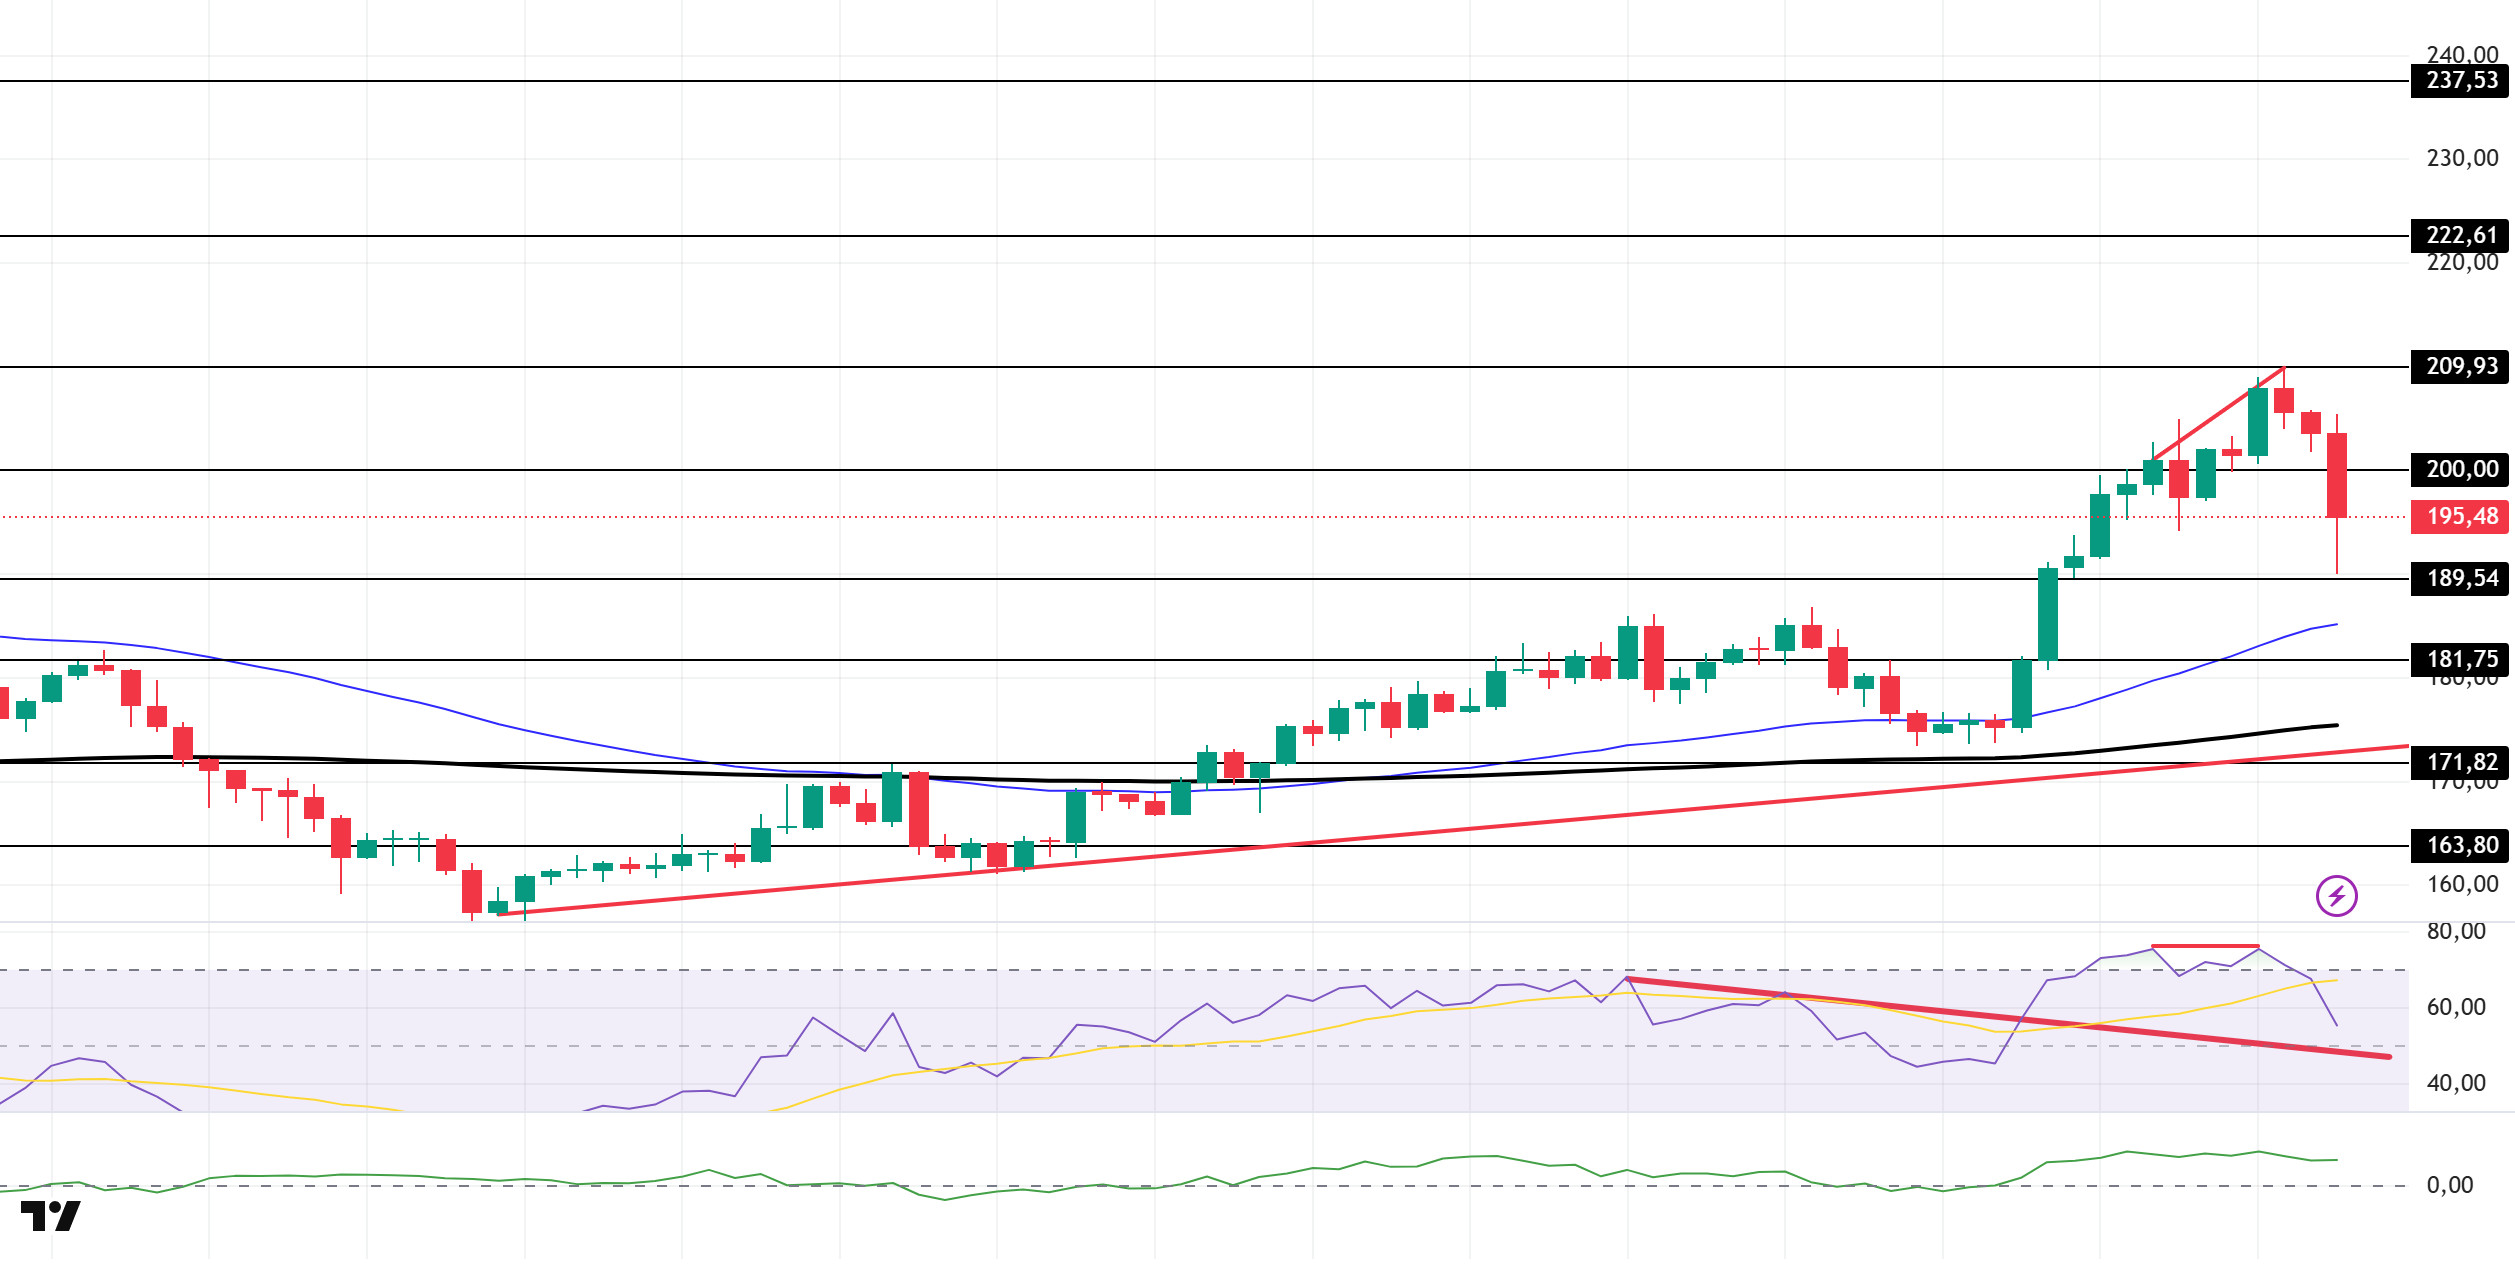
The SOL price experienced a slight pullback during the day. The asset remained above the upward trend line that began on August 2, while also managing to stay above the strong and psychological resistance level of $200.00. As of now, the price, which is experiencing a slight pullback, is testing the 200.00 dollar level. If the price closes below this level, the 189.54 dollar level should be monitored.
On the 4-hour chart, the 50 EMA (Blue Line) remains above the 200 EMA (Black Line). This indicates that the upward trend may continue in the medium term. Additionally, the price being above both moving averages suggests that the market is in an upward trend in the short term. Chaikin Money Flow (CMF-20) is in the upper levels of the positive zone. However, a decrease in money inflows could push CMF into the negative zone. The Relative Strength Index (RSI-14) continues to remain above the downward trend that began on August 10. This indicates that buying pressure is continuing. However, the indicator being in the overbought zone could lead to profit-taking. On the other hand, there is a bearish divergence. In the event of an upward movement due to positive macroeconomic data or news related to the Solana ecosystem, the $222.61 level emerges as a strong resistance point. If this level is broken upward, the upward trend is expected to continue. In the event of developments in the opposite direction or profit-taking, pullbacks may occur, testing the 200.00 dollar level. A decline to these support levels could see an increase in buying momentum, presenting a potential opportunity for an upward move.
Support levels: 200.00 – 189.54 – 181.75
Resistance levels: 209.93 – 222.61 – 237.53
DOGE/USDT
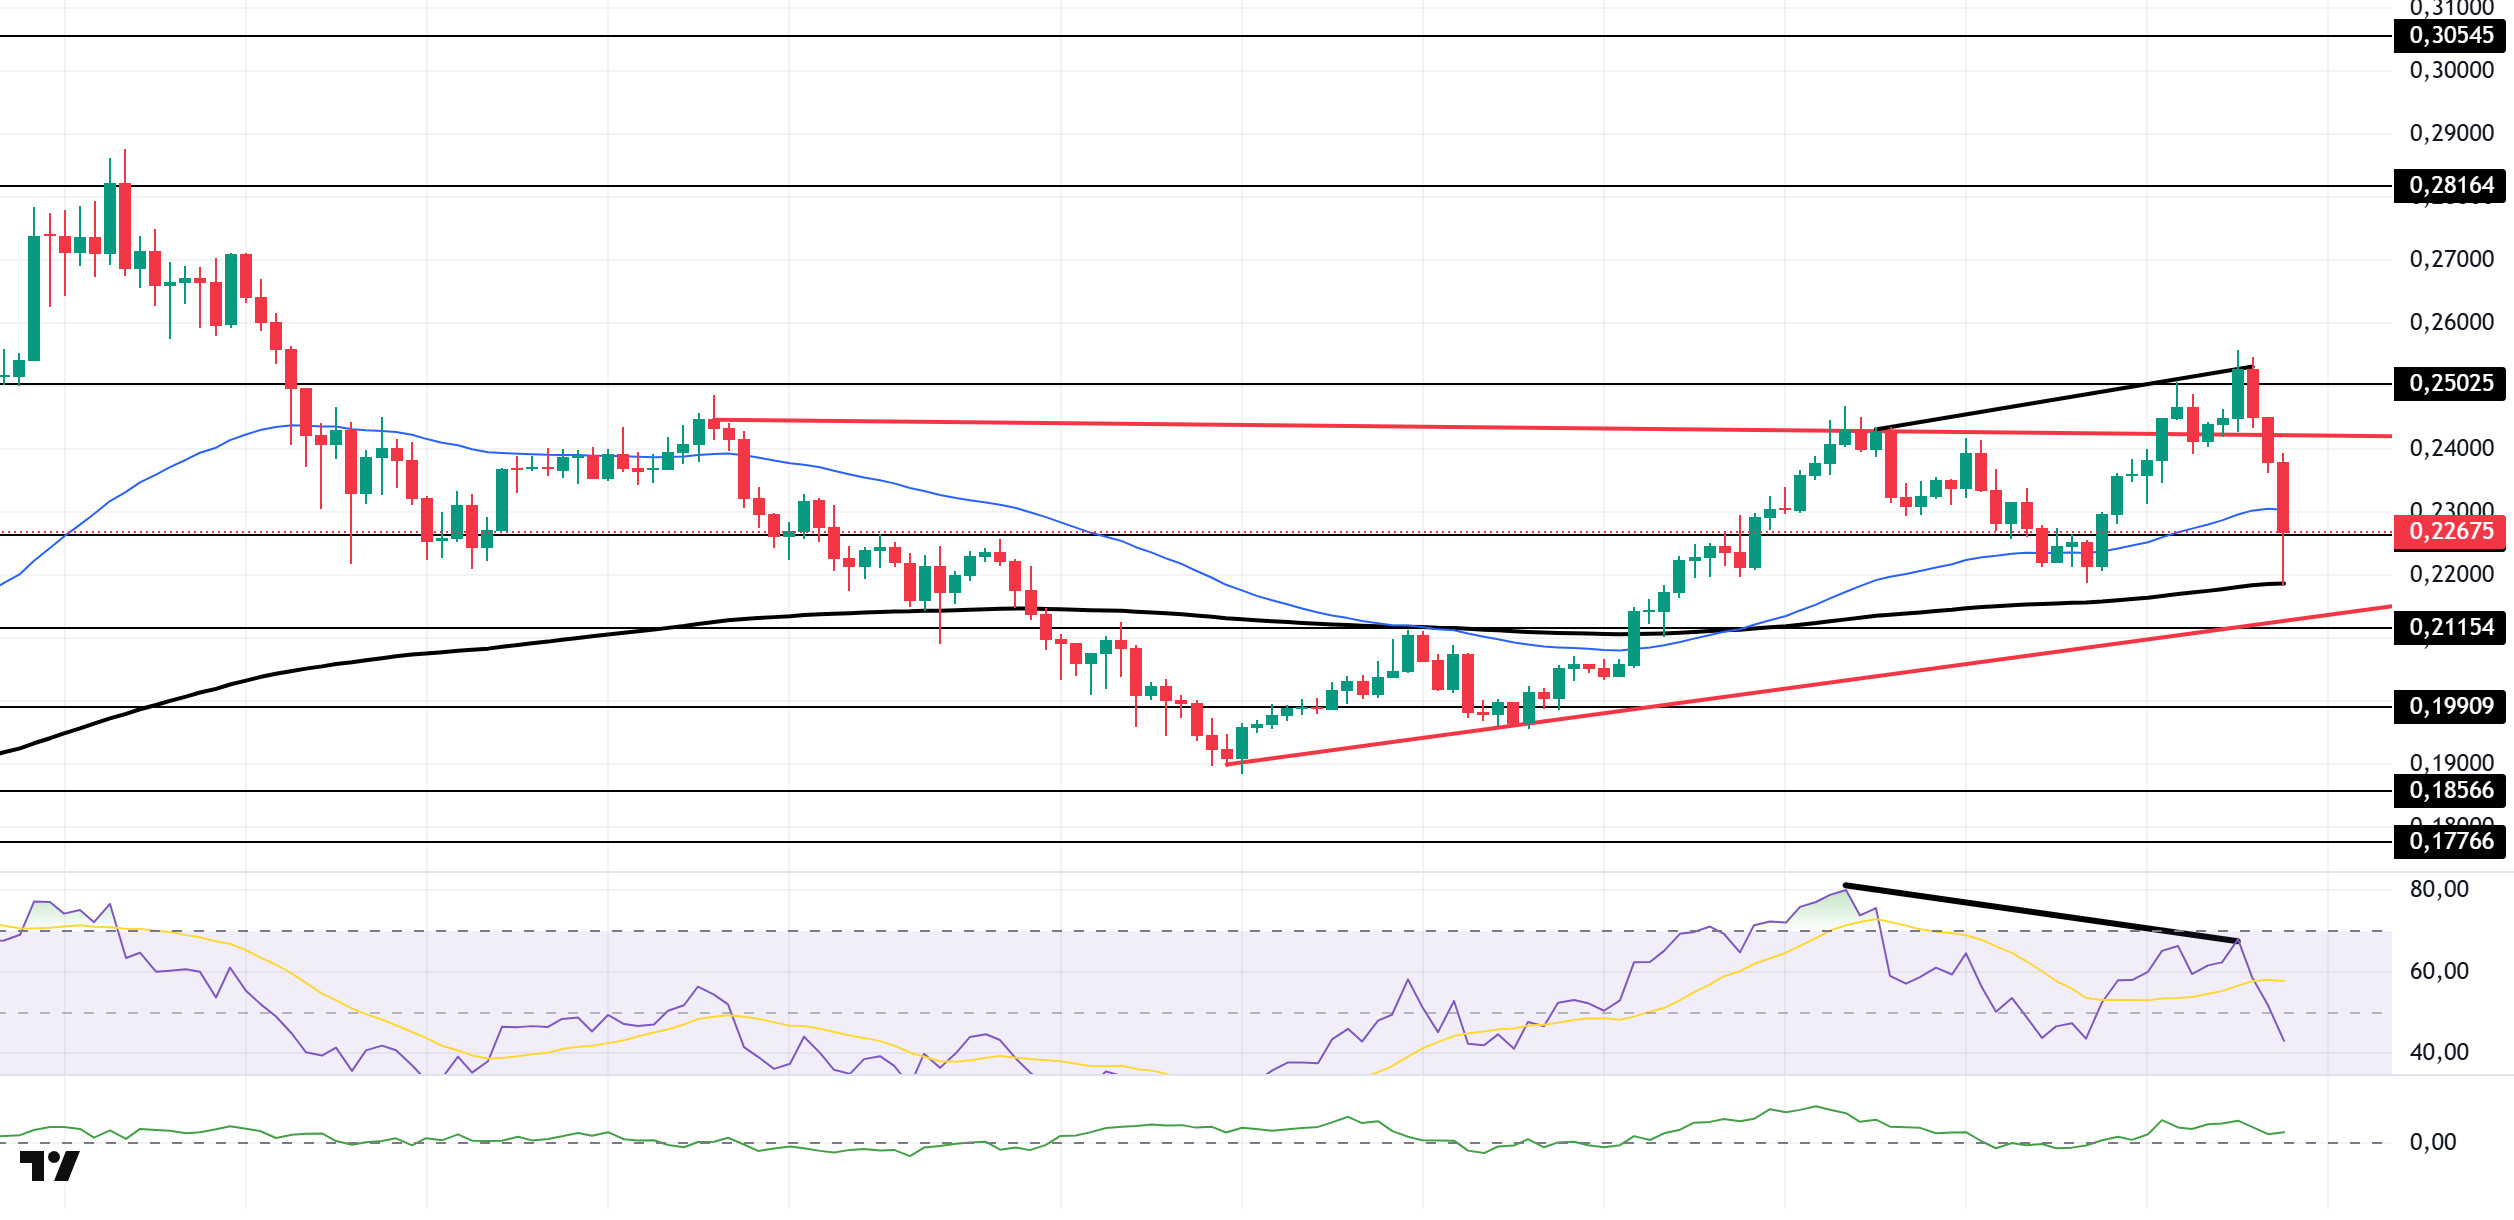
The DOGE price experienced a pullback during the day. The asset broke above the upper level of the symmetrical triangle formation that began on August 2 and has re-entered the symmetrical triangle formation. As of now, the price is testing the 200 EMA (Black Line) moving average as support. If it closes below this level, it could test the 0.21154 dollar level. In the event of an upward movement, the upper level of the symmetrical triangle formation and the 0.25025 dollar level should be monitored.
On the 4-hour chart, the 50 EMA (Blue Line) remains above the 200 EMA (Black Line). This indicates that the asset is in an upward trend in the medium term. The price being above both moving averages also indicates that the asset is in an upward phase in the short term. The Chaikin Money Flow (CMF-20) continues to accelerate in the positive zone. Additionally, negative cash inflows could push the CMF into the negative zone. The Relative Strength Index (RSI-14) has fallen to a neutral level. At the same time, a negative divergence could continue the downward trend. In the event of an upward movement driven by political developments, macroeconomic data, or positive news flow within the DOGE ecosystem, the $0.25025 level emerges as a strong resistance zone. In the opposite scenario or in the event of negative news flow, the 0.22632 dollar level could be triggered. A decline to these levels could increase momentum and potentially initiate a new upward wave.
Support levels: 0.22632 – 0.21154 – 0.19909
Resistances: 0.25025 – 0.28164 – 0.30545
SHIB/USDT
Two important headlines emerged in the Shiba Inu ecosystem today. The SHIB burn rate increased by 48.244% in the last 24 hours, with approximately 85.7 million SHIB removed from circulation. There was also a noticeable increase in whale activity, with transfers from large addresses 40% higher than the previous day. These developments can be seen as supportive for short-term supply dynamics and community confidence.
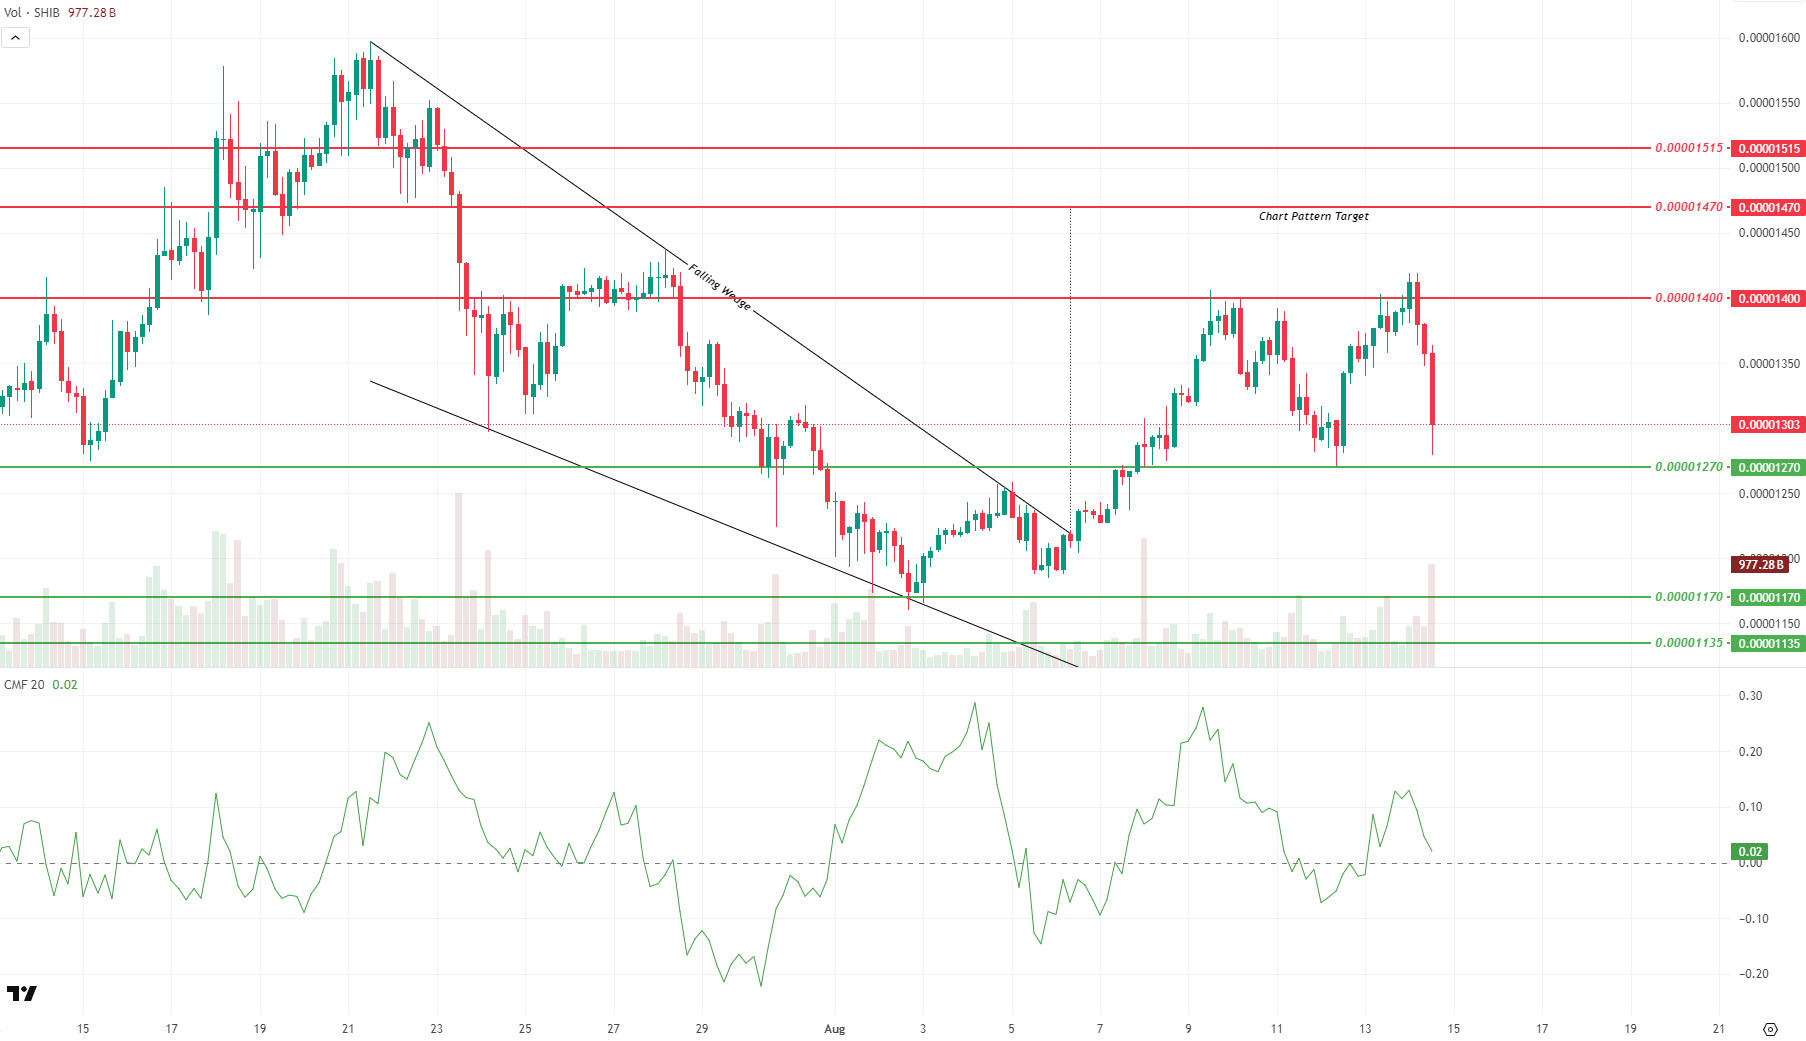
On the technical front, the price failed to hold above the $0.00001400 resistance level and retreated to $0.00001303 amid selling pressure. The pullback aligns with the scenario we outlined in the morning report, which stated that “if there is no volume-supported breakout, the price could retreat to the intermediate support level of 0.00001350 dollars and the 0.00001320–0.00001270 dollar range.” The significant increase in trading volume indicates that selling pressure is intensifying in this area. The first important support level is currently at 0.00001270 dollars, and this area should be monitored as a zone where buyers could regain strength. Closures below 0.00001270 dollars could bring 0.00001170 dollars and 0.00001135 dollars into focus. In the event of an upward recovery, the 0.00001350 dollar level acts as an intermediate resistance, while the 0.00001400 dollar level remains a critical threshold.
The Chaikin Money Flow (CMF) indicator is at 0.02 in positive territory but has weakened compared to this morning. This indicates that buyers are still present in the market but capital inflows have slowed down. The Falling Wedge formation that has been in place since July 21 remains valid in the medium term, but strong volume support and sustained trading above the 0.00001400 dollar level are required to reach the formation’s target of 0.00001470 dollars.
Support levels: 0.00001270 – 0.00001170 – 0.00001135
Resistances: 0.00001400 – 0.00001470 – 0.00001515
LINK/USDT
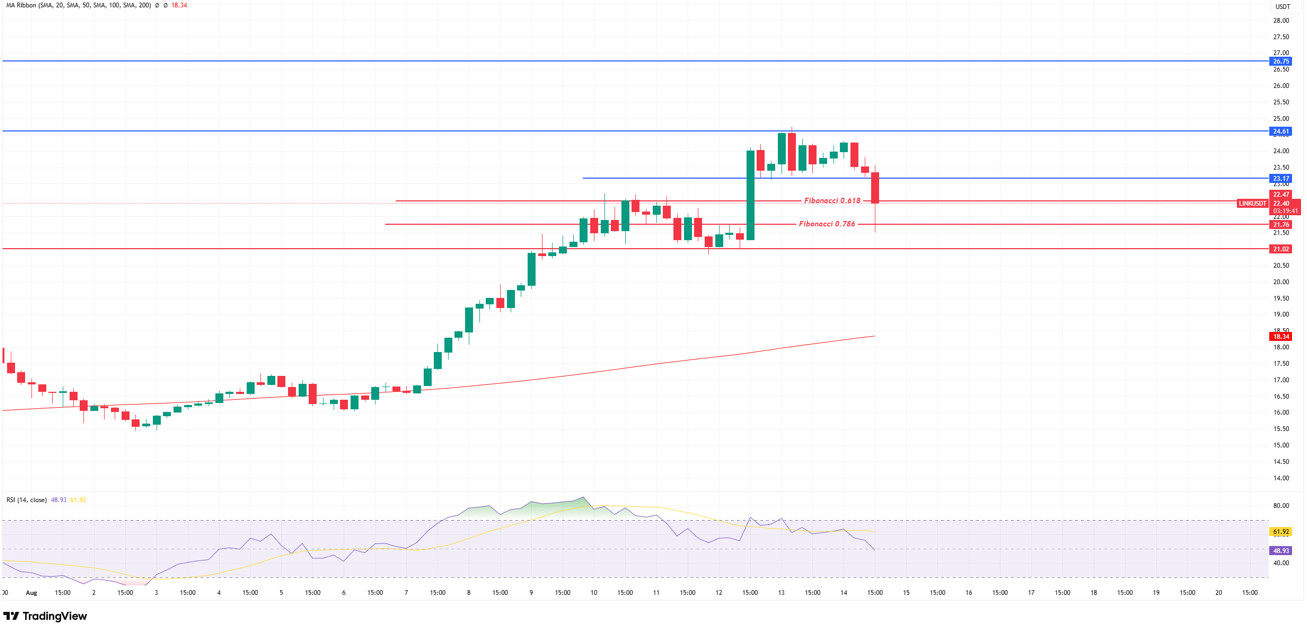
LINK fell below the support level at 23 during the day, retreating to the area where the uptrend began, and is currently seeking equilibrium at the 22 dollar level, which is the Fibonacci 0.618-0.786 correction zone of the movement that began on August 13. This level is a critical threshold where a healthy trend-internal correction could complete and buying interest could re-emerge in the short term. If the price manages to hold above the 22 dollar level, it could first target the 23.17 dollar level, followed by a retest of the strong resistance at 24.61 dollars. A sustained break above 24.61 would bring the 29.75 band, the target zone of the cup-and-handle formation, back into focus.
On the other hand, if there are closes below the 22.46 level, the correction is likely to deepen, first to the Fibonacci 0.786 correction at 21.76, and finally to the main support point at 21.02. It can be said that the daily structure will break down below 21.02, and the trend will shift to a downward appearance.
On the momentum front, the Relative Strength Index (RSI) indicator has retreated to the 48–49 levels, signaling a weakening of momentum in the short term, but the fact that it has not entered the oversold zone indicates that the price retains the potential for a rebound. A rebound of the RSI back into the 50–55 range and the price maintaining stability above 23.70 will be critical for the upward movement to gain strength.
Support levels: 22.47 – 21.76 – 21.02
Resistance levels: 23.17 – 26.61 – 26.75
Legal Notice
The investment information, comments, and recommendations contained herein do not constitute investment advice. Investment advisory services are provided individually by authorized institutions taking into account the risk and return preferences of individuals. The comments and recommendations contained herein are of a general nature. These recommendations may not be suitable for your financial situation and risk and return preferences. Therefore, making an investment decision based solely on the information contained herein may not produce results in line with your expectations.

