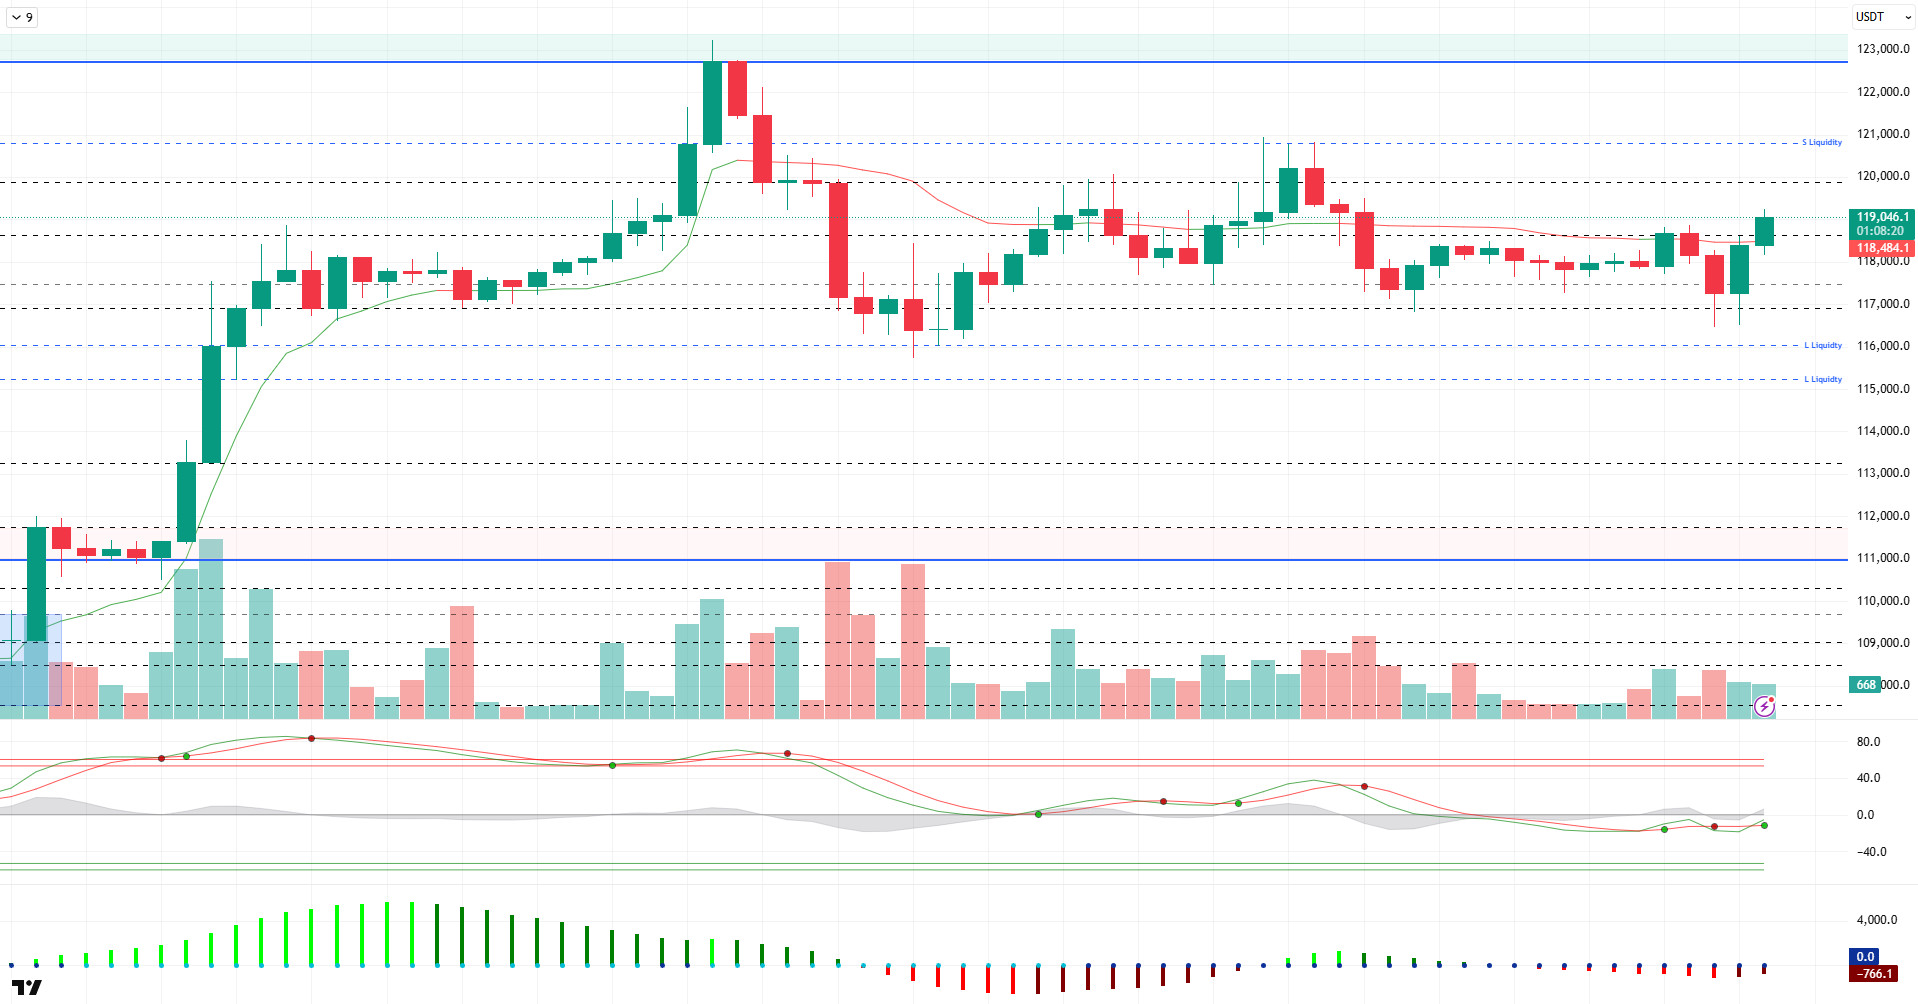
BTC/USDT
As the US entered an eventful week in terms of the cryptocurrency ecosystem and trade policies, August 1 was set as the deadline for the Trump administration to implement new tariffs. The Ministers of Commerce and Treasury brought critical topics such as high interest rates and the dollar’s transition to blockchain-based systems to the agenda. On the other hand, while the banking lobby opposed crypto companies’ requests for bank licenses, institutional Bitcoin purchases continued unabated, led by European-based companies.
Looking at the technical outlook, BTC price continues to consolidate horizontally near the ATH level. BTC, which has been moving in the 116,000 – 119,000 band for a while, is rebalancing within this range, although it occasionally sags outside these levels. At the time of writing, BTC, which is attempting an upward attack, is trading at 119,200.
Looking at the technical indicators, the Wave Trend (WT) oscillator turned upwards and headed towards the overbought zone after an indecisive display in the channel mid-band with the recent decline. The histogram on the Squeeze momentum (SM) indicator regained momentum but is still in negative territory. The Kaufman moving average crossed below the price at 118,500, supporting the short-term bullishness.
Liquidity data reveals that the heavy buying positions at 117,000 were liquidated after the recent decline, while the selling side was liquidated at 119,000. While the sparseness of short-term trades is noteworthy, it is noteworthy that long-term trades are maintained around 121,000 in the direction of selling.
In summary, the price continues to consolidate near the ATH level as fundamental developments continue to contribute positively to pricing. While the technical outlook supports this positive scenario in the short term, liquidity data has turned the direction of selling positions. Closures above the 120,000 minor resistance point will be followed in the continuation of the rise, while we will follow the 118,600 support level in a possible selling pressure.
Supports 118,600 – 117,500 – 116,800
Resistances 120,000 – 121,000 – 123,000
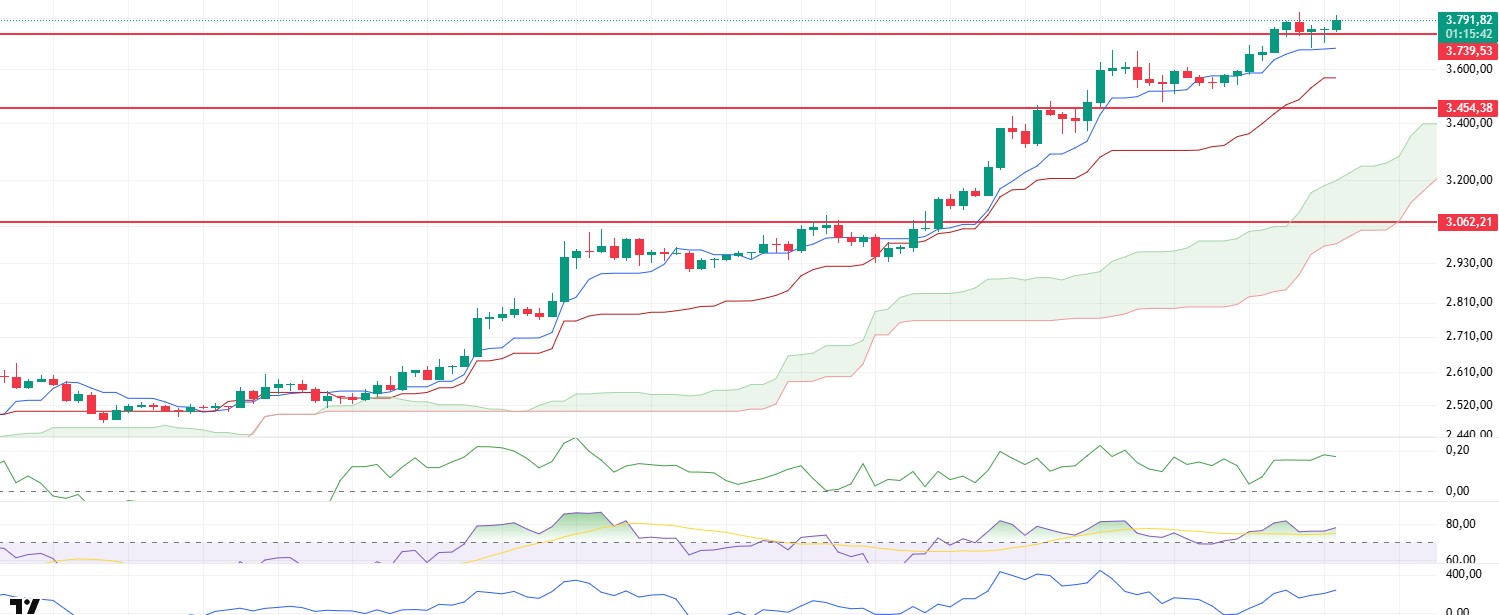
ETH/USDT
ETH price rebounded strongly over the weekend after falling as low as $3,480 during Friday evening’s pullback. During this recovery, the important resistance zone at $3,739 was first overcome, and then the price moved above the $3,800 level with the effect of upward momentum.
Technical indicators and on-chain data reveal the key factors supporting this rise. In particular, the increase in open interest to $26.73 billion indicates that open positions in the market are increasing and participants are increasing their positions in ETH. This rise is not only on a price basis, but also in the futures markets. At the same time, Cumulative Volume Delta (CVD) data shows a clear upward momentum on the futures side. This suggests that buyers are aggressively positioned and are using strong volume to push the price higher. The CVD on the spot side, on the other hand, is more balanced, which is another sign that the market is rising steadily without overdoing it.
The Chaikin Money Flow (CMF) indicator remains in positive territory and also maintains its upward trend. This suggests that liquidity inflows to the market continue to increase and the price may continue its upward movement with this support. This behavior of CMF confirms that the market remains strong in terms of both volume and momentum.
The Relative Strength Index (RSI) indicator remains in overbought territory. Although the tanlo on the RSI reveals that the buying appetite is still high and the price has the ground to support upward movements, at the same time, it should not be ignored that the risk of a short-term correction is still alive due to the overbought situation in this region. At this point, extreme values on the RSI may suggest caution, especially for short-term investors.
The Ichimoku indicator shows that the price is positioned above both the tenkan and kijun levels and completely outside the kumo cloud. While this structure gives a strong signal that the positive trend continues in the short and medium term, it also supports that the market is in a technically healthy upward process.
In light of all this data, it seems likely that the ETH price will continue its upward movement if it maintains above the $3,800 level. In this scenario, buyers can be expected to maintain momentum and move the price to higher levels. On the other hand, the $3,739 level should be followed as intermediate support. Below this, the tenkan line at the level of $3,680 stands out as an important support point. If these two levels are breached to the downside, the possibility of the market entering a short-term correction may increase.
Top of Form
Below the Form
Supports 3,739 – 3,455 – 3,062
Resistances 4,084 – 4,381 – 4,857
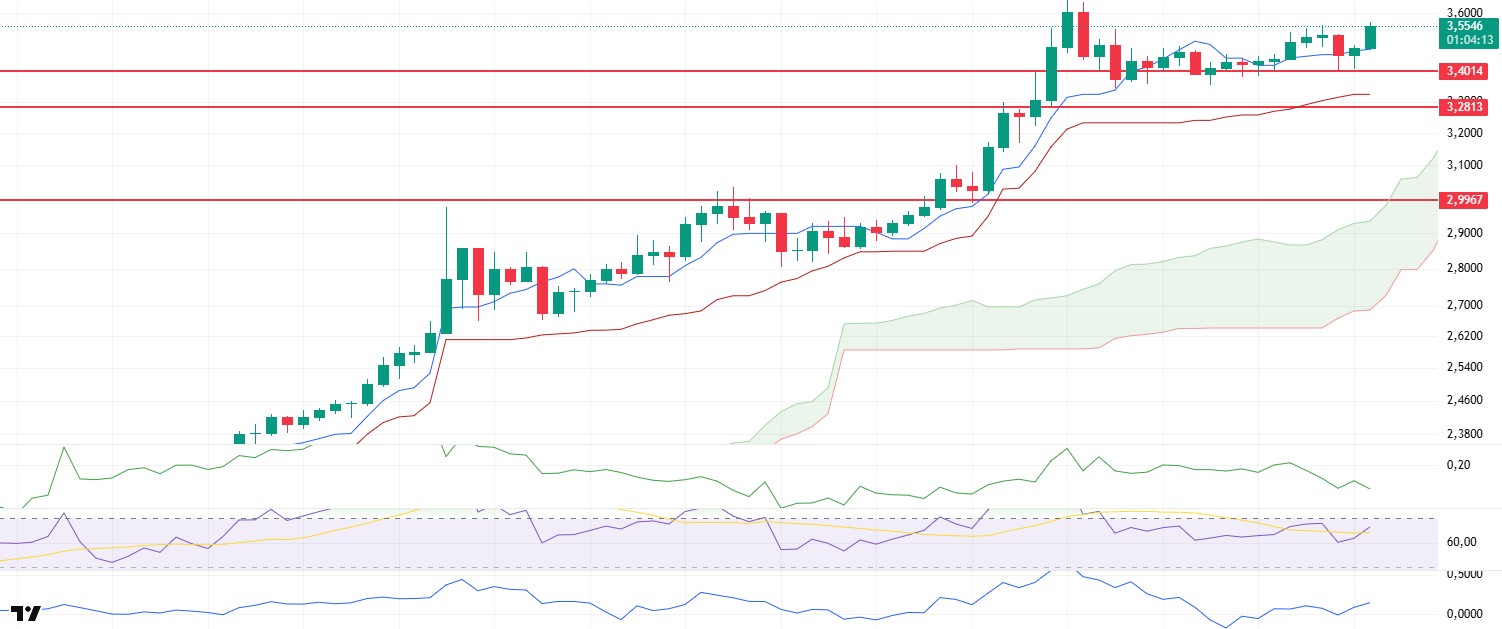
XRP/USDT
XRP has retreated to the $3.40 band after hitting a new all-time high of $3.66 recently. This is an area where the price tends to consolidate, as highlighted in previous analysis, and this sideways movement was seen to continue over the weekend as trading volumes remained relatively low. With the recovery after the weekly close, XRP managed to rise above the $3.50 level again and started to generate positive signals in the short term by holding above this level.
Technical indicators provide important clues about the dynamics of this recovery. The Chaikin Money Flow (CMF) indicator is notable for not moving in line with the recent rally. The decline in the CMF value indicates that the upward movement of the price is not accompanied by a meaningful liquidity inflow into the market. This indicates that especially spot investors are cautious at current levels and that there is not yet a strong appetite for buying. Therefore, this data stands out as a factor that should be carefully monitored in terms of the sustainability of the rise.
On the other hand, Relative Strength Index (RSI) and momentum indicators present a more positive picture with their positive structures accompanying the price action. The fact that both indicators regained upward momentum and did not exhibit any negative divergence supports that the price continues to rise on a technically healthy ground. The structure observed in these indicators indicates that despite short-term corrections, buyers remain in control and the market maintains its upward trend.
In this context, if XRP continues to hold above the $3.50 level, the upward movement can be expected to continue gradually. Persistence above this level will increase market confidence in both psychological and technical terms. However, in a possible pullback, the $3.40 level stands out as the first strong support. If this level is broken downwards, market dynamics may become weaker and there may be a risk that the price may retreat to $3.28.
Supports 3.4014 – 3.2813 – 2.9967
Resistances 3.8615 – 4.000 – 4.4000
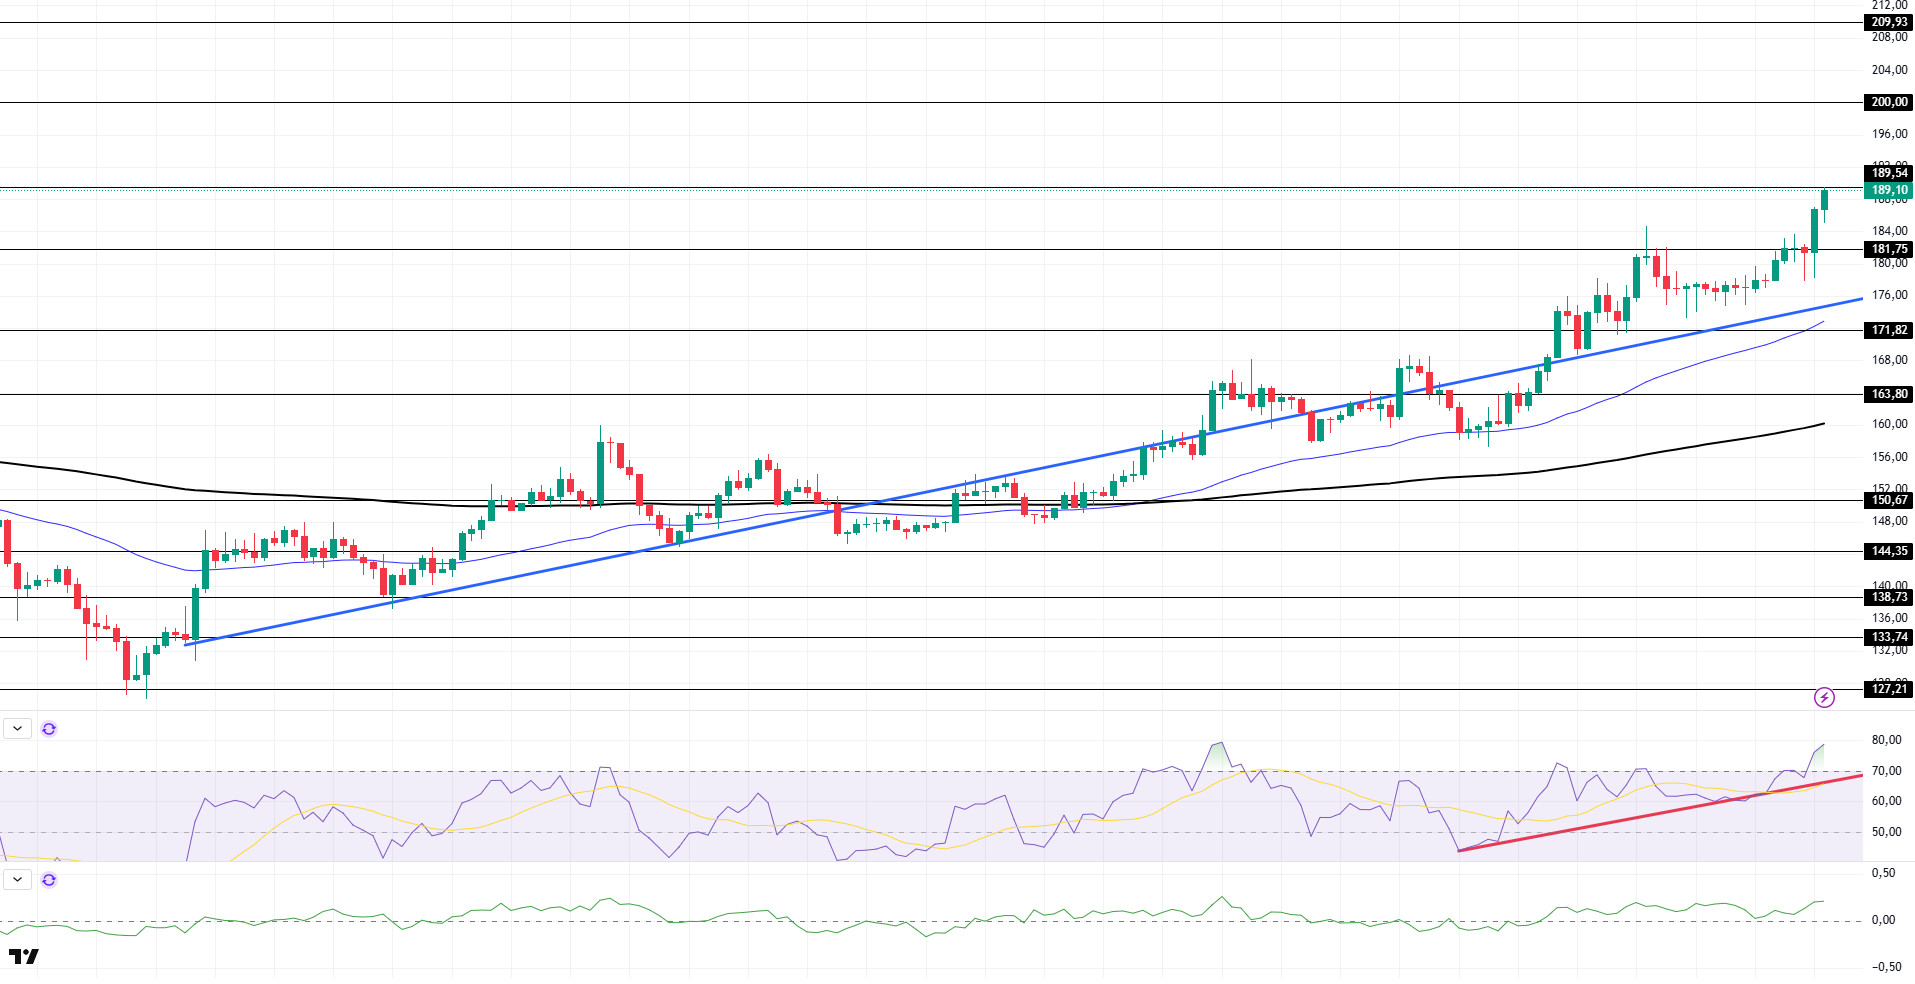
SOL/USDT
SOL price continued its uptrend. The asset continued to be above the uptrend that started on June 23. Accelerating upwards from the uptrend, the price received support from the $171.82 level and broke the $181.75 level. If the rise continues, the $ 200.00 level can be followed. In case of a pullback, the rising trend may work with support.
On the 4-hour chart, the 50 EMA (Blue Line) continues to be above the 200 EMA (Black Line). This suggests that the uptrend may continue in the medium term. At the same time, the fact that the price is above both moving averages suggests that the market is currently in a bullish trend in the short term. Chaikin Money Flow (CMF-20) continued to be in positive territory. However, an increase in inflows could push CMF to the upper levels of the positive zone. Relative Strength Index (RSI-14), on the other hand, continues to be in positive territory and is in overbought territory. Additionally, it remained above the uptrend that started on July 15. The $200.00 level stands out as a strong resistance point in case of an uptrend on the back of macroeconomic data or positive news about the Solana ecosystem. If this level is broken upwards, the rise can be expected to continue. If there are pullbacks due to contrary developments or profit realizations, the $171.82 level may be tested. In case of a decline to these support levels, the increase in buying momentum may offer a potential bullish opportunity.
Supports 181.75 – 171.82 – 163.80
Resistances 189.54 – 200.00 – 209.93
DOGE/USDT
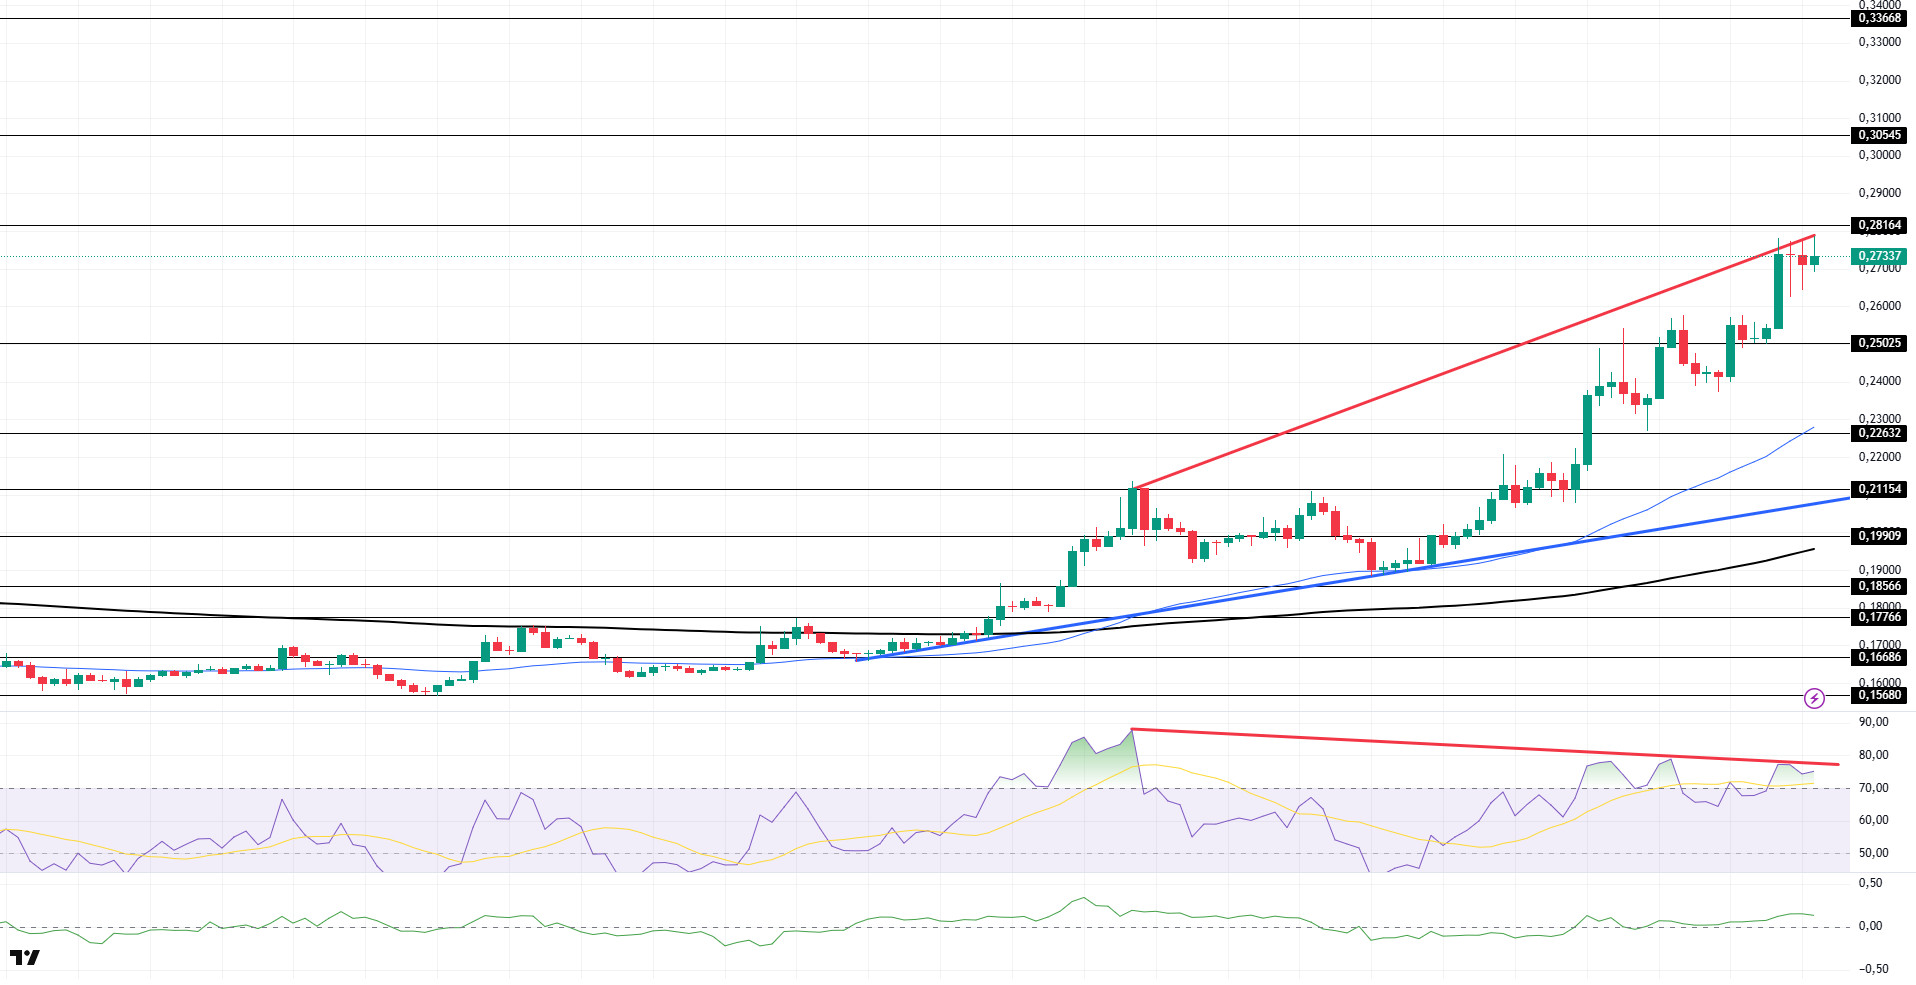
DOGE price continued its uptrend. The asset continued to stay above its 200 EMA (Black Line) and 50 EMA (Blue Line) moving averages in an uptrend that started on July 7. Breaking the strong resistance at $0.25025, the asset is preparing to test the $0.28164 level by maintaining its momentum. If the upward momentum continues, it may retest the $0.30545 level. In case of a retracement, the $ 0.25025 level should be followed.
On the 4-hour chart, the 50 EMA (Blue Line) continues to be above the 200 EMA (Black Line). This suggests that the asset is bullish in the medium term. The fact that the price is above both moving averages suggests that the asset is bullish in the short term. Chaikin Money Flow (CMF-20) continued to be in positive territory. In addition, negative inflows may move CMF into negative territory. Relative Strength Index (RSI-14) remained in positive territory and rose to the overbought level. However, it remained below the downtrend that started on July 11. In addition, there is a regular divergence pattern. This may cause the price to fall. The $0.30545 level stands out as a strong resistance zone in case of a rally in line with political developments, macroeconomic data or positive news flow in the DOGE ecosystem. In the opposite case or possible negative news flow, the $0.25025 level may be triggered. In case of a decline to these levels, the momentum may increase, and a new bullish wave may start.
Supports 0.25025 – 0.22632 – 0.21154
Resistances 0.28164 – 0.30545 – 0.33668
Legal Notice
The investment information, comments and recommendations contained herein do not constitute investment advice. Investment advisory services are provided individually by authorized institutions taking into account the risk and return preferences of individuals. The comments and recommendations contained herein are of a general nature. These recommendations may not be suitable for your financial situation and risk and return preferences. Therefore, making an investment decision based solely on the information contained herein may not produce results in line with your expectations.