BTC/USDT
SEC Chairman Paul Atkins announced that they are working on exemption policies to encourage asset tokenization. Stating that stablecoins are under the jurisdiction of banking regulators, Atkins’ statements are in parallel with the new legislative process. One out of every five senior officials in the Trump administration owns cryptocurrency; Trump has approximately $51 million in digital assets. President Trump also called on the Fed again, arguing that interest rates should be cut to 1%.
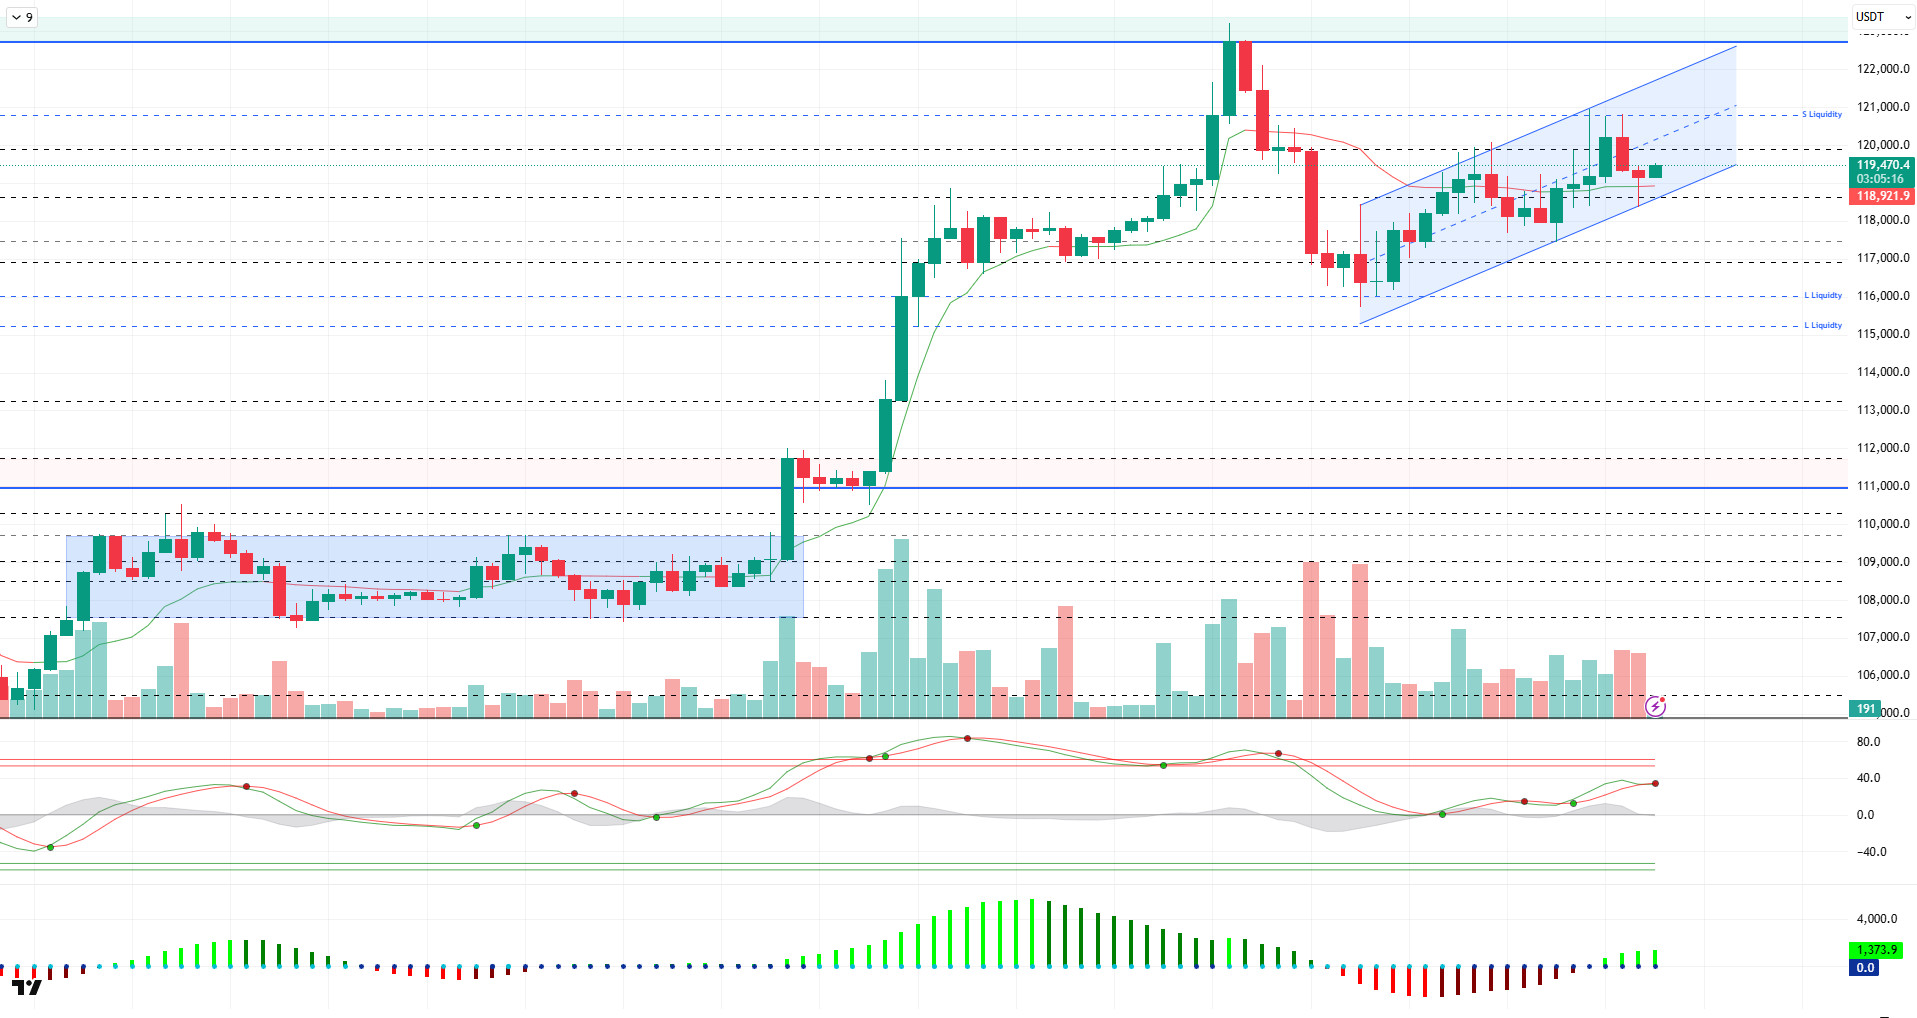
When we look at the technical outlook, BTC price tested the ATH level and then caught an uptrend again after correcting towards the 115,000 level. BTC, which exhibited relatively volatile movements during the day, tested the 118,600 support level, which is the trend bottom line. BTC, which is trading at 119,300 at the time of writing the analysis, will follow a double top at the ATH level in the continuation of the rise.
Looking at the technical indicators, the Wave Trend (WT) oscillator turned upwards and headed towards the overbought zone after an indecisive appearance in the channel mid-band with the recent decline. The histogram on the Squeeze momentum (SM) indicator regained momentum in positive territory. The Kaufman moving average crossed below the price at 118,900, supporting the upside.
Liquidity data showed that with the recent rise, the sell trades were liquidated at 120,000, while another selling level was accumulated at 121,500. Buy trades continue to accumulate at the 115,000 level in the wider timeframe.
In summary, the price is once again heading towards the ATH level as fundamental developments continue to contribute positively to pricing. While the technical outlook supports this outlook in the short term, liquidity data reflects that buying positions are dominant. Closures above the 120,000 minor resistance point will be followed in the continuation of the rise, while we will follow the 118,600 support level in a possible selling pressure.
Supports 118,600 – 117,500 – 116,800
Resistances 120,000 – 121,000 – 123,000
ETH/USDT
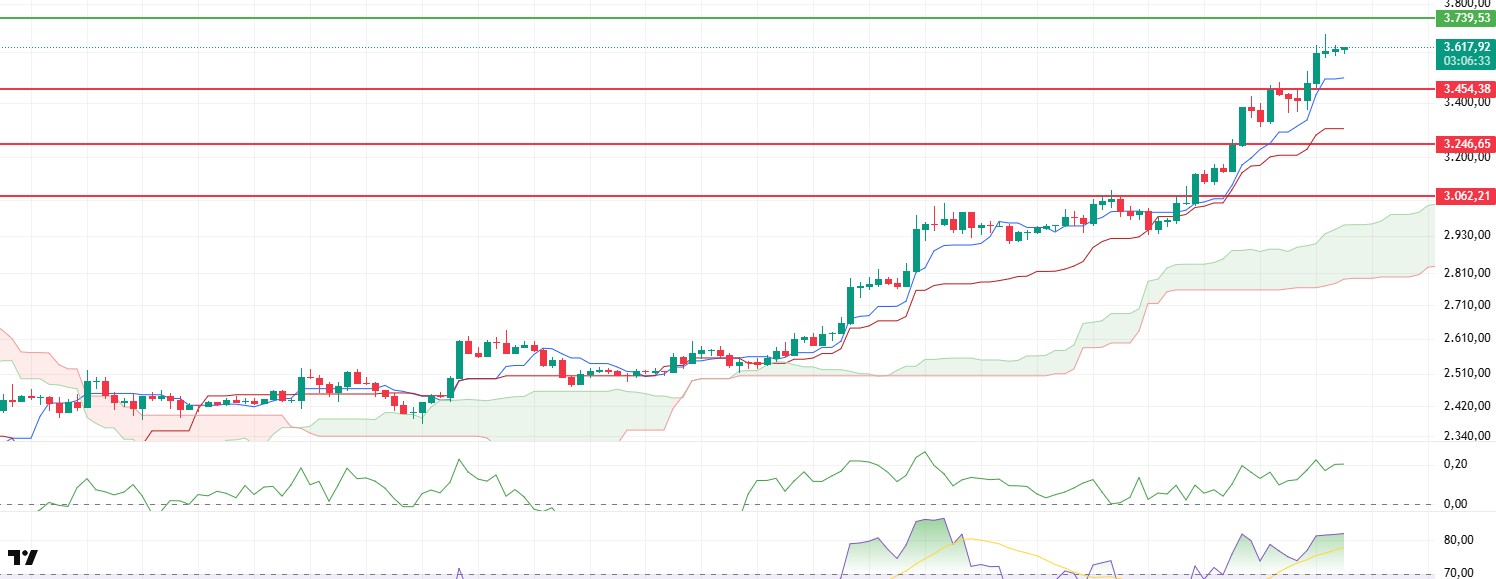
ETH tested its intraday peak, rising as high as $3,673 in the morning hours, and then retreated to $3,583 with profit realizations. After this decline, the price has entered a recovery trend and is in an effort to maintain the $3,600 band. The price’s search for stability in this region may be decisive in terms of determining the direction in the short term.
Technical indicators clearly reflect the market’s current indecision. Chaikin Money Flow (CMF) is flat in positive territory, indicating a period of neither strong inflows nor sharp outflows of market liquidity. In other words, there is a relative balance between buyers and sellers. This supports a directionless and horizontal course in short-term price movements.
When the Ichimoku cloud is analyzed, the narrowing of the cloud and the horizontal movement of the Tenkan and Kijun lines provide technical confirmation of the current consolidation process. Such structures are usually seen before a change in direction or the start of a strong trend. However, the fact that no clear breakout has occurred yet suggests that the price is stuck in this narrow range. On the other hand, the RSI indicator is also flat in the overbought zone, suggesting that the upside momentum is weakening and the market is entering a respite period.
In general terms, it is seen that the price is stuck between the resistance of $3,739 and the support of $3,454 and is in search of a direction within this range. Possible breakouts outside this band will be decisive in determining the short-term direction. An upward breakout could pave the way for the continuation of the previous uptrend, while a downward breakout could pave the way for deeper correction movements. Therefore, it is extremely important to focus on the reactions that will occur in major support and resistance zones, considering that there may be an increase in volatility in this process.
Supports 3,455 – 3,246 – 3,062
Resistances 3,739 – 4,084 – 4,365
XRP/USDT
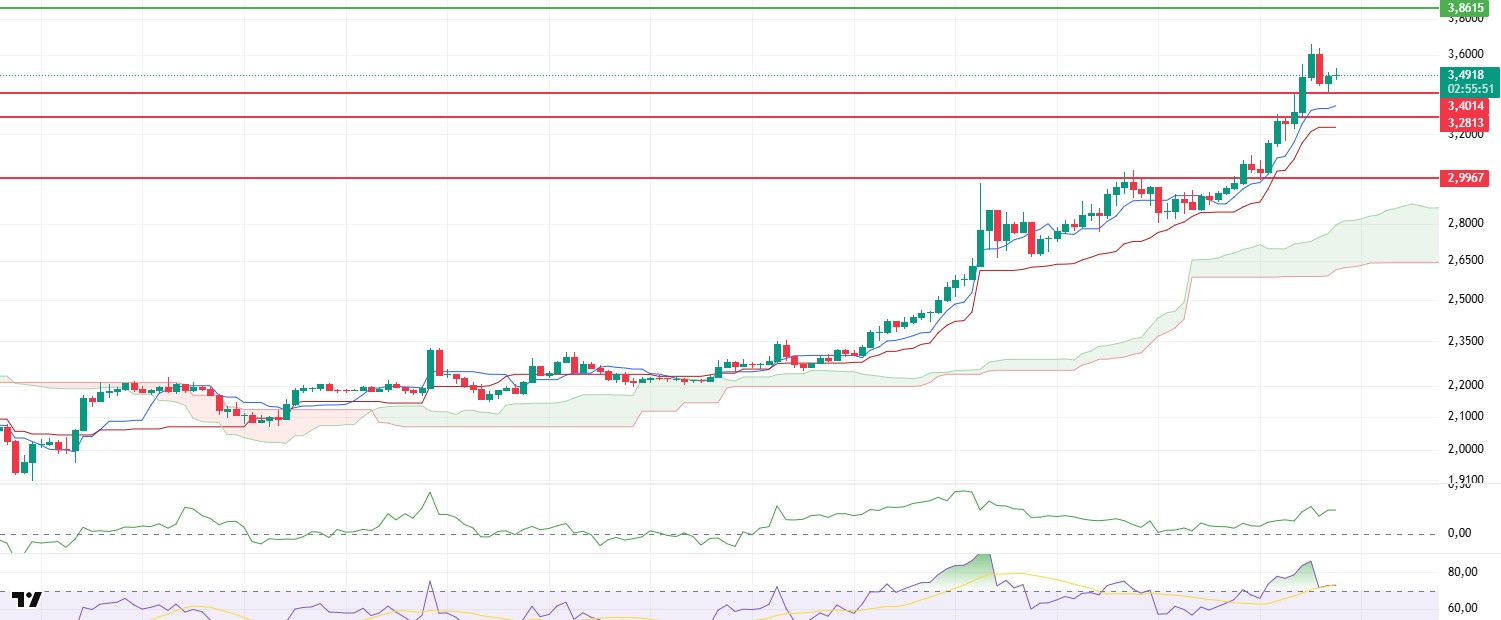
XRP continued its rise in the morning hours and managed to accelerate to the $3.66 level, but experienced a gradual retreat during the day with profit sales from this region. The price fell to the $3.40 level, reacted to the support in this region and recovered again and settled above the $3.49 level. This price behavior indicates that buyers remain strong in the short term, but at the same time, volatility has increased.
Technical indicators are in line with price movements. The Relative Strength Index (RSI) remains in the overbought territory despite the pullback. While this suggests that the appetite for buying among market participants remains strong, the fact that the RSI hovers at such high levels also suggests that the price is vulnerable to the risk of a correction in the short term. In other words, even if bullish appetite persists, short-term profit realizations or corrections are common in such overbought areas.
The Chaikin Money Flow (CMF) indicator continues to trend upwards, remaining in positive territory despite the price pullback. This suggests that there is still a clear liquidity inflow into the market, meaning that investors are using the declines as buying opportunities. This structure of CMF confirms that the price is resistant to declines and that the current trend may find support in the short term.
Overall, it seems likely that the uptrend in XRP price will continue. However, the fact that technical indicators remain in the overbought zone brings with it the risks of sudden pullbacks. For this reason, caution should be exercised against possible corrections in the short term. In particular, the $3.40 level stands out as the first important support, while below this level, the $3.28 region should be followed as a stronger support area. Both regions should be carefully monitored to determine whether possible corrections will deepen. The reactions from these regions are among the key points that will determine whether the price can start a new bullish wave.
Supports 3.4014 – 3.2813 – 2.9967
Resistances 3.8615 – 4.000 – 4.4000
SOL/USDT
Shinhan bank launched crypto services on its SOL app ahead of the regulatory change in Korea.
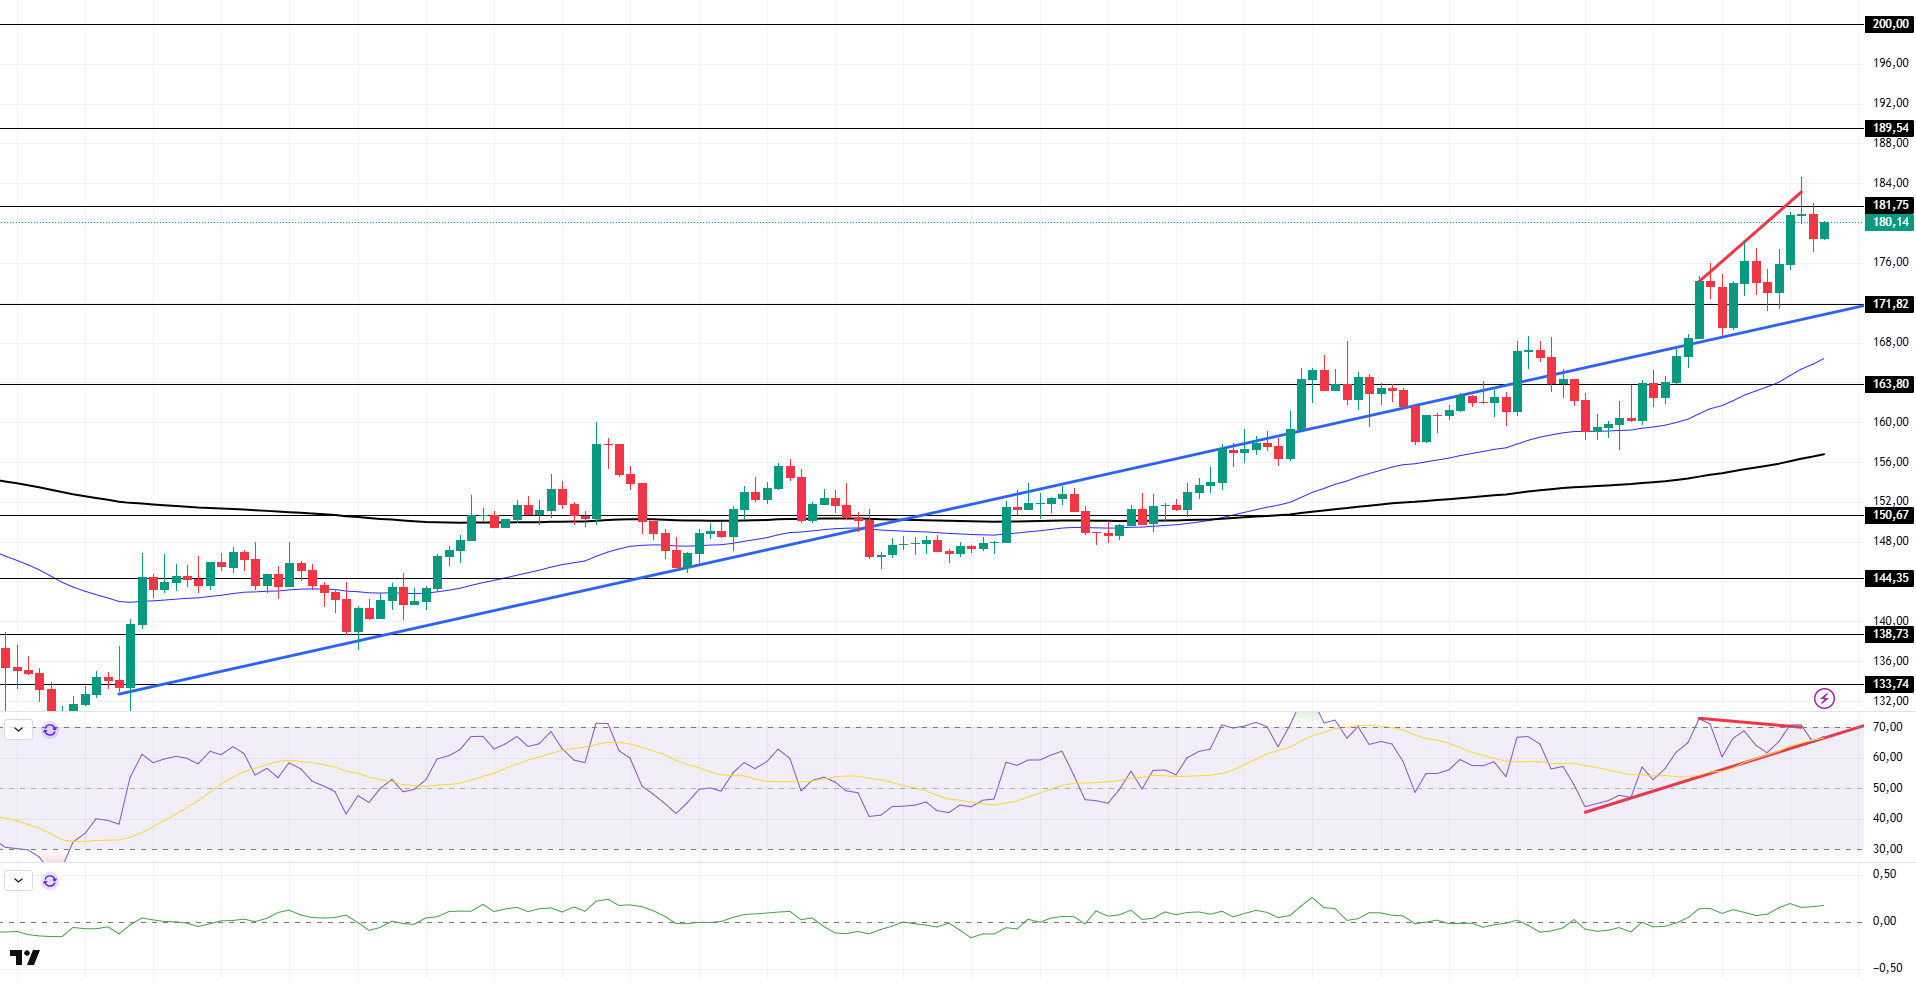
SOL price continued its uptrend during the day. The asset continued to be above the uptrend that started on June 23. The price accelerated upwards from the uptrend and started to be above the $171.82 level. The asset, which is currently testing the $ 181.75 level as resistance, has retreated from here. If the pullback continues, the rising trend may work with support.
On the 4-hour chart, the 50 EMA (Blue Line) continues to be above the 200 EMA (Black Line). This suggests that the uptrend may continue in the medium term. At the same time, the fact that the price is above both moving averages suggests that the market is currently in a bullish trend in the short term. Chaikin Money Flow (CMF-20) continued to be in positive territory. However, a decrease in inflows could move CMF into negative territory. Relative Strength Index (RSI-14) continues to be in positive territory. In addition, the uptrend that started on July 15 is currently testing support. At the same time, negative divergence should be monitored. In case of an uptrend driven by macroeconomic data or positive news on the Solana ecosystem, the $181.75 level stands out as a strong resistance point. If this level is broken upwards, the rise can be expected to continue. If there are pullbacks due to contrary developments or profit realizations, the $ 171.82 level can be tested. In case of a decline to these support levels, the increase in buying momentum may offer a potential bullish opportunity.
Supports 171.82 – 163.80 – 150.67
Resistances 181.75 – 189.54 – 200.00
DOGE/USDT
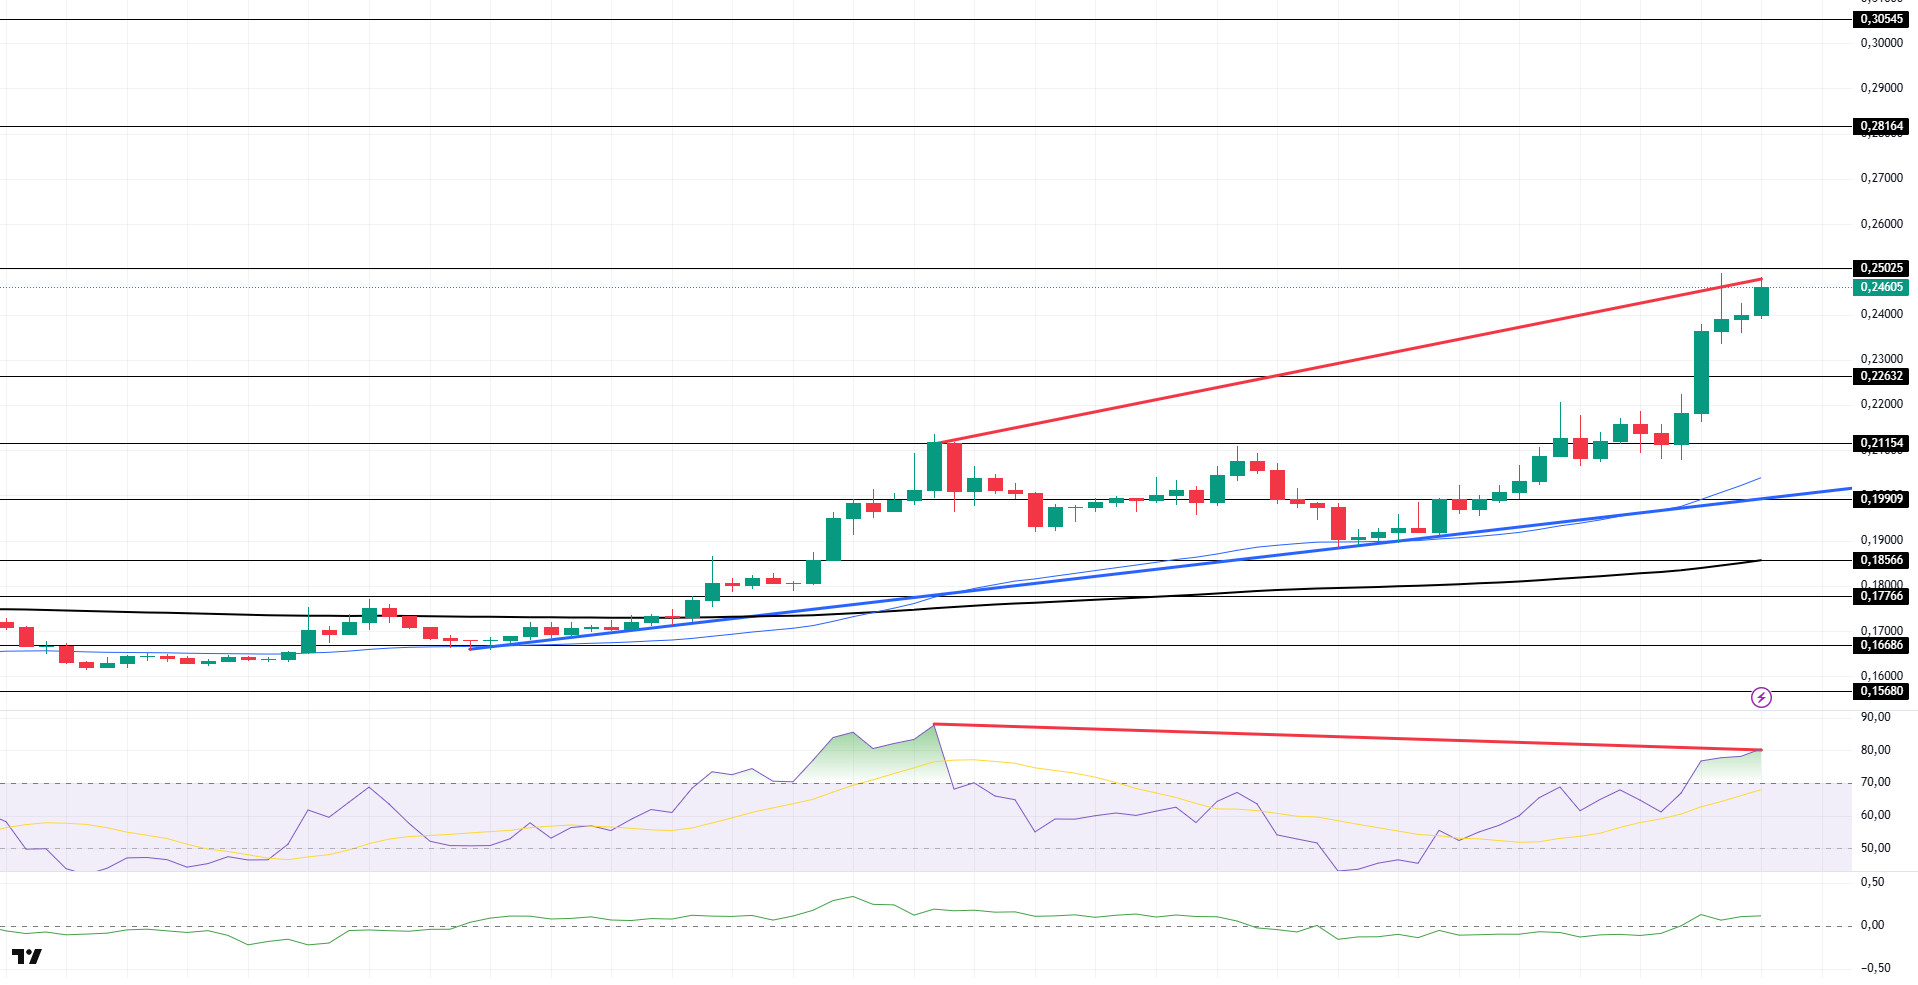
DOGE price continued its uptrend during the day. The asset continued to stay above the 200 EMA (Black Line) and 50 EMA (Blue Line) moving averages with the uptrend that started on July 7. The asset, which broke the strong resistance level of $ 0.22632, continued its momentum, hit resistance at $ 0.25025 and retreated. If the upward acceleration continues, it may retest the $ 0.25025 level. In case of a retreat, the level of 0.22632 dollars should be followed.
On the 4-hour chart, the 50 EMA (Blue Line) continues to be above the 200 EMA (Black Line). This suggests that the asset is bullish in the medium term. The fact that the price is above both moving averages suggests that the asset is bullish in the short term. Chaikin Money Flow (CMF-20) continued to be in positive territory. In addition, positive inflows may push CMF to the upper levels of the positive zone. Relative Strength Index (RSI-14), on the other hand, remained in positive territory and rose to the overbought level. Additionally, there is a regular divergence pattern. This may cause the price to fall. The $0.25025 level stands out as a strong resistance zone in the event of a rally in line with political developments, macroeconomic data or positive news flow in the DOGE ecosystem. In the opposite case or possible negative news flow, the $0.22632 level may be triggered. In case of a decline to these levels, the momentum may increase and a new bullish wave may start.
Supports 0.22632 – 0.21154 – 0.19909
Resistances 0.25025 – 0.28164 – 0.30545
Legal Notice
The investment information, comments and recommendations contained herein do not constitute investment advice. Investment advisory services are provided individually by authorized institutions taking into account the risk and return preferences of individuals. The comments and recommendations contained herein are of a general nature. These recommendations may not be suitable for your financial situation and risk and return preferences. Therefore, making an investment decision based solely on the information contained herein may not produce results in line with your expectations.