
Technical Analysis
BTC/USDT
The Fed’s 25 basis point rate cut at its December meeting, Powell’s cautious messaging, and the clear divergence seen in the dot plot projections increased uncertainty about the future of monetary policy. However, the Fed’s preparation to re-expand its balance sheet through short-term Treasury purchases was viewed by the markets as a supportive step. The bank announced that it would start the process with $40 billion in purchases this month and aims to gradually slow the pace of purchases next year.
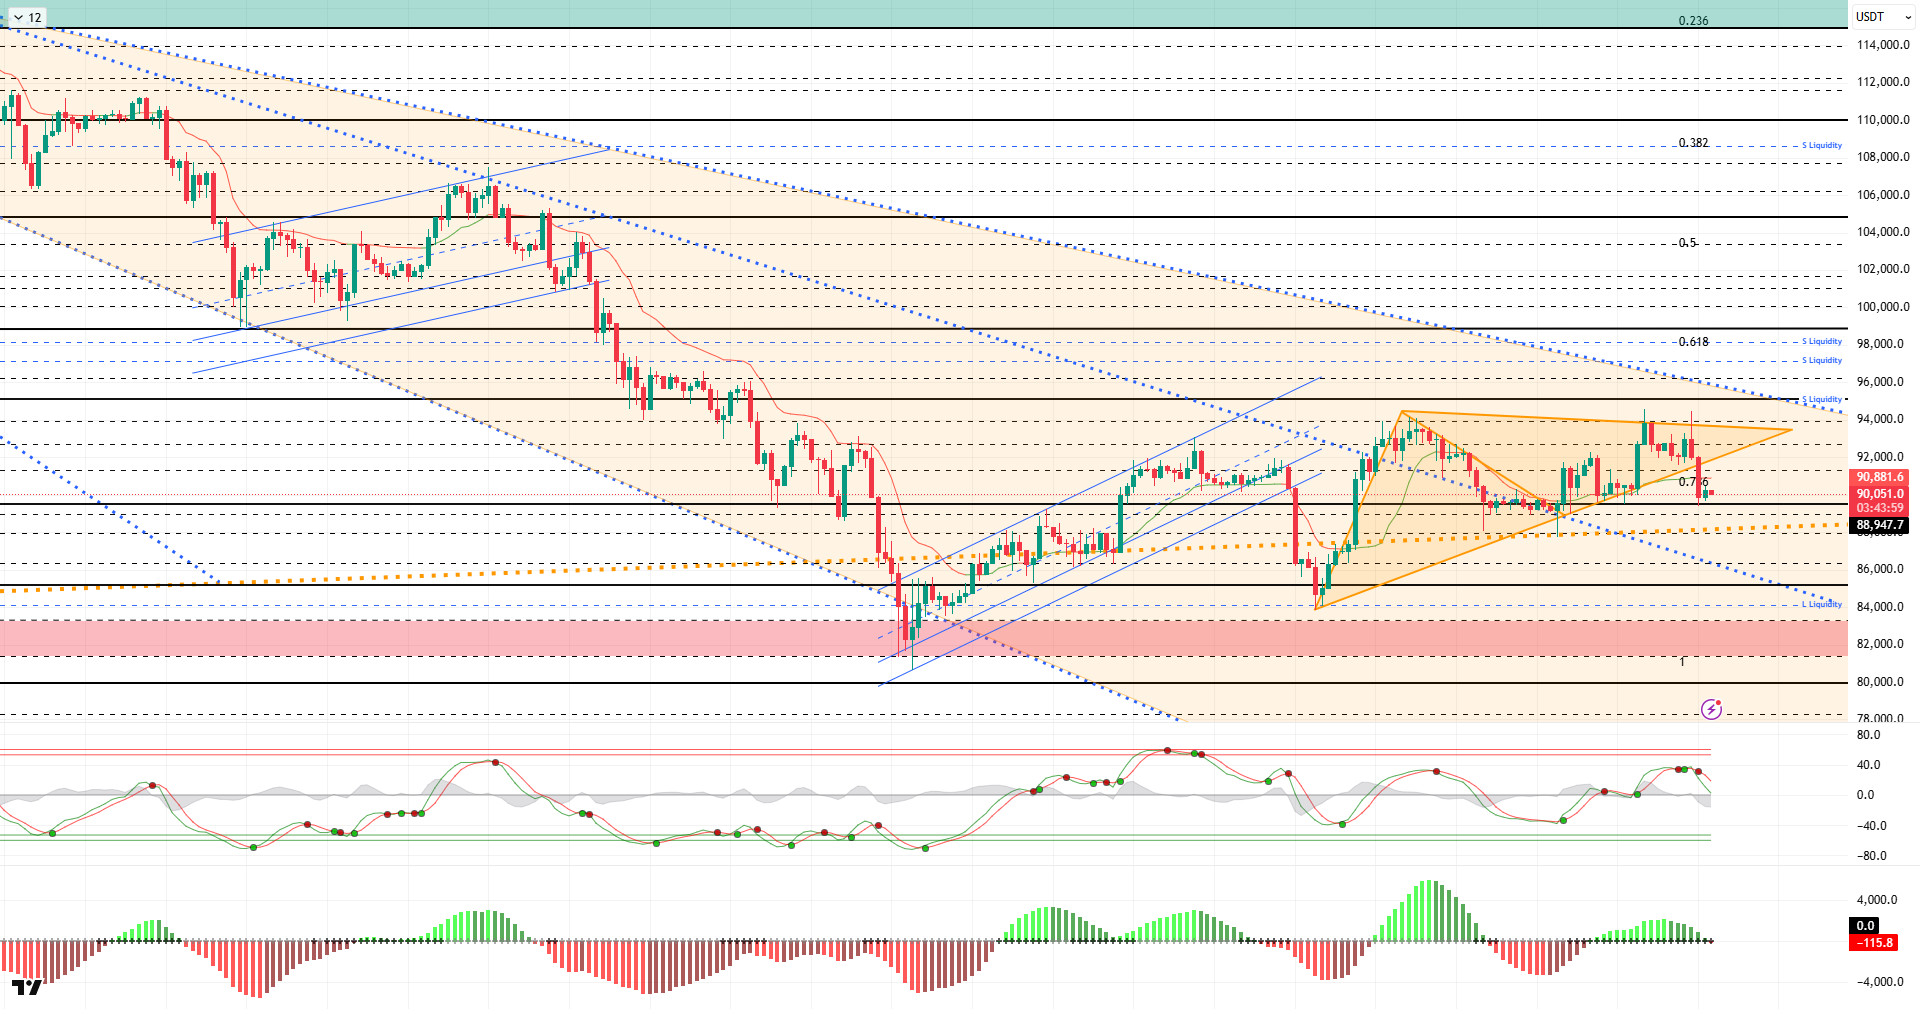
From a technical perspective, volatility in BTC has increased significantly due to the impact of fundamental news flow. The price structure, which had formed higher lows, was pushed to a higher peak by yesterday’s sharp spike, creating a double top pattern in the short term. However, with strong selling pressure from this region, BTC broke down from the triangle formation and retreated back to the 90,000 reference level. Recent price movements point to the formation of a horizontal channel within a downtrend, and it is critical that there is no sustained break below the 90,000 level in order to maintain the current structure.
Technical indicators show the Wave Trend (WT) oscillator giving a sell signal just above the channel midband, while the histogram on the Squeeze Momentum (SM) indicator is weakening in positive territory. The Kaufman moving average (KAMA) is currently trading above the price at the $90,800 level.
According to liquidation data, with the recent rise, sell-side transactions resulted in liquidation in the short term at the 92,000 – 94,500 level. In the monthly view, it continues to maintain its intensity within the 97,000 – 98,000 band. Short-term trades have created fragmented intensity within the 89,000 – 90,000 range.
In summary, although the Fed cut interest rates as expected, it emphasized that uncertainty regarding the course of policy for the coming year persists. On the other hand, another important development that caught the attention of the markets was the Fed’s preparation to expand its balance sheet by repurchasing short-term Treasury bonds. On the technical side, BTC, which retreated to the 80,500 level following the downtrend that began after the ATH, rebounded strongly from this region. It then settled above the 90,000 level and continues to trade there. Liquidity data shows that target zones have regained importance and the market has found equilibrium, while the intensity of the selling pressure has increased. After this stage, the 90,000 level has become a critical point for the price to maintain its momentum. Closings and pricing above this level are an important indicator for regaining momentum. In this context, 95,000 stands out as the next target area, and once it is passed, liquidity areas will be monitored again. In the event of possible selling pressure, 90,000 stands out again as the reference area, and in the event of a breakout, the 87,500 level, which is the point where the major uptrend passed, will be monitored.
Supports: 91,400 – 90,000 – 89,000
Resistances: 92,600 – 94,000 – 95,000
ETH/USDT
Ethereum gained strong upward momentum yesterday evening, breaking through both the $3,227 and $3,368 resistance levels in succession and climbing to $3,440. However, following the Fed’s interest rate decision and Powell’s speech, risk appetite weakened, putting pressure on the price in the morning hours, and ETH retreated to the $3,167 level. After this move, the price stabilizing around $3,200 shows that despite the sell-off reaction, the market has not completely collapsed and buyers are still active.
The pullback effect is clearly visible on the liquidity side. The downward movement of the Chaikin Money Flow (CMF) indicator accompanying the decline signals short-term liquidity outflows from the market. However, the CMF remaining in positive territory suggests that buyers have not completely exited the market and that the declines may be limited.
The Relative Strength Index (RSI) indicator has pulled back to the 50 level, completing a significant correction. Although the price has retreated, the RSI showing positive divergence in the low regions is creating a noteworthy signal. This structure suggests that a new upward movement could develop in the short term and that the momentum recovery potential is strengthening.
The overall technical outlook on the Ichimoku side remains intact. Although the price has fallen below the Tenkan level, it is finding support from the Kijun line, indicating that buyers are defending this area. Furthermore, the price is still trading above the kumo cloud, confirming that the medium-term uptrend is intact. Despite short-term volatility, the positive structure in the larger time frame remains valid.
The critical threshold in the intraday view is the $3,227 level. If this support is regained, the price is expected to continue its upward movement and retest the $3,368 band. If this level is exceeded, the $3,478 target may come back into focus and create a strong foundation for the continuation of the rise. In a downward scenario, $3,070 is an important defense line ( ). Losing this region could increase selling pressure and open the door to a deeper correction. ETH is maintaining its positive structure despite overall market volatility, and as long as the price movement remains above the support levels, it indicates that the upward trend is expected to continue.
Below the Form
Supports: 3,074 – 3,020 – 2,910
Resistances: 3,227 – 3,368 – 3,478

XRP/USDT
The XRP price rose to $2.11 yesterday, showing a brief attempt at recovery, but with the continued weakness in technical indicators, sharp sell-offs kicked in. The price first lost the $2.05 support level and then retreated to the $2.00 level. This movement reveals that buyers have lost strength and that rebound rallies have failed to create a lasting impact on the market.
The Chaikin Money Flow (CMF) indicator deepening further into negative territory indicates an increase in the amount of capital exiting the market and a strengthening of selling pressure. Such a weak liquidity structure facilitates downward price movement.
The Relative Strength Index (RSI) indicator also continues its downward trend. The index remaining well below the 50 level confirms that momentum is entirely in the hands of sellers. This picture suggests that upward attempts will continue to be under pressure.
The Ichimoku indicator hasn’t changed either. The price is trading below the cloud, and the failure to break above the Tenkan and Kijun levels indicates that the trend is moving in a negative direction. In the short term, selling pressure suppressing every rise is consistent with this technical structure.
XRP is currently trading in a critical zone, and if it fails to reclaim the $2.05 level, the likelihood of continued selling pressure remains quite high. The possibility of the price retreating to $1.90 remains viable. Conversely, a strong rebound above the $2.05 level could pave the way for the first signs of recovery in the market and the start of a short-term uptrend. The overall structure indicates that buyers are still weak and the selling-dominated trend continues. The $2.05 level will remain decisive in determining the direction.
Supports: 1.9092 – 1.8121 – 1.6224
Resistances: 2.0543 – 2.1731 – 2.2729

SOL/USDT
Invesco Galaxy filed Form 8-A with the SEC. State Street and Galaxy Digital will launch a tokenized fund on Solana in 2026.
The SOL price has lost value. The asset moved into the lower region of the downtrend that began on October 6. The price, which lost approximately 10% of its value, broke below the 50 EMA (Blue Line) moving average and the downtrend with a strong bearish candle. Currently testing the downward trend line as resistance, the asset could retest the 200 EMA moving average if it experiences an uptrend. If the pullback continues, it could test the $120.24 level as support.
On the 4-hour chart, it remained below the 50 EMA (Exponential Moving Average – Blue Line) and 200 EMA (Black Line). This indicates a possible downtrend in the medium term. At the same time, the price being below both moving averages signaled that the asset is trending downward in the short term. The Chaikin Money Flow (CMF-20) has moved into negative territory. However, an increase in outflows could push the CMF deeper into negative territory. The Relative Strength Index (RSI-14) has fallen to the middle of the negative zone. It has also started to move below the rising line that began on December 1. This indicates that selling pressure is building. If there is an uptrend due to macroeconomic data or positive news related to the Solana ecosystem, the $150.67 level stands out as a strong resistance point. If this level is broken upwards, the uptrend is expected to continue. If there are pullbacks due to developments in the opposite direction or profit-taking, the $120.24 level could be tested. A decline to these support levels could increase buying momentum, presenting a potential opportunity for an upward move.
Supports: 127.21 – 120.24 – 112.26
Resistances: 133.74 – 138.73 – 144.35

DOGE/USDT
The DOGE price has lost value. The asset broke below the ceiling level of the descending triangle formation that began on November 13 and the 50 EMA (Blue Line) moving average, starting to move within the formation again. Currently losing momentum, the asset may test the base level of the descending triangle formation if it deepens its pullback. If rallies begin, it may test the top level of the formation and the 50 EMA moving average as resistance.
On the 4-hour chart, the 50 EMA (Exponential Moving Average – Blue Line) remained below the 200 EMA (Black Line). This indicates that the downtrend may continue in the medium term. The price being below both moving averages indicates a downward trend in the short term. The Chaikin Money Flow (CMF-20) has also fallen into negative territory. Additionally, a decrease in cash inflows could push the CMF deeper into negative territory. The Relative Strength Index (RSI-14) retreated from the middle of the positive zone to the middle of the negative zone. It also moved below the rising line that began on December 1. These developments signaled increased selling pressure. In the event of potential increases driven by political developments, macroeconomic data, or positive news flow within the DOGE ecosystem, the $0.15680 level stands out as a strong resistance zone. Conversely, in the event of negative news flow, the $0.13367 level could be triggered. A decline to these levels could increase momentum and potentially initiate a new wave of upward movement.
Supports: 0.13367 – 0.12824 – 0.12282
Resistances: 0.14237 – 0.14952 – 0.15680

AVAX/USDT
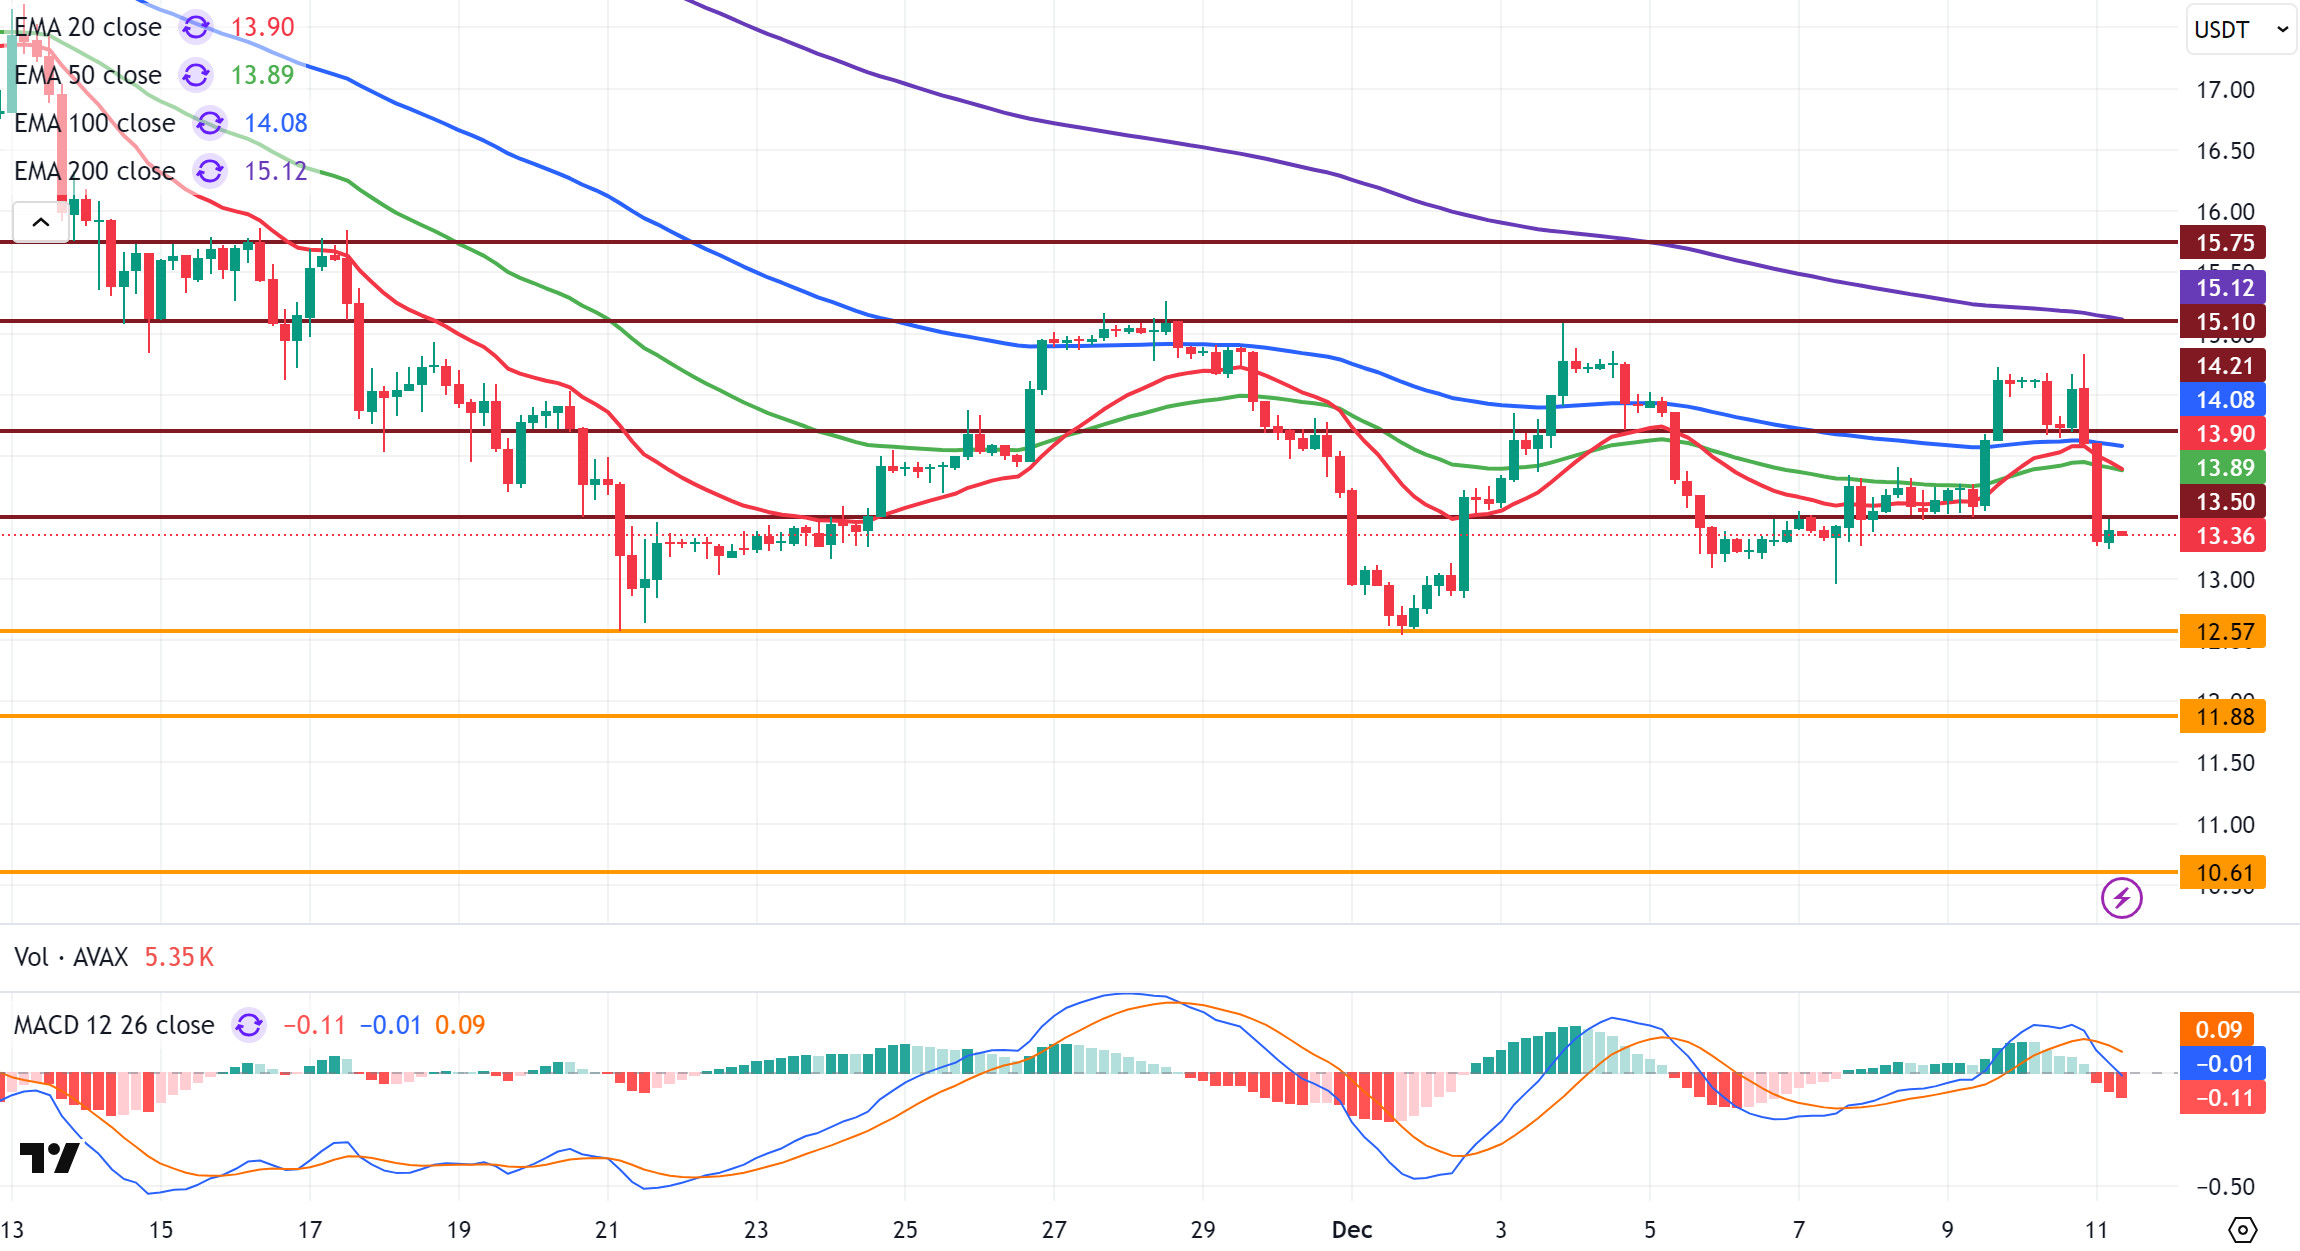
AVAX started yesterday at $14.60 and tested the $14.21 level during the first half of the day but failed to break through. In the second half of the day, the Fed Interest Rate Decision and FOMC Economic Projections announcements, followed by Fed Chair Powell’s speech, accelerated the decline. After testing the EMA100 level yesterday, AVAX closed the day at $14.11, losing approximately 3.4% of its value. AVAX started the new day with a sharp decline, breaking through the EMA20, EMA50, and $13.50 support levels to trade at $13.40, beginning the new day with a loss of approximately 5%.
On the 4-hour chart, yesterday’s sharp decline in AVAX caused the Moving Average Convergence/Divergence (MACD) line to break below the signal line and continue trading in negative territory. The MACD line is pointing down. The outlook on the MACD side is negative, and selling pressure has increased. Furthermore, with the decline experienced yesterday and today, AVAX has fallen below critical Exponential Moving Average (EMA) levels, creating a negative outlook and contributing to selling pressure. Overall, the outlook for AVAX on the MACD and EMA sides is negative, and selling pressure continues.
Technically, the first critical support level for AVAX’s decline is at $12.57. If it closes below this level, a decline towards the support levels of $11.88 and then $10.61 could be seen. Conversely, in a scenario where AVAX rises, the first critical resistance level is $13.50. If it closes above this level, the EMA levels form a critical resistance zone for the continuation of the rise, and if AVAX breaks through these levels, the $14.21 and $15.10 levels could come into play.
(EMA20: Red Line, EMA50: Green Line, EMA100: Blue Line, EMA200: Purple Line)
Supports: 12.57 – 11.88 – 10.61
Resistances: 13.50 – 14.21 – 15.10
LINK/USDT
Yesterday, with the announcement of the interest rate decision in the US, we saw quite volatile markets. Although Link moved above our resistance level of $14.48, it failed to close above this level, causing buyers to lose strength. With the market turning downward, our price retreated back to our support band at the $13 level. Currently, it is showing a squeeze between our 100-day moving average (Blue Line) and our 200-day moving average (Red Line). Although our short-term trend direction is still upward at present, the $13.56 level is our primary and strong horizontal support area, and losing this region could trigger panic selling. As seen in the chart, the price, which rebounded twice from the 11.73 level, has established this region as a strong structural base, paving the way for an upward reversal. The successful completion of the formation target is an important indicator confirming that short-term momentum in the market has shifted in favor of buyers. However, the price’s struggle to stay above the moving averages signals that the recovery is still progressing on fragile footing.
The most critical area in the upward scenario remains the 14.48 resistance level. Although the price encounters selling pressure every time it tests this level, successive attempts show that the market maintains its upward intent. A sustained break above 14.48 would confirm a structural reversal and could create new momentum to push the price first to the 15.40 band and then to the 15.71 target zone marked on the chart. This zone also stands out as a major area where the downtrend will be re-examined in a broader time frame.
In the downside scenario, the 13.56 level remains critically important as the first line of defense. Closings below this region could push the price towards the 12.91 support, leading to a weakening of short-term momentum. Should 12.91 also be lost, the market could face a broadening correction process towards 11.73, with pricing below this level completely invalidating the current positive outlook and bringing downward pressure back into focus in the medium term.
The Relative Strength Index (RSI) is fluctuating slightly below the middle band at the 42 level. For the RSI to return to positive territory and for the uptrend to gain strength, the price must be supported by closes above 14.48. Otherwise, it seems more likely that the price will continue to consolidate within a sideways-choppy structure.
Supports: 13.56 – 12.91 – 11.73
Resistances: 14.48 – 15.40 – 15.71

Legal Notice
The investment information, comments, and recommendations contained herein do not constitute investment advice. Investment advisory services are provided individually by authorized institutions taking into account the risk and return preferences of individuals. The comments and recommendations contained herein are of a general nature. These recommendations may not be suitable for your financial situation and risk and return preferences. Therefore, making an investment decision based solely on the information contained herein may not produce results in line with your expectations.

