
Technical Analysis
BTC/USDT
The main agenda of the week in global markets was shaped around messages from central banks and US-related political and economic headlines. The apparent differences of opinion among officials following the Fed meeting increased uncertainty about the future course of monetary policy, while Trump’s steps regarding the Fed chairmanship and his statements on economic policies drew attention. In Asia, tightening signals from the Bank of Japan and China’s fiscal and monetary data provided important clues about global liquidity and growth prospects.
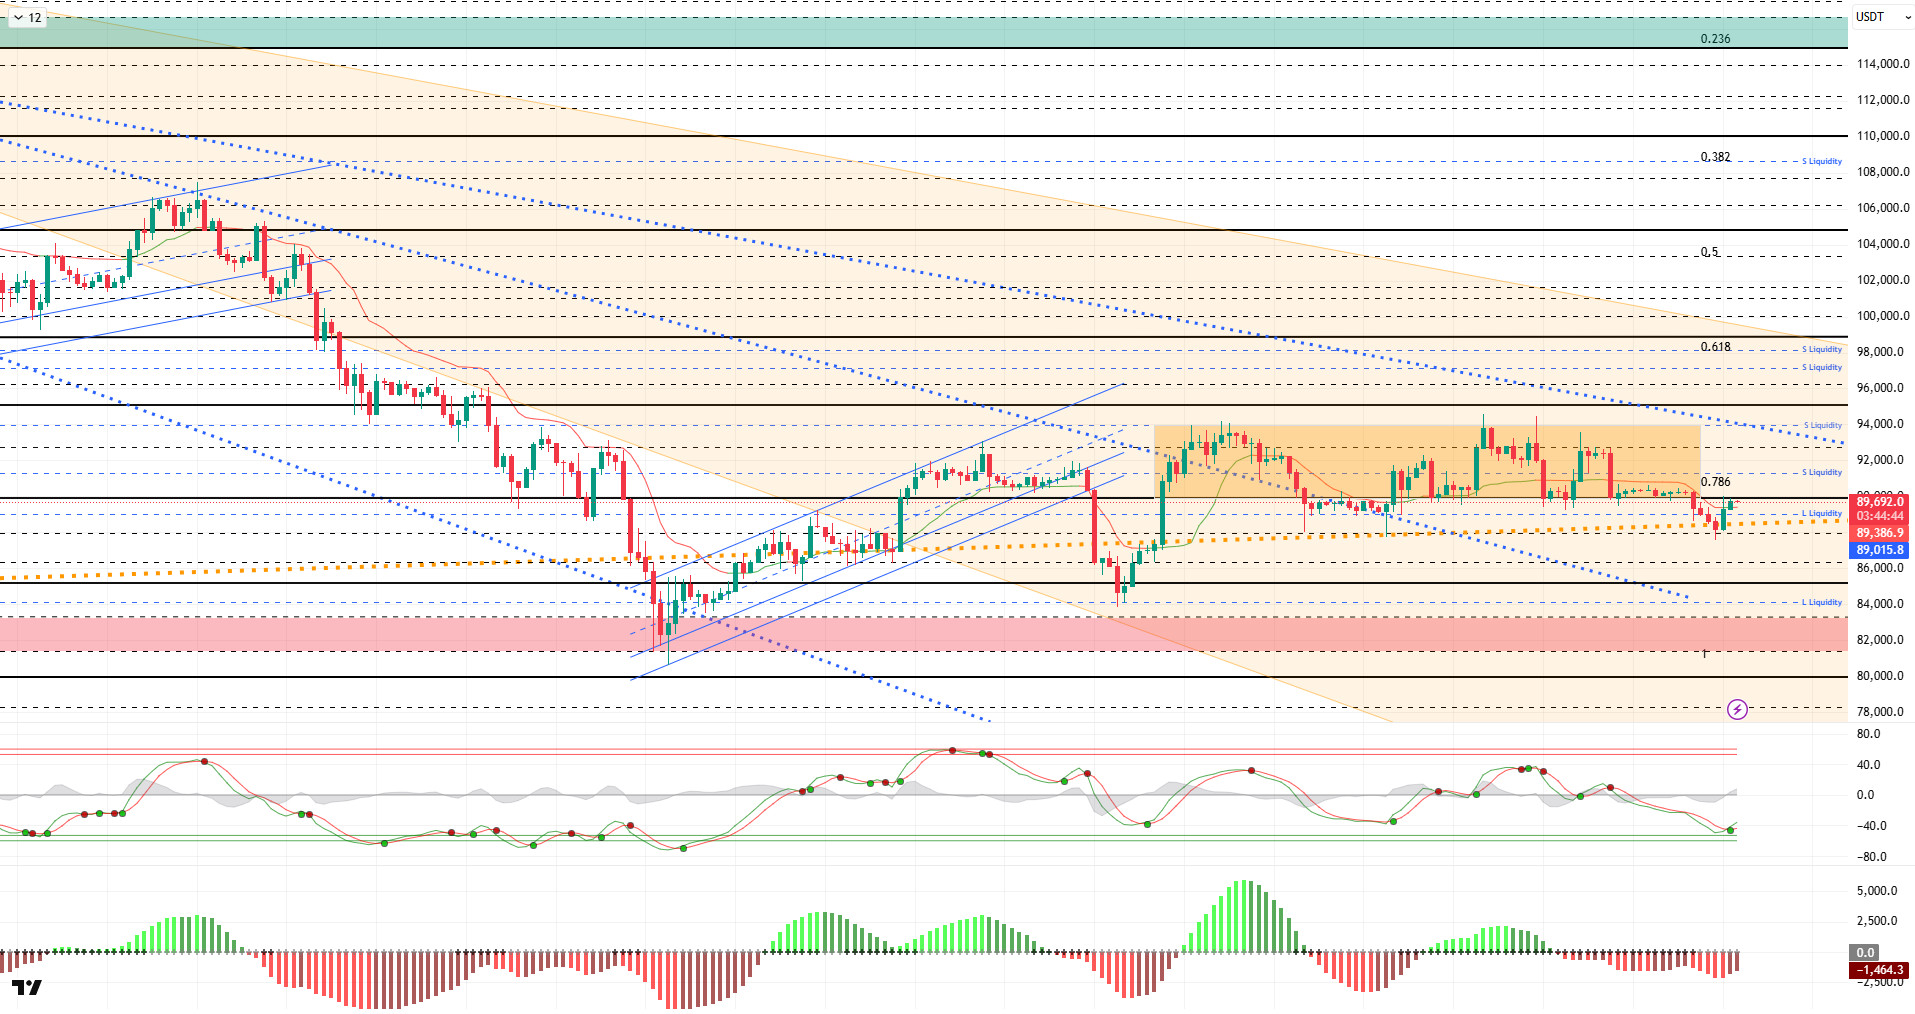
From a technical perspective, BTC lost its consolidation process in the horizontal band range and re-engaged with the major uptrend, retreating to the 87,600 level. After recording four short-bodied bearish candles, the price, which is challenging the 90,000 level again with a long-bodied bullish candle, continues to trade at the 89,750 level at the time of writing.
Technical indicators show that the Wave Trend (WT) oscillator has returned to the oversold zone after the recent decline, generating a buy signal. The histogram on the Squeeze Momentum (SM) indicator is attempting to gain momentum within the negative zone. The Kaufman Moving Average (KAMA) is currently trading below the price at the $89,380 level.
Looking at liquidation data, it appears that all positions accumulated in the short-term buy levels at and below the 89,000 level have been liquidated with the recent pullback. Following this process, the 87,500 level stands out as an area where fragmented buying has re-entered the market. Short-term sell-side transactions are concentrated mainly at the 91,100 level, while in the upper region, a significant liquidation and position clustering in the 94,500 – 95,800 band is noteworthy. From a monthly perspective, the 97,000–98,000 range stands out as the main resistance zone, maintaining the intensity of sell positions.
In summary, statements from Fed members following the Fed meeting reveal differences in opinion on the policy front, while Trump appears to be evaluating the selection process for the new Fed chair. In this context, Hassett’s name stands out, and his statements emphasize the Fed’s independence, preparing markets for possible scenarios. Meanwhile, the BOJ continues to signal its intention to pursue the highest interest rate hike in nearly 30 years. Technically, BTC, which retreated to the 80,500 level following the downtrend that formed after the ATH, rebounded strongly from this region. Subsequently, the price settled above the 90,000 level and entered a consolidation phase for a while, then pulled back again to test the major uptrend line and managed to hold on with support from this area. When liquidity data is examined, it is seen that areas with concentrated short-term trading are being targeted, while long-term sell orders have not yet been tested. This structure indicates that the liquidity accumulated in the market could trigger a sharp and directional price movement in the coming period. After this stage, 90,000 has become a critical point again for the price to maintain its momentum. Closings and pricing above this level are an important indicator for regaining momentum. In this context, 95,000 stands out as the next target area, and once it is passed, liquidity areas will be monitored again. In the event of a possible selling pressure, the 88,500 level, which is the point where the major uptrend passed, will be monitored.
Supports: 90,000 – 89,000 – 88,000
Resistances: 91,400 – 92,600 – 94,000
ETH/USDT
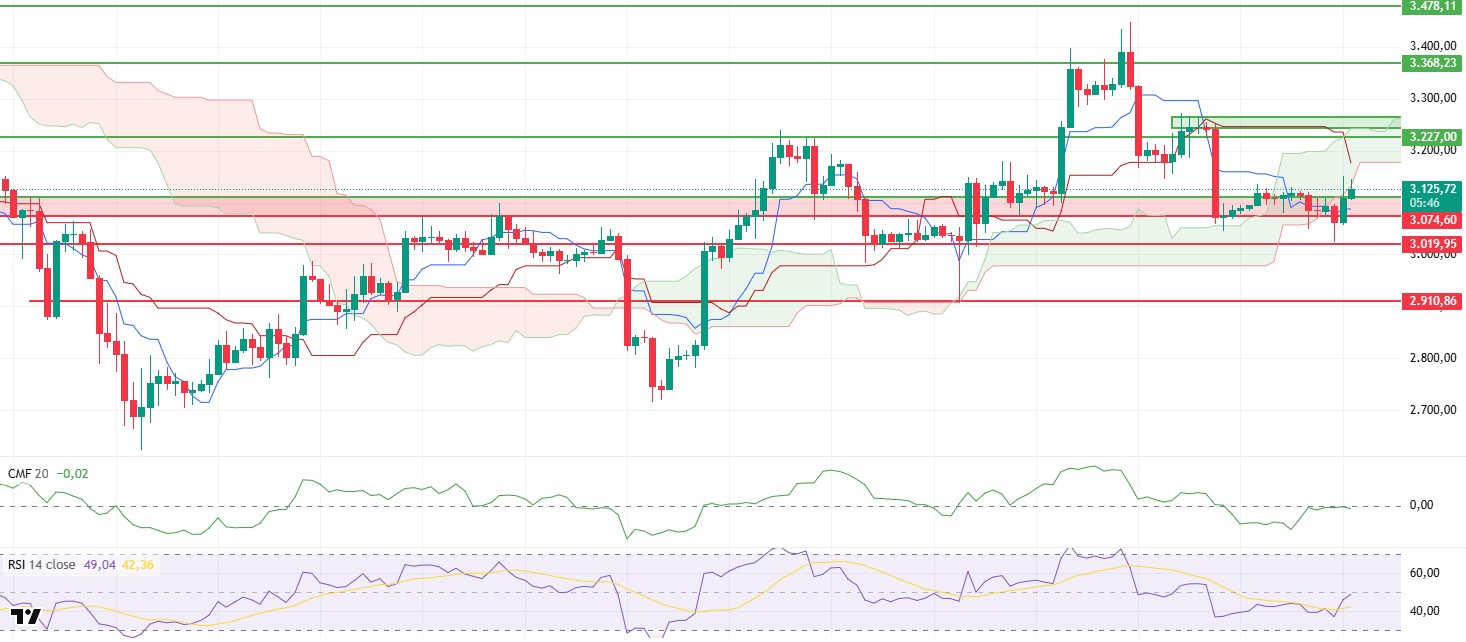
The ETH price retreated to the $3,048 level amid sharp selling on Friday and traded in a narrow range with low volume over the weekend. The price, which fell to the $3,020 level, managed to climb back above the $3,120 level after the weekly close thanks to rebound buying. While this recovery indicates that selling pressure has weakened in the short term, it also signals that the price is still advancing on fragile ground.
It is difficult to speak of a clear strengthening on the liquidity side. The Chaikin Money Flow (CMF) indicator is moving sideways around the zero line, showing that the capital entering the market has not yet reached a level that would support an uptrend. The uncertainty in liquidity flow stands out as one of the key factors limiting upward moves.
A similar picture emerges on the momentum front. Although the Relative Strength Index (RSI) has recovered to the 50 level, this movement has not yet translated into structural strength. The RSI’s inability to maintain stability in this region reveals that buyers are struggling to gain momentum and that the desire for an uptrend has not strengthened sufficiently.
The technical outlook has weakened significantly on the Ichimoku indicator. The price falling below the kumo cloud and the Tenkan level positioning below the Kijun level indicate that the short- and medium-term trend has turned negative. This structure also technically supports why upward attempts are met with selling.
In the current scenario, the price’s failure to regain the area marked by the green rectangle on the chart increases the downside risks. The $3,070 level is the most critical support in the short term. If the price remains below this level, selling pressure is likely to accelerate, and sharper pullbacks may come into play. For an upward scenario to gain traction, requires both a significant recovery in liquidity and the price to rise above the cloud zone again. Otherwise, it would not be surprising if the bearish trend in ETH continues for a while longer.
Below the Form
Supports: 3,074 – 3,020 – 2,910
Resistances: 3,227 – 3,368 – 3,478
XRP/USDT
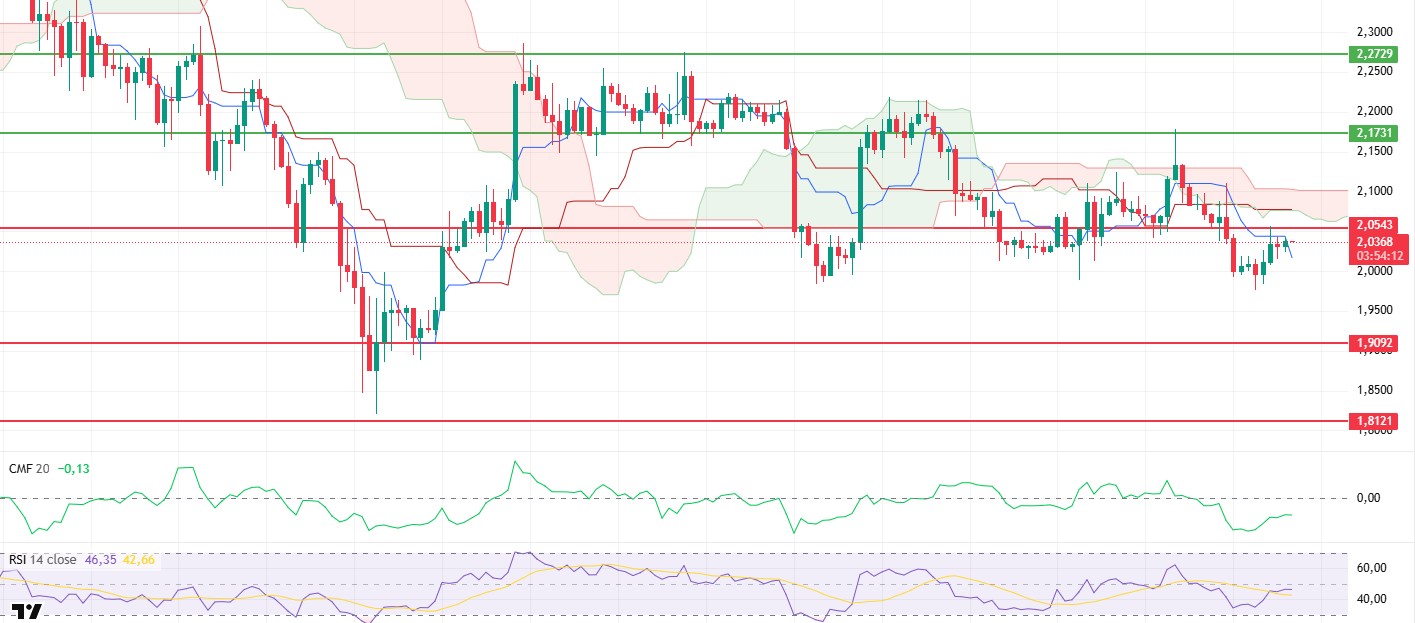
The XRP price experienced a sharp pullback after testing the $2.05 level on Friday, losing buyer support and falling to the $1.97 level. Although there were upward attempts over the weekend, these movements were not sustainable, and the price fell below the $2.00 level, especially with the renewed increase in selling pressure on Sunday. This price behavior indicates that the weak structure in the market persists and buyers have not yet been able to restore balance.
The picture is even more negative on the liquidity front. The Chaikin Money Flow (CMF) indicator continues its decline in negative territory, revealing an increase in capital leaving the market. The continuation of liquidity outflows explains why rebound rallies are short-lived and indicates that downside risks remain alive.
There is no strong recovery on the momentum front either. Although the Relative Strength Index (RSI) indicator reacts from time to time, it generally maintains its weak structure. The RSI remaining at low levels confirms that buyers cannot take control of momentum and that the price is struggling to make upward moves.
The technical outlook is quite bearish on the Ichimoku indicator. The price continues to trade below the kumo cloud, and the Tenkan and Kijun levels have not been clearly breached. This structure shows that the trend remains clearly downward and that upward attempts are not technically supported.
Regaining the $2.05 level is critical for a change in direction in the current pricing structure. Unless this area is broken through with volume, the downtrend is likely to continue, and the price could face pressure towards the $1.90 region. Conversely, a strong break above $2.05 could break the weak outlook and pave the way for a more meaningful recovery. At this stage , technical and liquidity weaknesses indicate that the downward scenario remains dominant.
Supports: 1.9092 – 1.8121 – 1.6224
Resistances: 2.0543 – 2.1731 – 2.2729
SOL/USDT
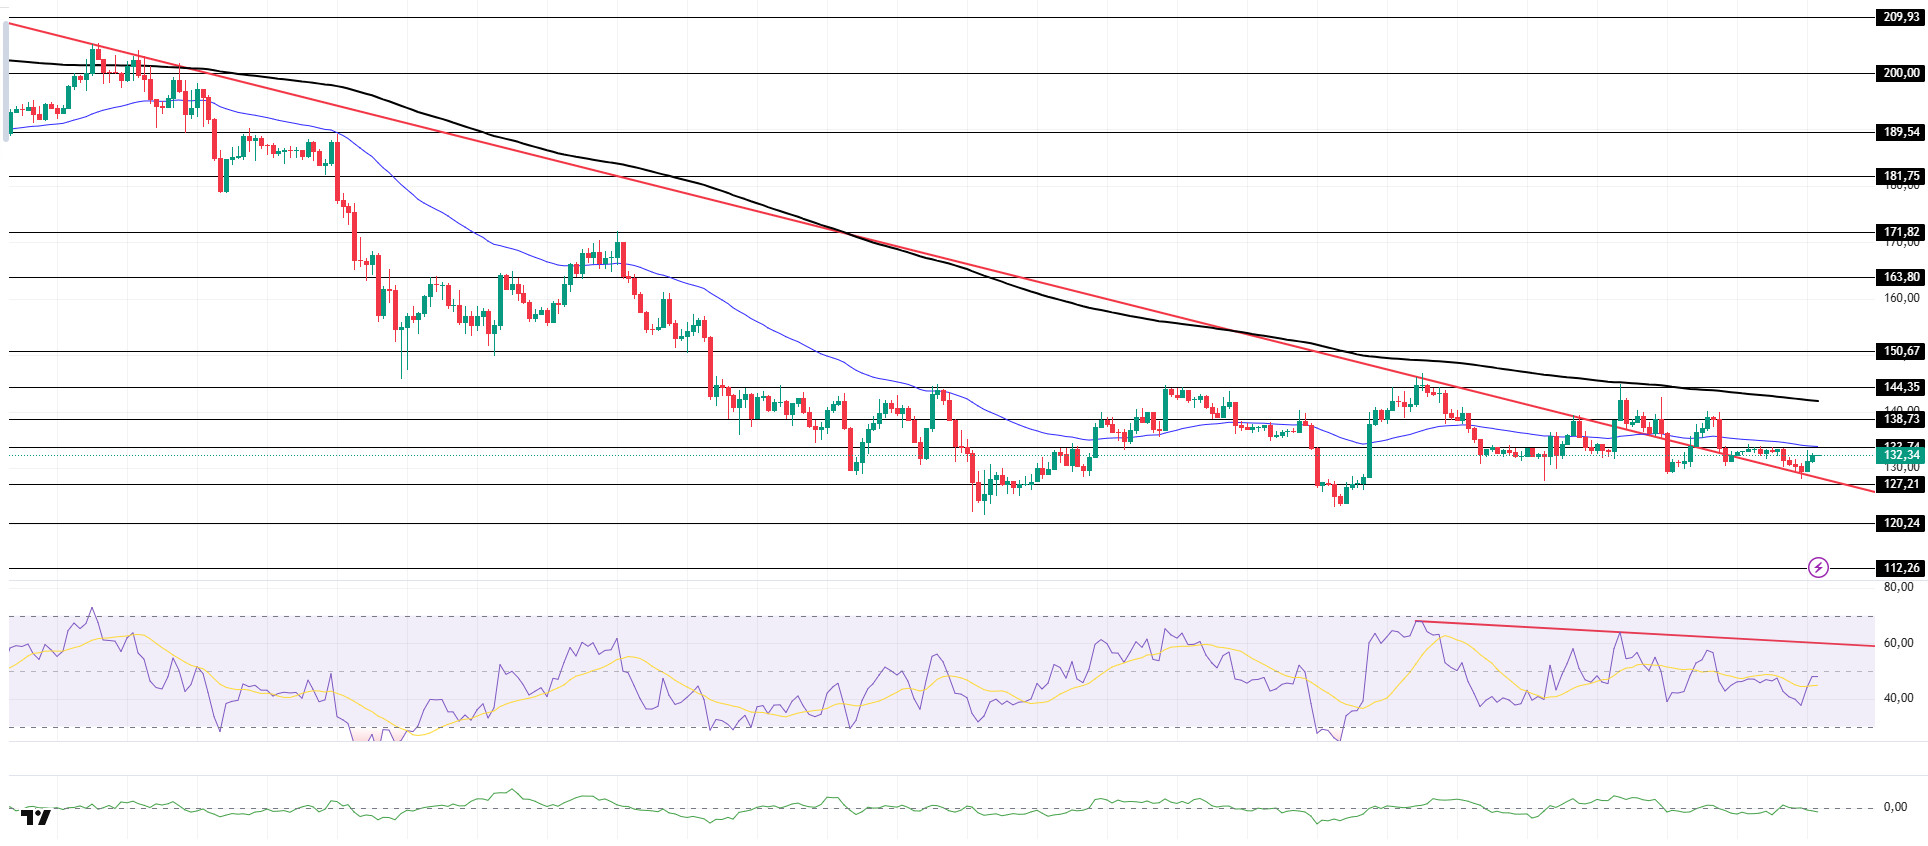
The SOL price continued to move sideways. The asset continued to trade above the downward trend that began on October 6. Currently maintaining its current level, the price is preparing to test the 50 EMA (Blue Line) moving average as resistance. If the candle closes above this moving average, it may test the 200 EMA (Black Line) moving average as resistance. In the event of a pullback, it may retest the descending trend line as support.
On the 4-hour chart, it remained below the 50 EMA (Exponential Moving Average – Blue Line) and 200 EMA (Black Line). This indicates a possible downtrend in the medium term. At the same time, the price being below both moving averages signals a downward trend for the asset in the short term. The Chaikin Money Flow (CMF-20) has moved into negative territory. However, the balance of money inflows and outflows may keep the CMF in negative territory. The Relative Strength Index (RSI-14) rose to near the neutral level of the negative zone. At the same time, it remained below the downward trend line that began on December 3. This signaled selling pressure. If there is an uptrend due to macroeconomic data or positive news related to the Solana ecosystem, the $150.67 level stands out as a strong resistance point. If this level is broken upwards, the uptrend is expected to continue. If there are pullbacks due to developments in the opposite direction or profit-taking, the $120.24 level could be tested. A decline to these support levels could increase buying momentum, presenting a potential opportunity for an upward move.
Supports: 127.21 – 120.24 – 112.26
Resistances: 133.74 – 138.73 – 144.35
DOGE/USDT
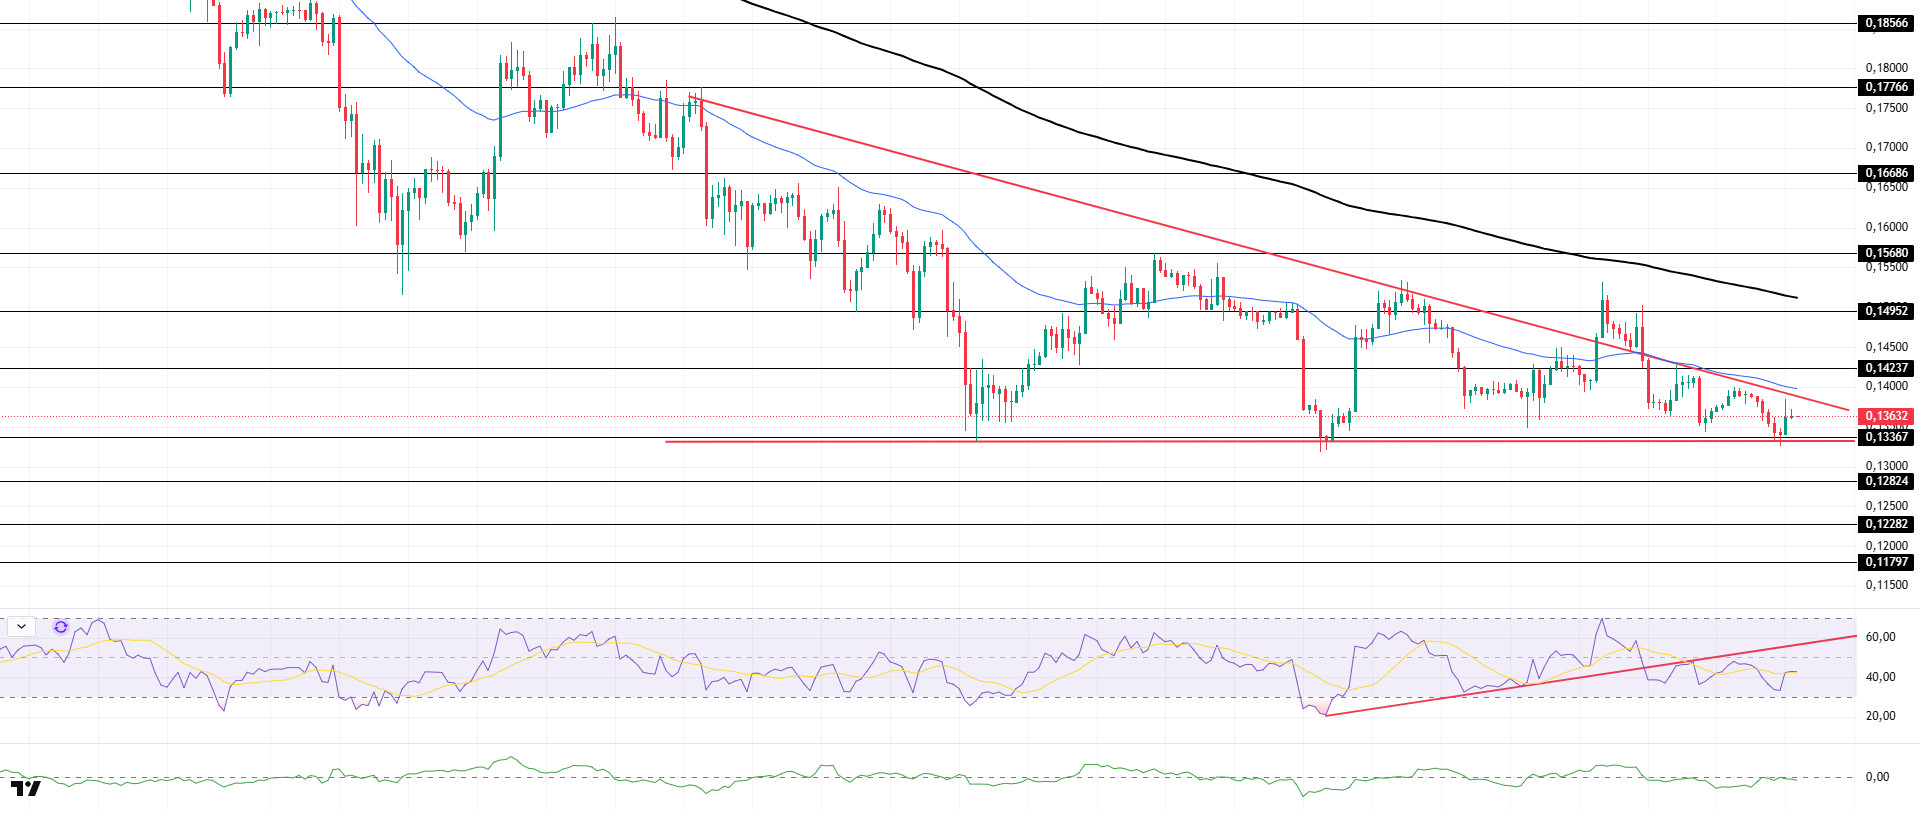
The DOGE price continued its sideways movement. The asset gained slight momentum by finding support at the base level of the descending triangle formation that began on November 13. Currently preparing to test the ceiling level of the descending triangle formation and the 50 EMA (Blue Line) moving average as resistance, the price may test the 200 EMA (Black Line) moving average as resistance if the uptrend continues. If a pullback begins, it may retest the base level of the descending triangle formation.
On the 4-hour chart, the 50 EMA (Exponential Moving Average – Blue Line) remained below the 200 EMA (Black Line). This indicates that the downtrend may continue in the medium term. The price being below both moving averages suggests a downward trend in the short term. The Chaikin Money Flow (CMF-20) is at a neutral level. Additionally, an increase in money inflows could push the CMF into positive territory. The Relative Strength Index (RSI-14) is in the middle of the negative range. It also remained below the upward trend that began on December 1. If it breaks above this level, buying pressure could increase. In the event of an upward movement driven by political developments, macroeconomic data, or positive news flow in the DOGE ecosystem, the $0.15680 level stands out as a strong resistance zone. Conversely, in the event of negative news flow, the $0.13367 level could be triggered. A decline to these levels could increase momentum and initiate a new wave of upward movement.
Supports: 0.13367 – 0.12824 – 0.12282
Resistances: 0.14237 – 0.14952 – 0.15680
LTC/USDT
The price movements in the Litecoin (LTC) / USDT pair closed the previous day with a 3.08% loss in value. At the same time, LTC’s 0.78% pullback compared to Bitcoin shows that Litecoin’s value decreased more than Bitcoin’s. On the futures side, the long/short position ratio opened in the last 24 hours being at 0.9209 reveals that derivative market participants have stronger downward expectations. However, funding rates are positive.
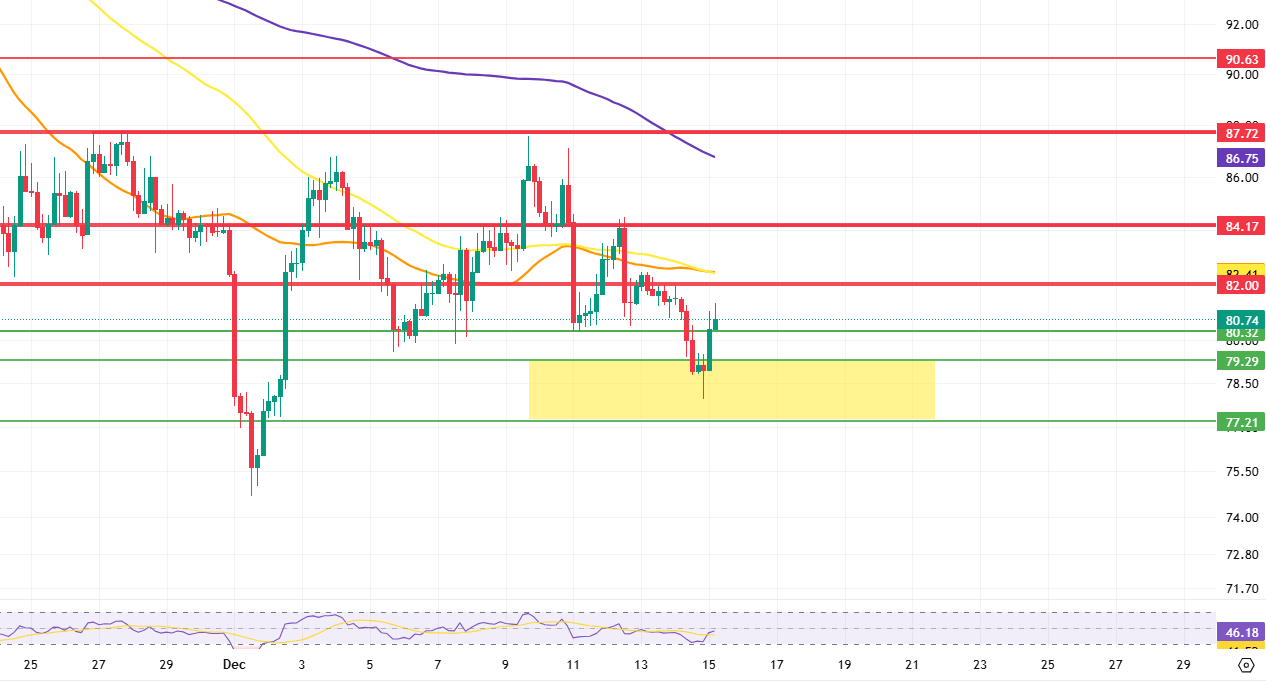
Technically, examining Litecoin’s 4-hour USDT pair shows that the price continues to remain below the 200, 100, and 50-period (purple, yellow, and orange) moving averages. This structure, along with the prevalence of short positions in the derivatives market, supports the main expectation of a downward trend. However, upward reaction movements remain possible. If this scenario materializes, the uptrend is expected to encounter resistance at the 82.00 level first. This level is a horizontal resistance and stands out as a critical zone where selling could intensify. If the 82.00 level is breached, the 84.17 level will be monitored as another important intraday horizontal resistance. Should the upward movement continue and reach the region currently at 87.72, which corresponds to the highest value seen after the major decline, it should not be overlooked that short positions may increase again as the price rises above all moving averages.
If a pullback movement in line with expectations occurs, the first support level to watch is 80.32. If the downward movement continues, the support levels of 79.29 and 77.21 will come into play. The levels of 79.29 and 77.21 are technically strong support areas as they correspond to the Fibonacci 0.618 and 0.786 retracement levels on the 4-hour chart. Although the reaction previously observed from this area (yellow zone) was strong and healthy, it should be noted that if the price retreats back to the same zone in the short term, the reaction may not be as strong as before.
Supports: 80.32 – 79.29 – 77.21
Resistances: 82.00 – 84.17 – 87.72
Legal Notice
The investment information, comments, and recommendations contained herein do not constitute investment advice. Investment advisory services are provided individually by authorized institutions taking into account the risk and return preferences of individuals. The comments and recommendations contained herein are of a general nature. These recommendations may not be suitable for your financial situation and risk and return preferences. Therefore, making an investment decision based solely on the information contained herein may not produce results in line with your expectations.

