
Technical Analysis
BTC/USDT
Today’s phone call between US President Donald Trump and Chinese President Xi Jinping will cover topics such as TikTok, Boeing, rare earth magnets, and Taiwan. Trump stated that the war in Ukraine is proving more difficult to resolve than expected and that Europe stopping its imports of Russian oil could force Moscow to make peace. Meanwhile, the Trump administration has petitioned the Supreme Court to remove Fed Chairman Cook from office. In Michigan, the HB 4087 Bitcoin Reserve Bill passed its second reading, while in Japan, Remixpoint acquired an additional 77 BTC, bringing its total holdings to 1,350 BTC.
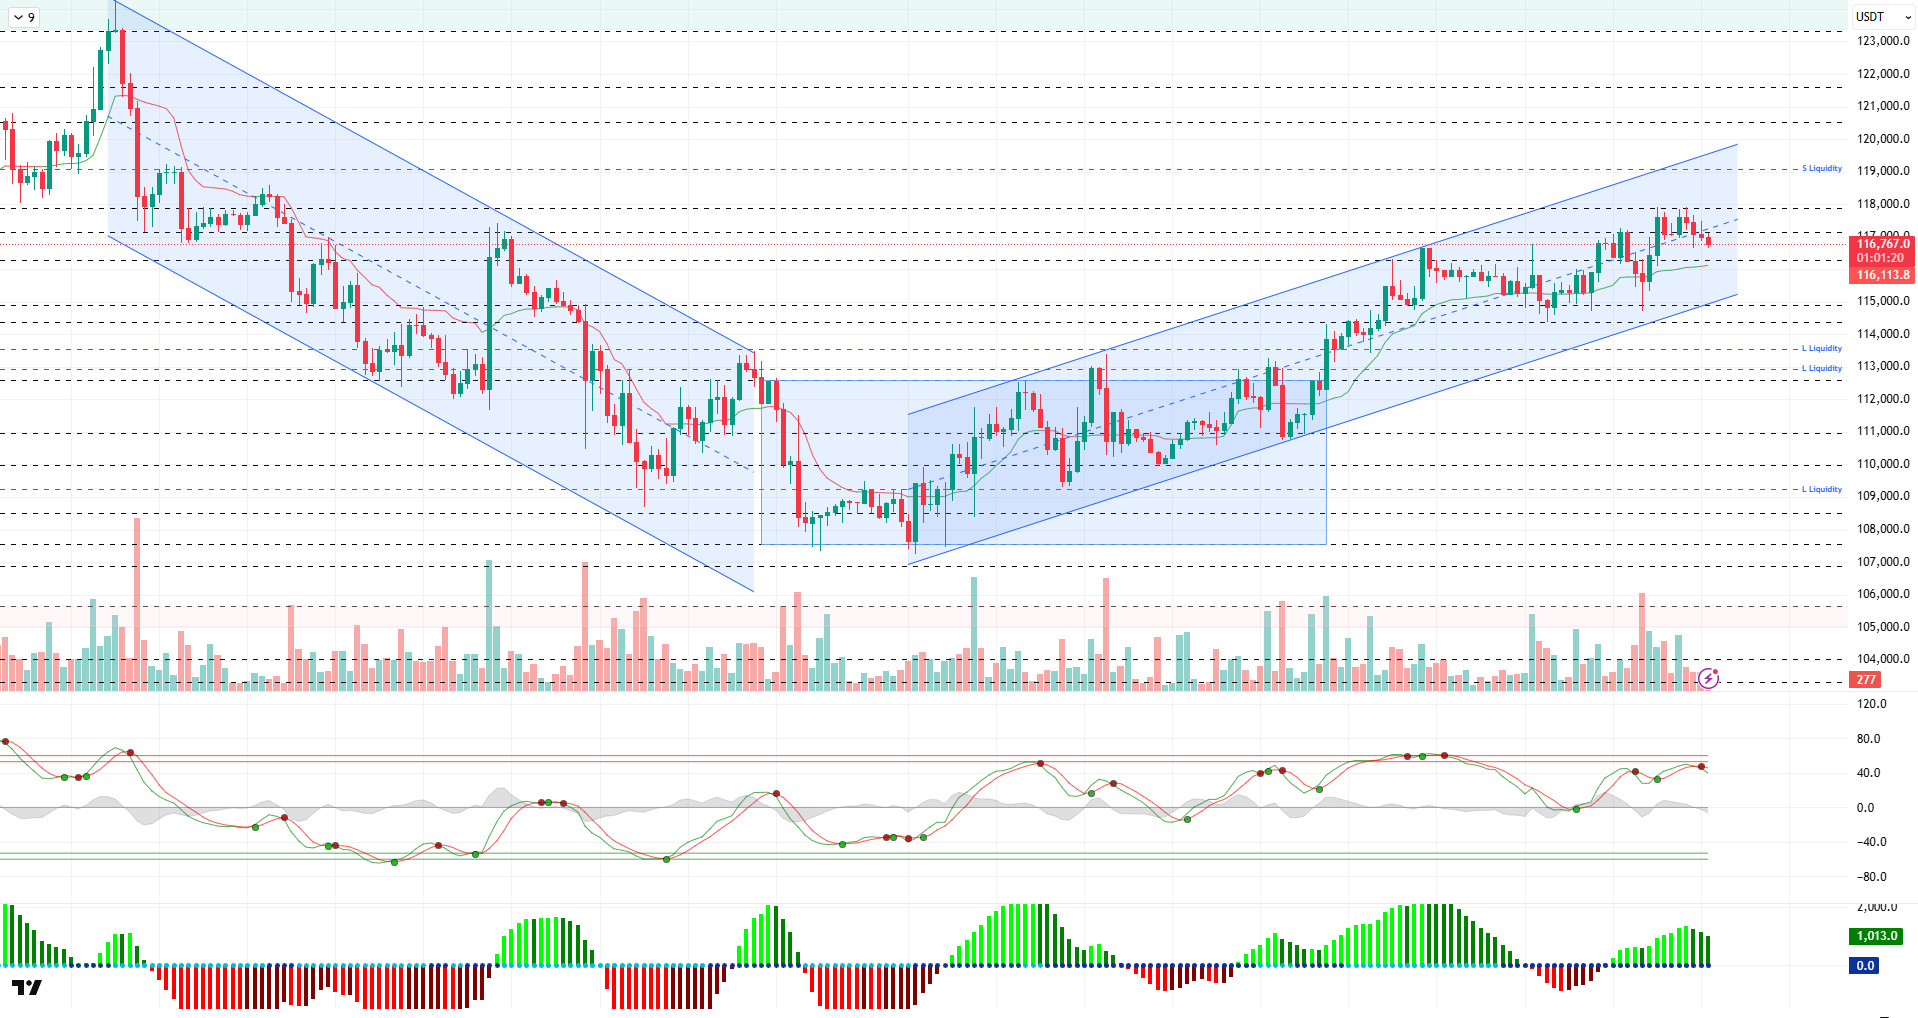
Looking at the technical picture, BTC showed price movements in the 117,000 – 117,800 range in previous analyses, but failed to break above the 117,800 level in its latest attempt. The retreating price lost the 117,000 level and dropped to 116,489. The price then recovered briefly to reach the 117,400 level but failed to hold there. At the time of writing, it is trading at a slightly bearish 116,775 level.
Technical indicators point to a trend reversal, with the Wave Trend oscillator (WT) giving a sell signal in the overbought zone, while the hourly charts are moving close to the oversold zone. The Squeeze Momentum (SM) indicator’s histogram is losing momentum in positive territory. The Kaufman moving average is currently trading below the price at 116,100.
According to liquidity data, short-term sell positions were liquidated in the 117,000 – 117,800 band. The next sell level gained intensity in the 118,500 – 119,000 band. The buy level experienced some liquidation at the 116,500 range due to yesterday’s spike movement. The broader buy level continues to accumulate at the 113,000 – 114,000 range.
In summary, the market environment maintains its positive outlook, supported by fundamental developments. Despite the limited response to the interest rate cut, the Fed’s projections continue to support optimism. As we approach October, Bitcoin maintaining its upward stability and the price heading back towards ATH levels may not be a surprise for the market. On the technical side, the price completed its consolidation within the horizontal band it had been in for a long time and tested the 117,800 level accompanied by a minor upward channel. While sell-side transactions were liquidated in liquidity data, liquidations also occurred in the buy tiers. For the sustainability of the rise, it is critical for the price to maintain its current upward channel. Closings above the 117,250 level are particularly important for the continuation of the trend. If momentum is gained above this level, the 118,500 – 119,000 liquidity zone could become the target, followed by the 120,000 level. On the other hand, in the event of potential selling pressure, 116,100 is the support level, while 115,000 is the reference point to be monitored. If the price falls below this level, the 113,500 – 113,000 band will be monitored as a strong support and liquidity area.
Supports: 116,100 – 115,000 – 114,000
Resistances: 117,250 – 118,000 – 119,000
ETH/USDT
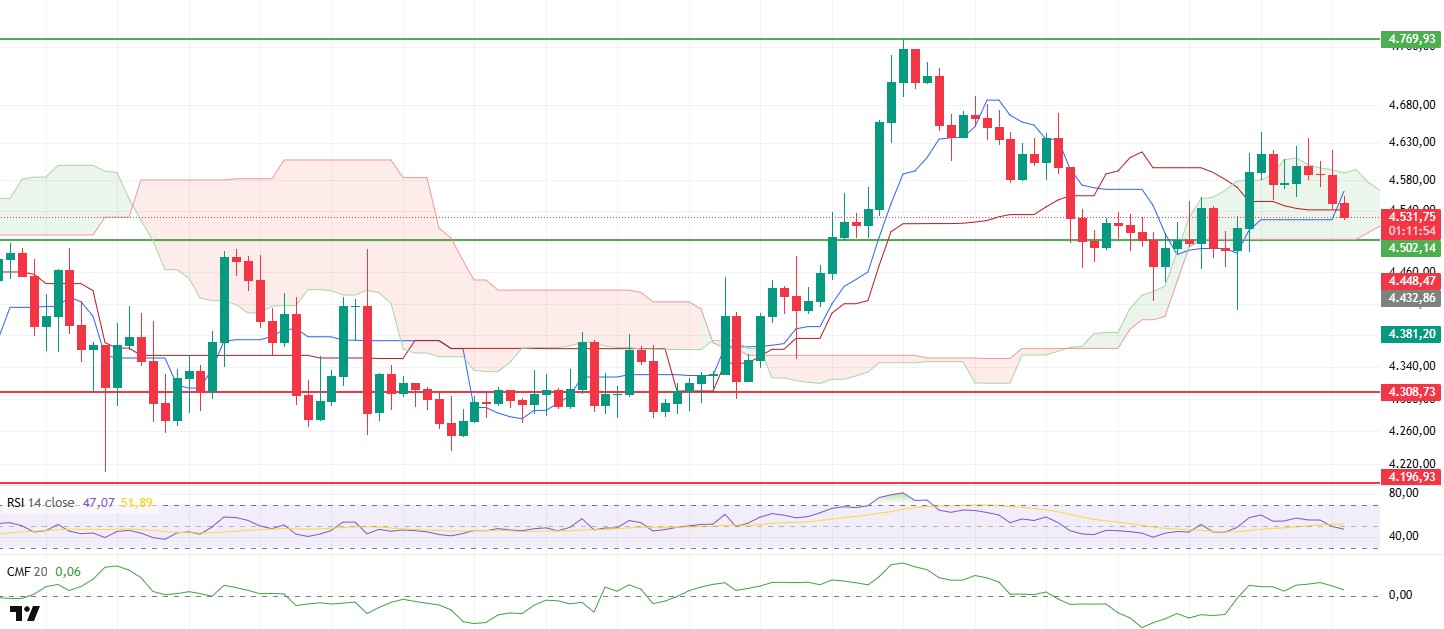
The ETH price attempted to break above the upper band of the Kumo cloud several times yesterday evening. However, due to the selling pressure, it failed to sustain itself at this level. In the morning hours, the price retreated to around $4,530. This situation shows that the upper band of the cloud is still acting as a strong resistance point and that buyers are struggling to achieve a sustained breakout.
Technical indicators are producing mixed signals regarding price movement. Although the Chaikin Money Flow (CMF) indicator has experienced a slight decline, it remains in positive territory. This outlook reveals that liquidity inflows into the market are still dominant and that buyer appetite has not completely disappeared. In contrast, the Relative Strength Index (RSI) indicator has fallen below both the underlying moving average and the 50 level, producing a short-term weakness signal. This points to a pullback in momentum.
In the Ichimoku indicator, although the price has not broken through the Kumo cloud, the Tenkan line crossing above the Kijun line stands out as a short-term positive signal. This crossover suggests that buyers are still in control, but higher volume is needed for the uptrend to strengthen.
In the overall outlook, maintaining the $4,500 level is critically important. As long as the price remains above this level, a convergence towards the upper band of the Kumo cloud, around $4,590, can be expected. Conversely, if the $4,500 level is lost, selling pressure may increase and the price may retreat towards the $4,440 band.
Top of Form
Below the Form
Support levels: 4,500 – 4,308 – 4,196
Resistance levels: 4,769 – 4,857 – 5,002
XRP/USDT
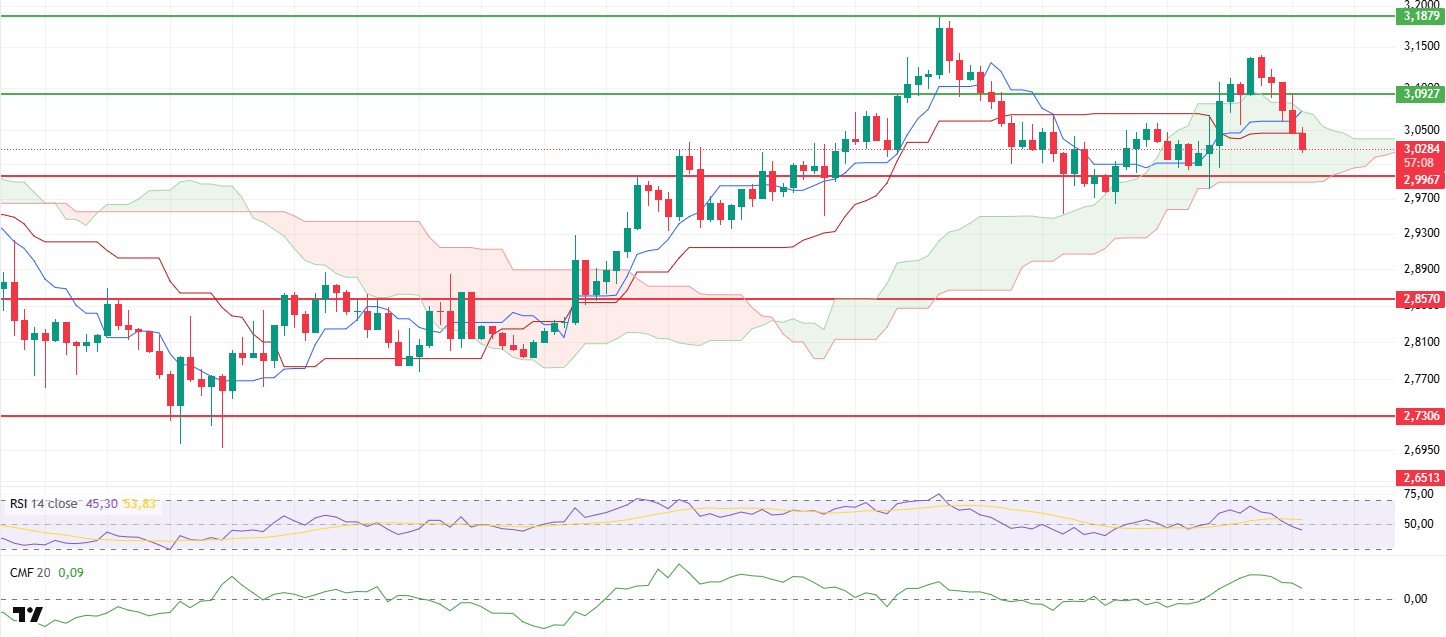
The XRP price reversed its direction downward following a sharp sell-off after reaching $3.14 yesterday. Breaking through the $3.09 support level during the day, the price quickly fell to $3.02. This movement indicates that critical support levels have weakened and that selling pressure remains effective in the short term.
Upon examining the indicators, the Chaikin Money Flow (CMF) failed to sustain its positive momentum and experienced a pullback. However, its continued presence in positive territory indicates that money inflows into the market have not completely stopped and does not confirm a trend reversal. In contrast, the Relative Strength Index (RSI) indicator remains below both its base average and the 50 level, signaling continued short-term weakness.
In the Ichimoku indicator, it is noteworthy that the price has retreated back to the Kumo cloud boundaries and has also fallen below the Tenkan and Kijun levels. This outlook shows that XRP remains in a decision zone and is still searching for direction.
In this context, the most critical level during the day stands out as $2.99. If the price maintains this level, a rebound towards the $3.09 level and upward attempts may come to the fore. However, breaking the $2.99 level could increase selling pressure and pave the way for steeper declines.
Support levels: 2.9967 – 2.8570 – 2.7306
Resistance levels: 3.0927 – 3.1879 – 3.3058
SOL/USDT
The Solana Foundation and Cathie Wood’s Ark Invest participated in a $300 million investment for the new SOL treasury, Solmate.
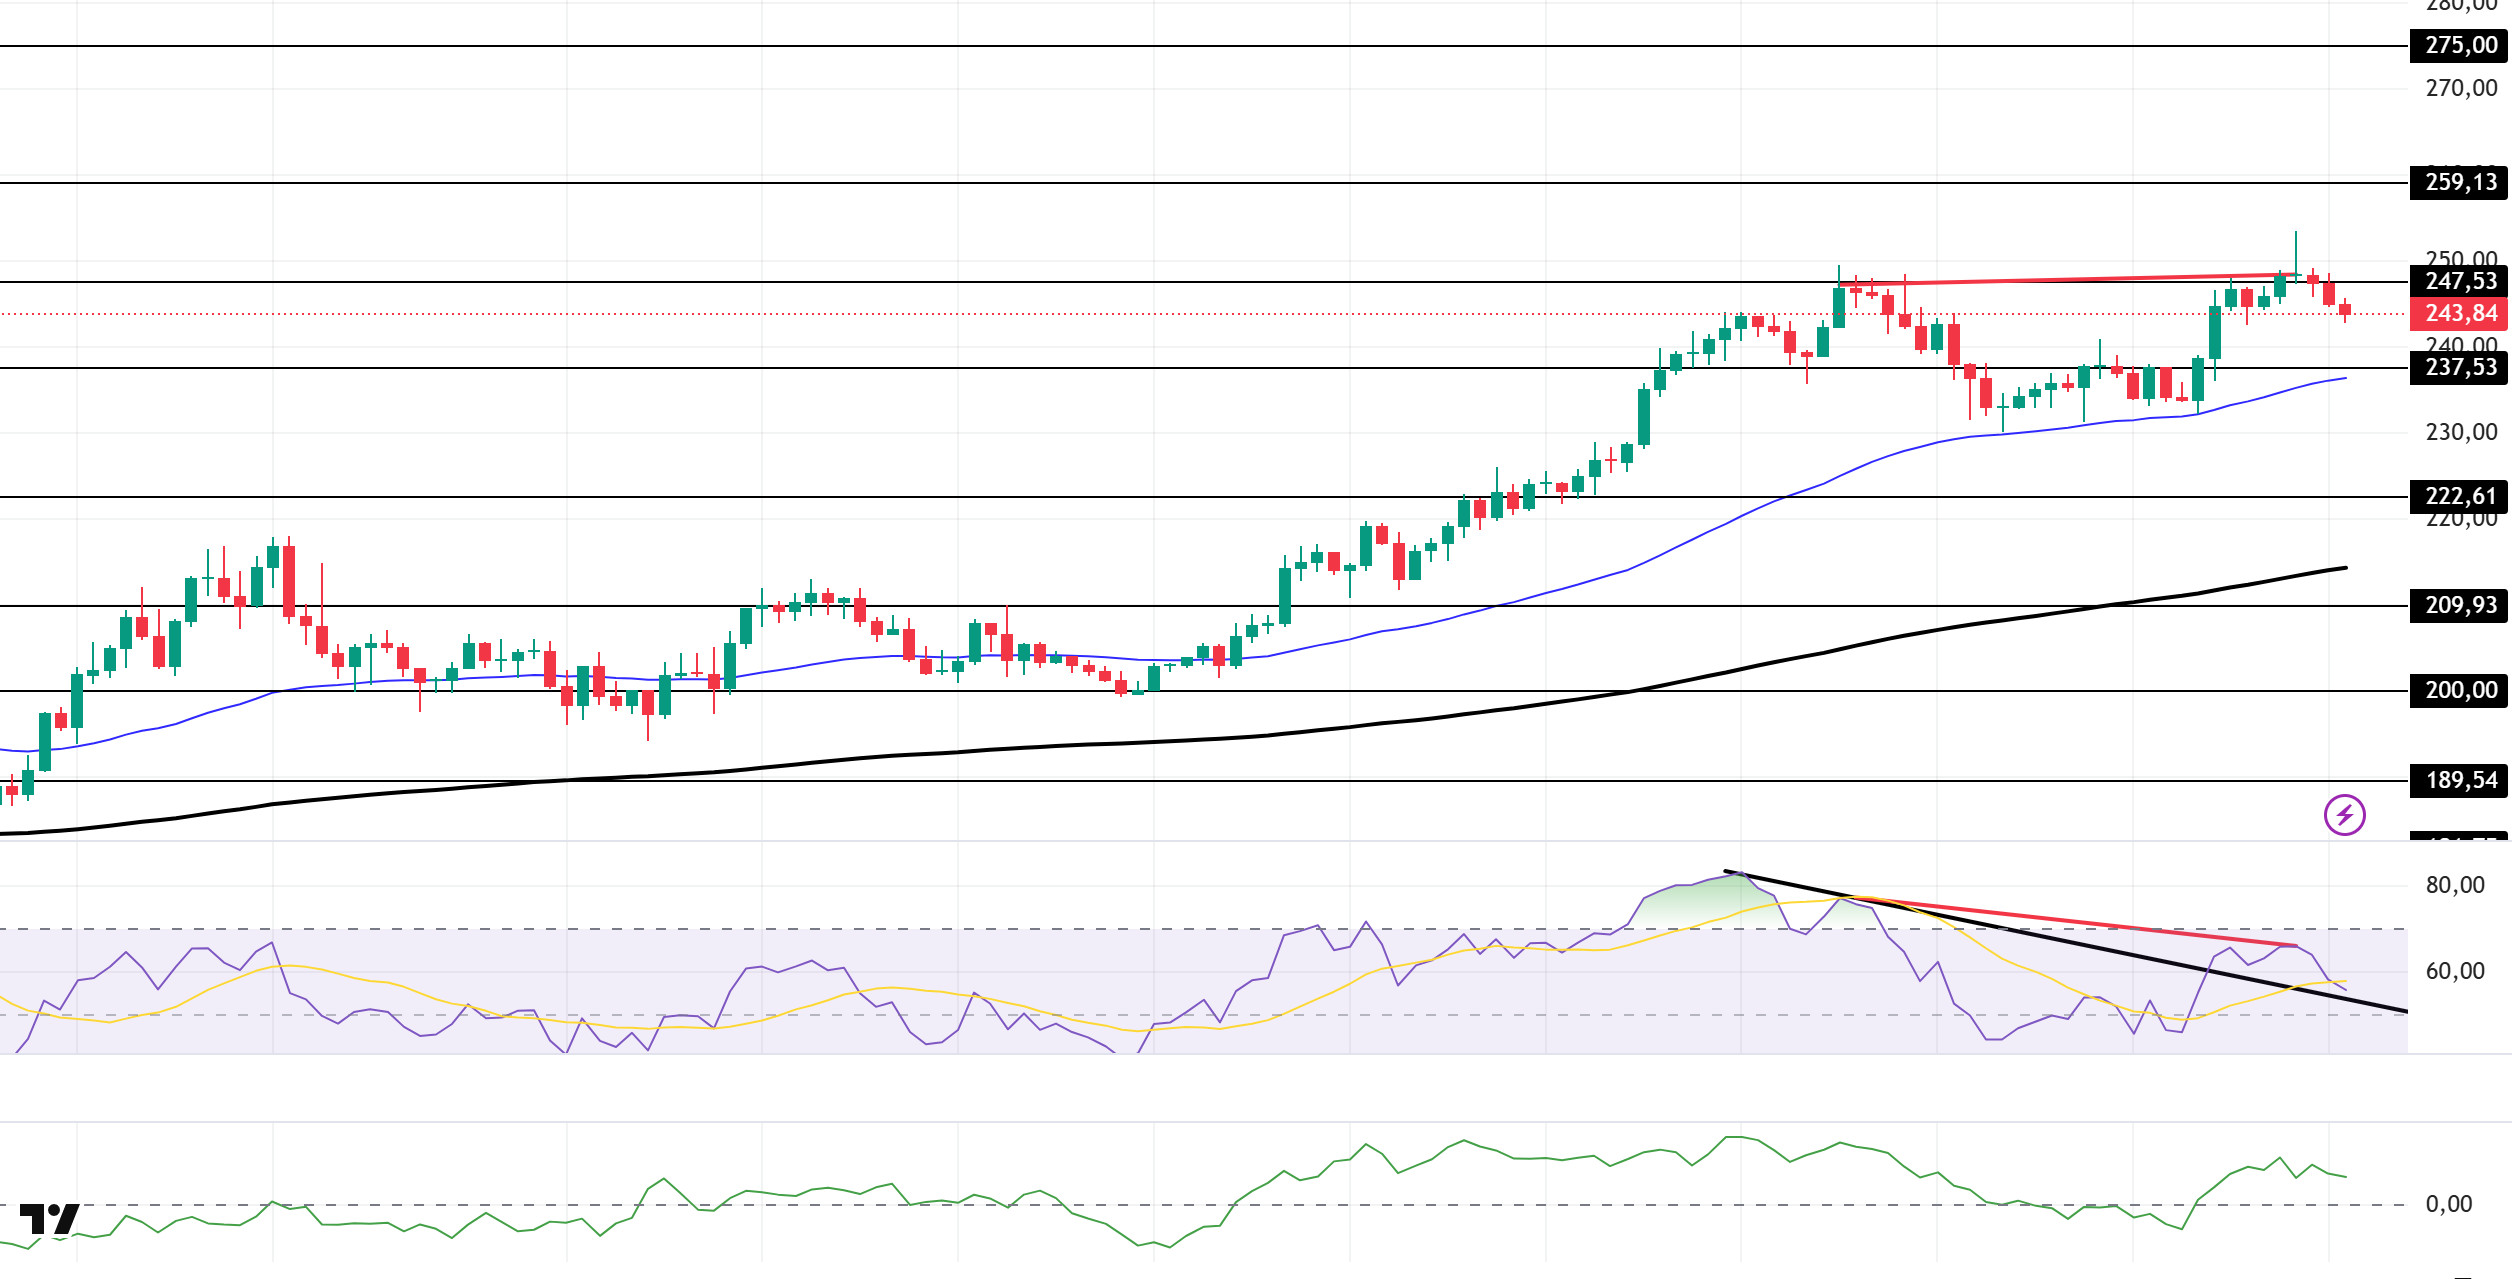
The SOL price continued its sideways movement. The asset remains above the strong resistance level of $237.53. Currently testing the strong resistance level of $247.53, the price could target the $259.13 level if it closes above this level. In case of a pullback, the $237.53 level could be monitored.
On the 4-hour chart, it continues to trade above the 50 EMA (Exponential Moving Average – Blue Line) and 200 EMA (Black Line). This indicates that the medium-term upward trend may continue. At the same time, the price being above both moving averages shows us that the market is trending upward in the short term. The large difference between the two moving averages indicates that the asset may be in a sideways or downward trend. Chaikin Money Flow (CMF-20) remained in positive territory. However, a decrease in cash inflows could push the CMF into negative territory. The Relative Strength Index (RSI-14) maintains its position in positive territory. It also remained above the downtrend that began on September 12, signaling buying pressure. However, negative divergence could cause pullbacks. If there is an uptrend due to macroeconomic data or positive news related to the Solana ecosystem, the $259.13 level stands out as a strong resistance point. If this level is broken upwards, the rise is expected to continue. If pullbacks occur due to developments in the opposite direction or profit-taking, the $237.53 level may be tested. If there is a decline to these support levels, an increase in buying momentum may present a potential upside opportunity.
Supports: 237.53 – 222.61 – 209.93
Resistances: 247.53 – 259.13 – 275.00
DOGE/USDT
The first Dogecoin ETF exceeded expectations, trading approximately $6 million in the first hour on Wall Street.
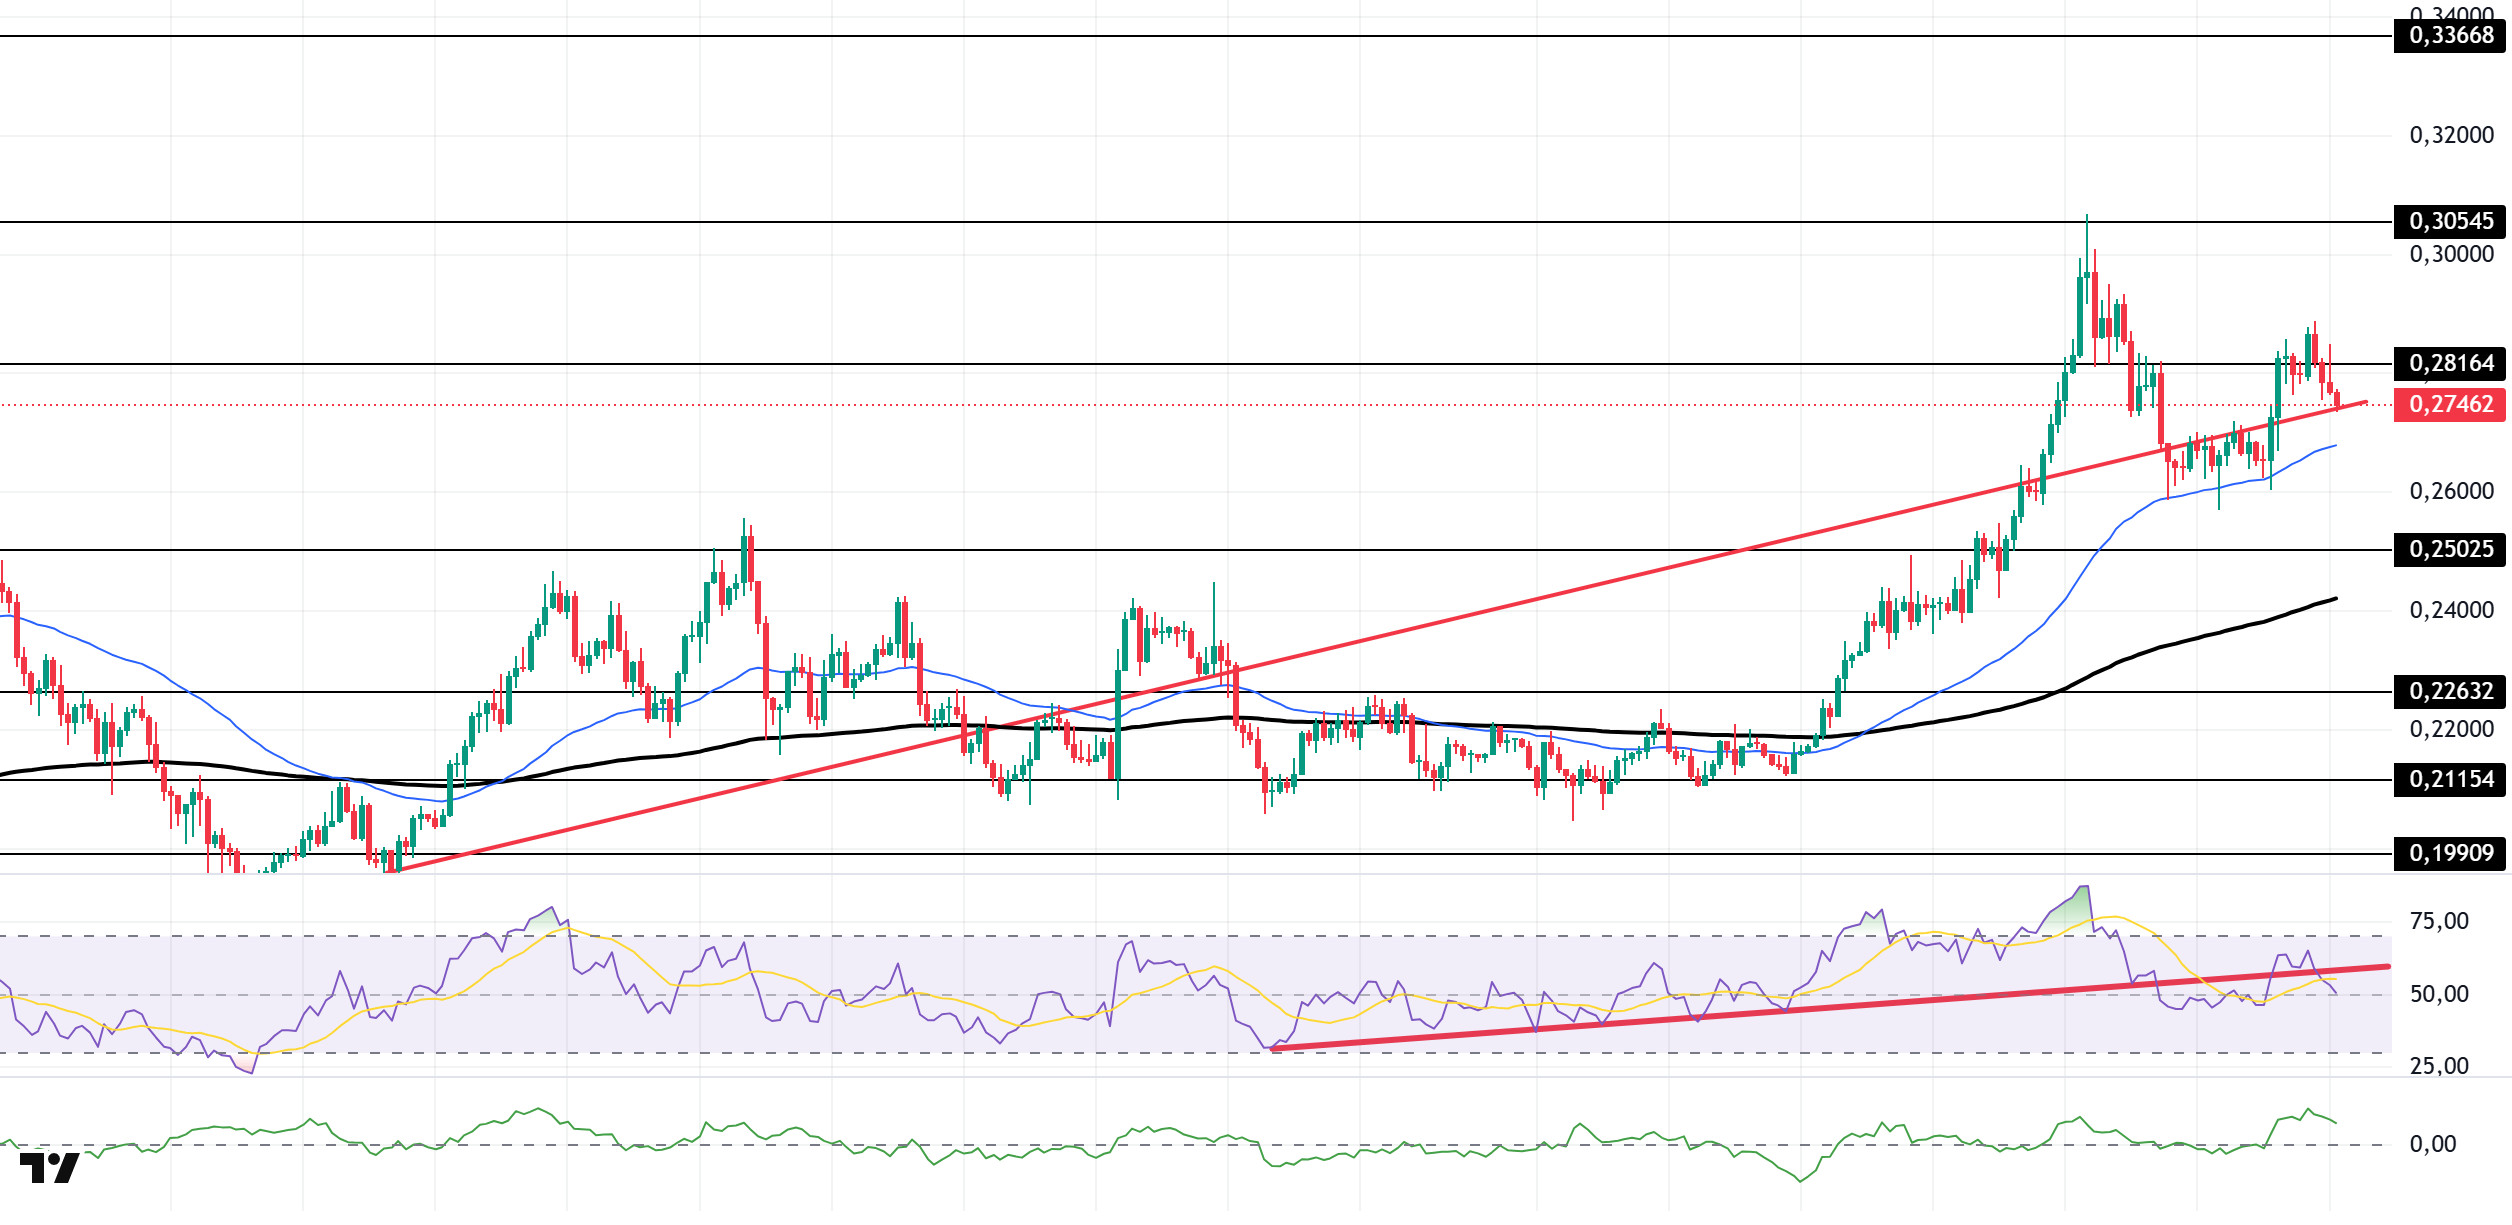
The DOGE price continued to move sideways. The asset tested the strong resistance level of $0.28164 but experienced a pullback. As of now, the price, which is testing the rising trend that began on August 3 as support, may test the $0.25025 level in candle closes below this level. In the event of a possible rise, $0.30545 should be monitored as resistance.
On the 4-hour chart, the 50 EMA (Exponential Moving Average – Blue Line) remained above the 200 EMA (Black Line). This indicates that the medium-term upward trend continues. The price being above both moving averages shows that the short-term upward trend is strong. A large difference between the two moving averages may cause the asset to pull back or move sideways. Chaikin Money Flow (CMF-20) continues to be in positive territory. Additionally, a decrease in money inflows could push CMF into negative territory. The Relative Strength Index (RSI-14) continues to be in positive territory. However, it moved to the lower region of the upward trend that began on August 26 and currently indicates selling pressure. In the event of potential increases due to political developments, macroeconomic data, or positive news flow in the DOGE ecosystem, the $0.30545 level stands out as a strong resistance zone. Conversely, in the event of negative news flow, the $0.25025 level could be triggered. A decline to these levels could increase momentum and potentially initiate a new upward wave.
Supports: $0.25025 – $0.22632 – $0.21154
Resistances: 0.28164 – 0.30545 – 0.33668
AVAX/USDT
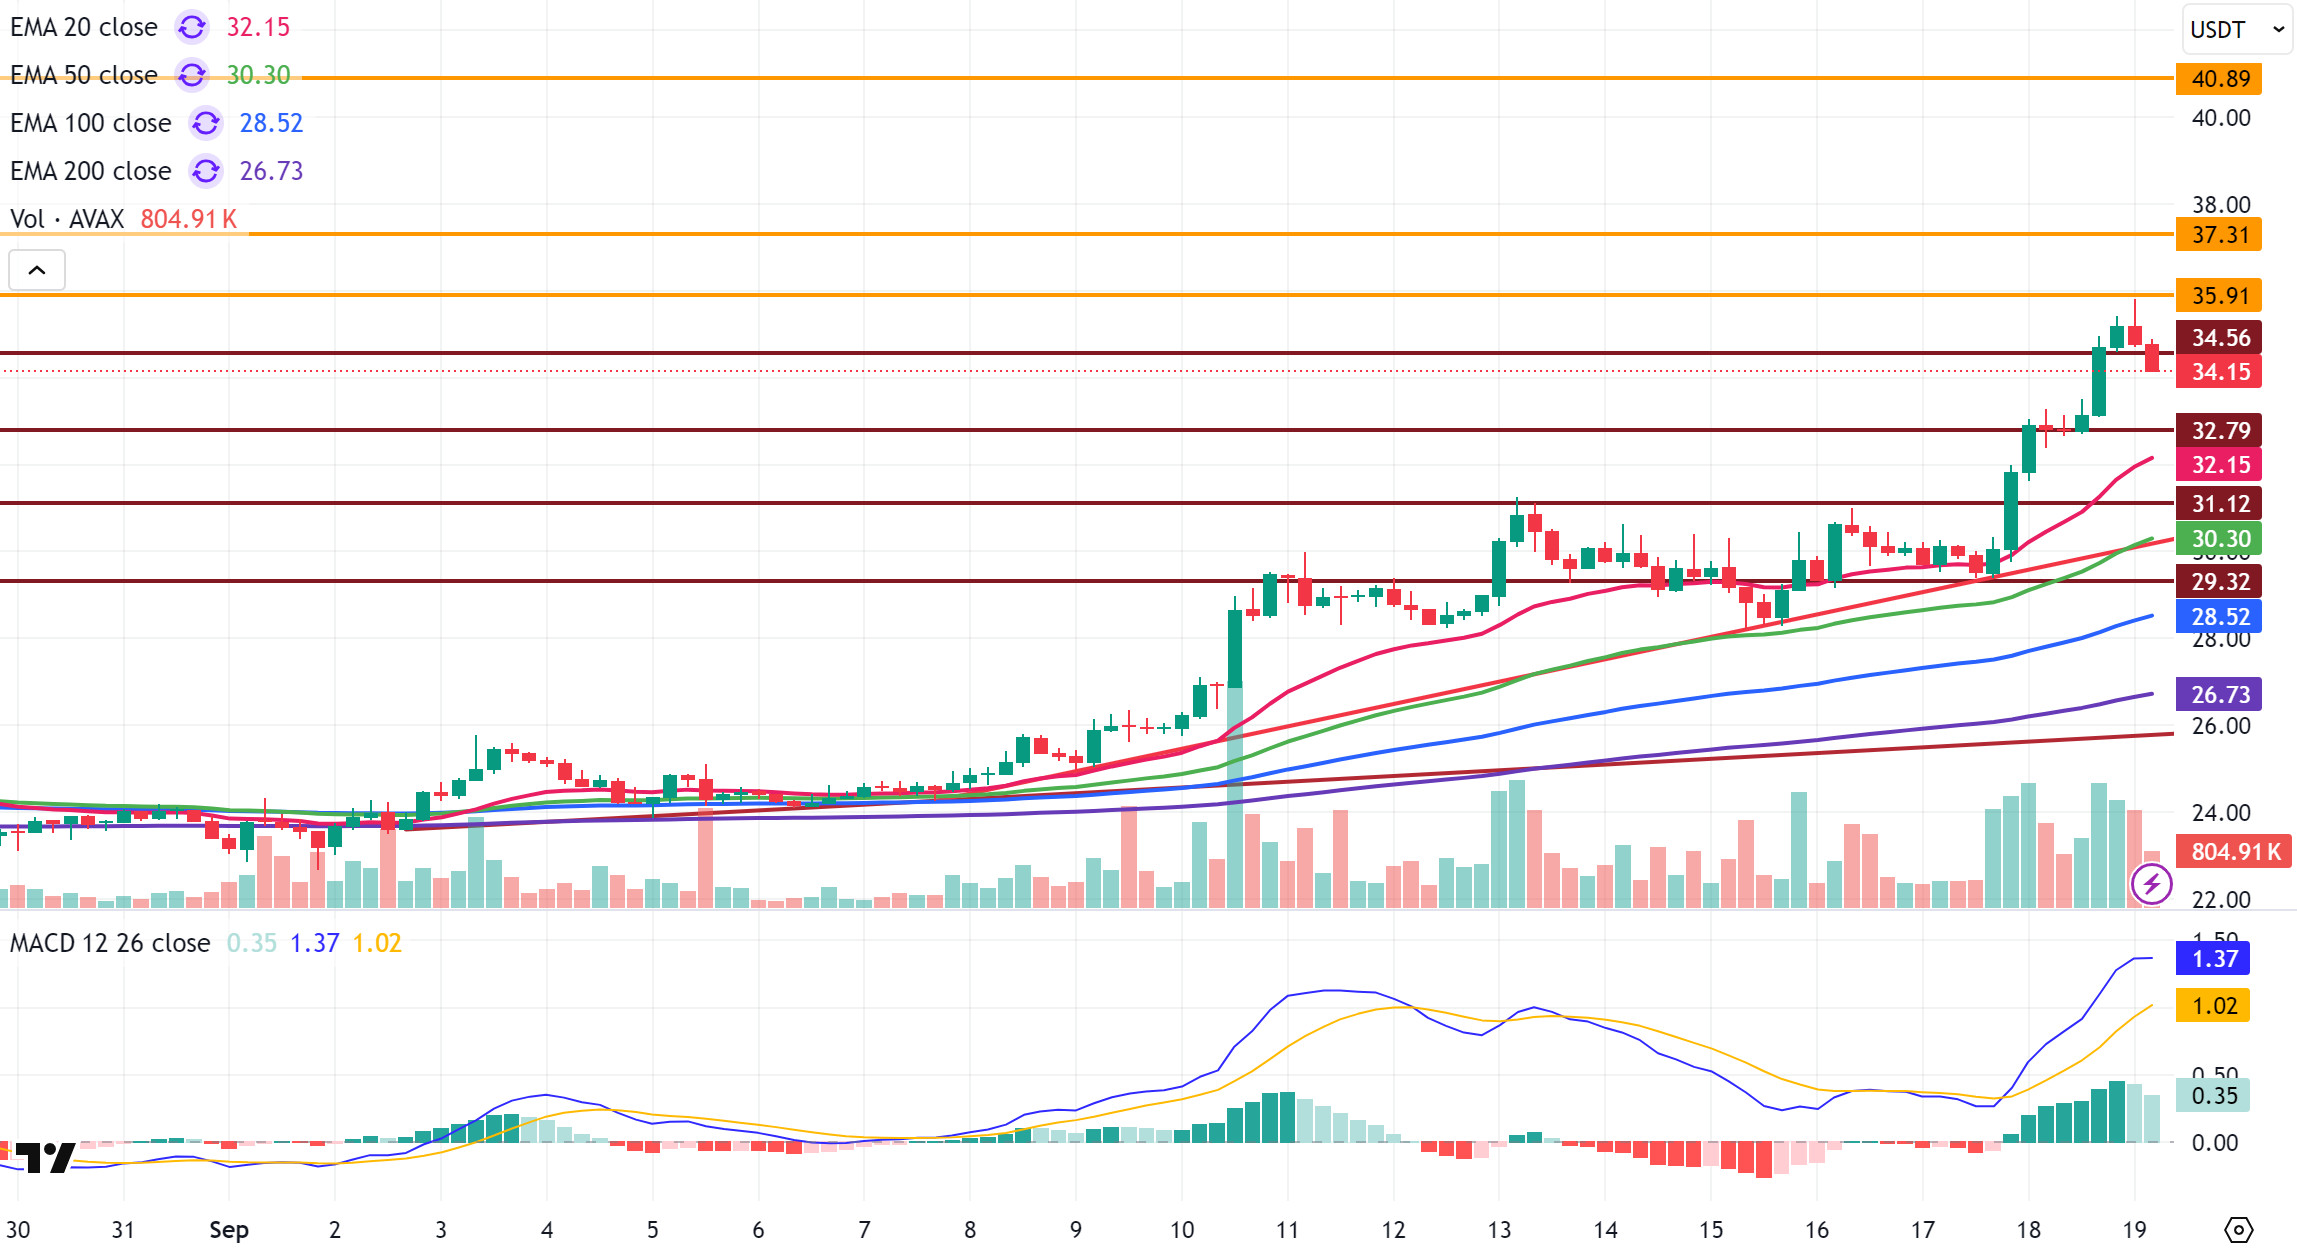
AVAX started yesterday at $31.83 and closed at $35.19, a 10.6% increase. During this rise, AVAX, which had been trading within a horizontal band ahead of the Fed’s interest rate decision and Powell’s speech, gained strong buying appetite due to ETF expectations and the total amount of locked assets in decentralized finance (DeFi) applications in the Avalanche ecosystem exceeding $2 billion. This growth, the most notable development of the new week, supported pricing by increasing institutional and individual interest in the ecosystem. However, AVAX started today with a decline and fell to $34.20.
On the 4-hour chart, during AVAX’s rise, the Moving Average Convergence/Divergence (MACD) line crossed above the signal line, creating positive momentum. However, it experienced a loss in value during the day with sales coming in at resistance levels. Currently, while the MACD maintains a positive outlook, the price moving away from critical Exponential Moving Average (EMA) levels indicates that the uptrend still retains its strength.
In the short term, the $34.56 level stands out as critical support for AVAX. If it manages to stay above this level, it could retest the $35.91 and $37.31 resistance levels. In the opposite scenario, increased selling pressure could bring the $32.79 and then the $31.12 support levels into play. Overall, AVAX continues to remain strong thanks to positive news flow from the ecosystem, and with strong buying and momentum support, a gradual rise to the $40 level could be seen.
(EMA20: Pink Line, EMA50: Green Line, EMA100: Blue Line, EMA200: Purple Line)
Supports: 34.56 – 35.31 – 40.89
Resistances: 35.91 – 37.31 – 34.56
BNB/USDT
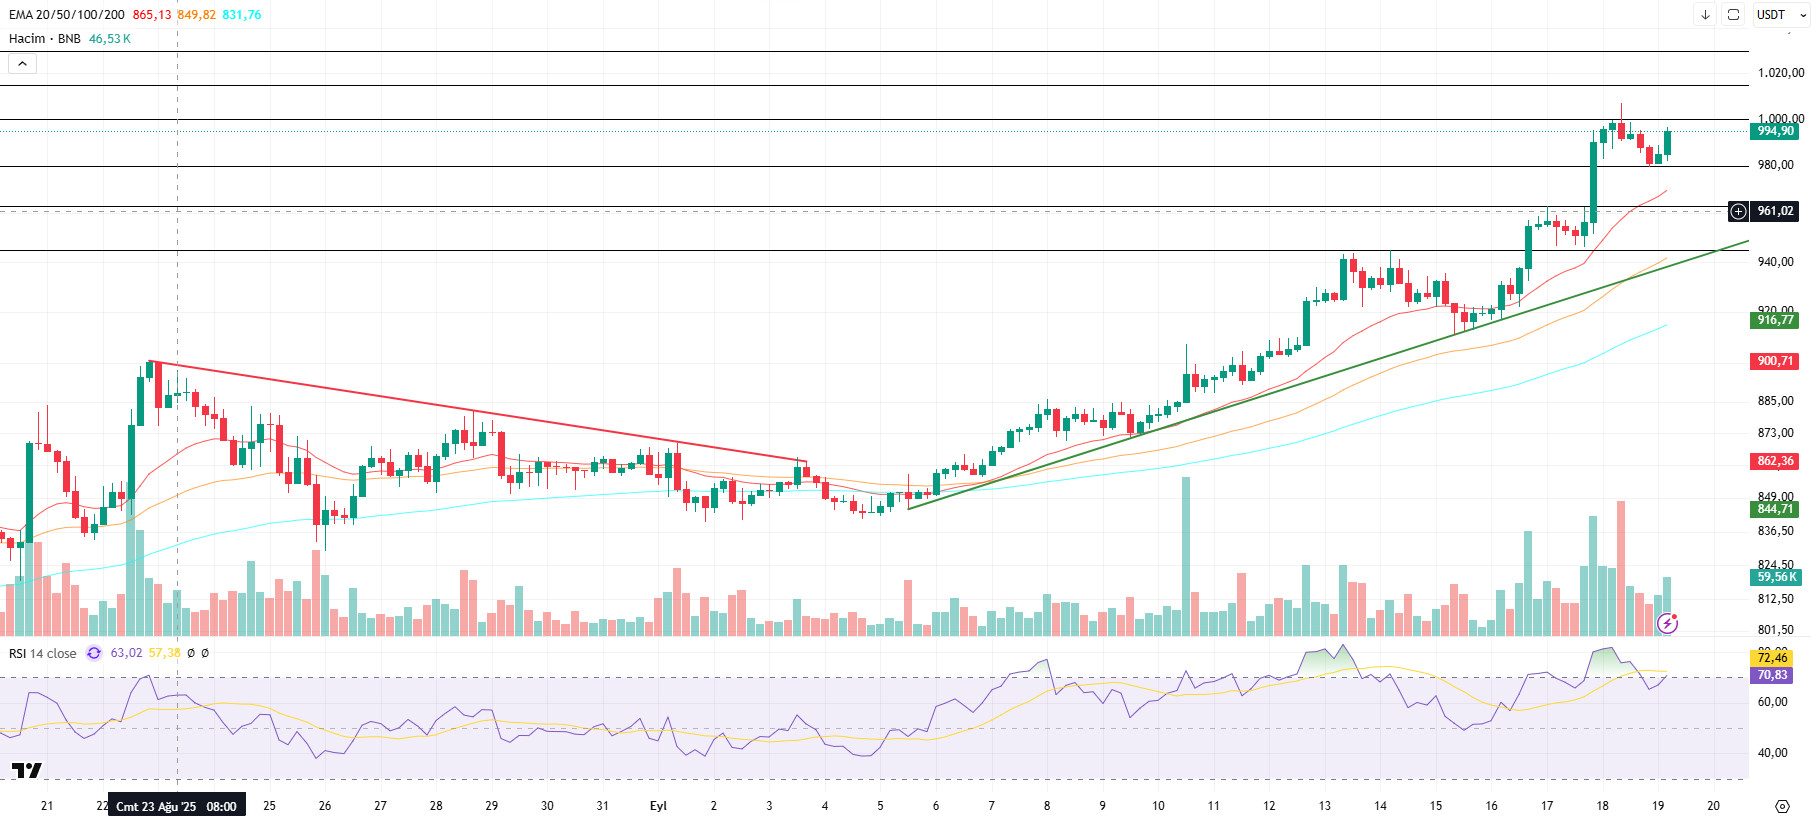
In the middle of the week, BNB showed a strong rise, also influenced by developments on the fundamental side, and recorded new historical highs. In this context, BNB, which exceeded the psychological level of $1,000, recorded an All Time High (ATH) of $1,006. Although a price correction down to $980 was seen from this level, it maintains its positive momentum based on the newly opened candle.
From a technical perspective, BNB/USDT entered an uptrend with strong support at the $840 level and accelerated its positive momentum with the contribution of fundamental developments, setting a new ATH level of $1,006.
Technical indicators for BNB/USDT, currently trading in the $980–1,000 range, show that the recent increase in trading volume has contributed to the upward momentum. Furthermore, the Relative Strength Index (RSI) rose above the 70 level with the recent increases; however, it turned downward with the price correction. Nevertheless, the RSI is still hovering near these levels, indicating that there is limited room for correction in the asset.
Based on the current technical picture, if buying appetite is maintained, BNB is expected to retest the psychological resistance level of $1,000 in the first stage. If this level is broken, the price could potentially move towards the $1,015 and $1,030 levels. On the other hand, if selling pressure increases, the price is likely to fall back to the $980 support level. If this level is broken downwards, the price is expected to retreat to the $965 and $945 levels, respectively.
Supports: 980 – 965 – 945
Resistances: 1000 – 1015 – 1030
Legal Notice
The investment information, comments, and recommendations contained herein do not constitute investment advice. Investment advisory services are provided individually by authorized institutions taking into account the risk and return preferences of individuals. The comments and recommendations contained herein are of a general nature. These recommendations may not be suitable for your financial situation and risk and return preferences. Therefore, making an investment decision based solely on the information contained herein may not produce results in line with your expectations.

