
Technical Analysis
BTC/USDT
The US Federal Reserve (Fed) cut its policy rate by 25 basis points to a range of 4–4.25% at its September meeting. The decision was taken by a vote of 11 to 1, with Stephen Miran, the new member appointed by Trump, voting in favor of a 50 bp cut. According to projections, members anticipate a total of 50 more basis points of cuts by year-end. In his post-decision remarks, Powell emphasized that inflation risks are tilted upward, while employment risks are tilted downward. He also addressed discussions about the Fed’s independence, stating, “I don’t believe we are losing our independence.”
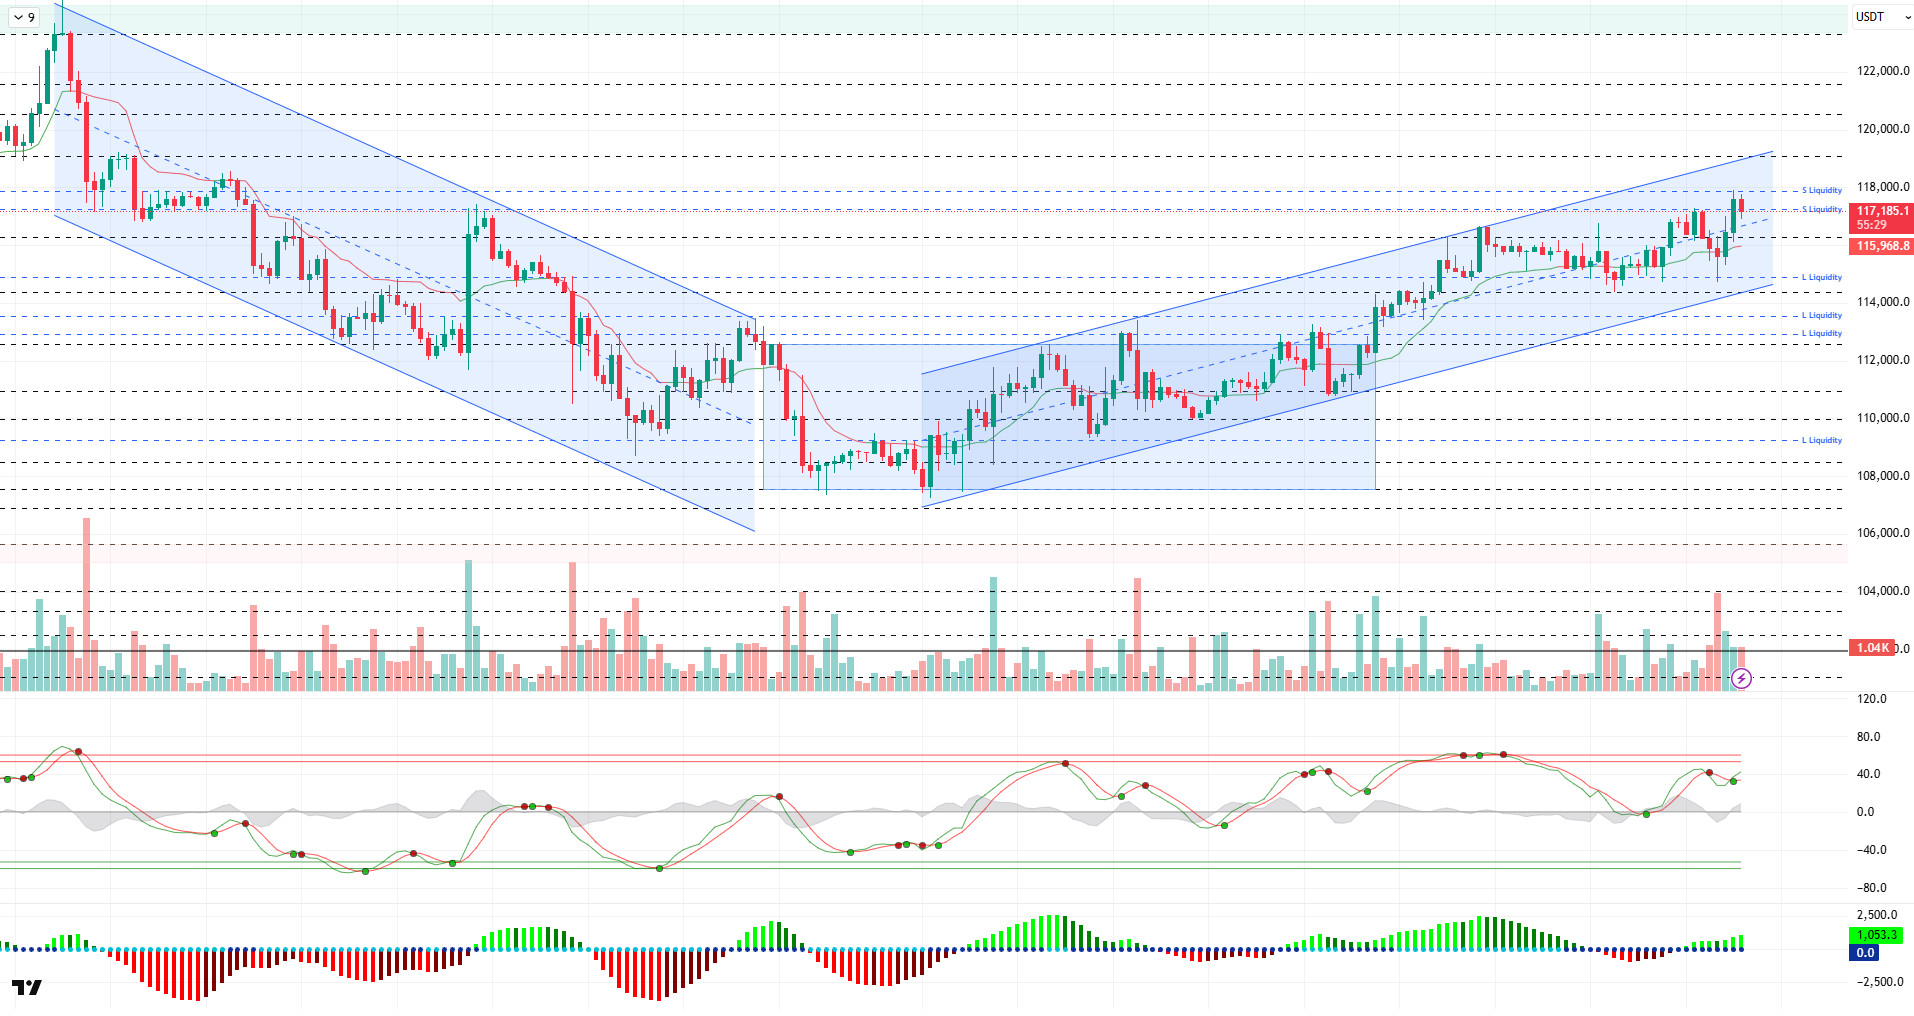
Looking at the technical picture, BTC traded at 115,500 – 116,000 with high volatility before and at the time of the decision. The price spiked to 114,800 levels with the meeting, then recovered, and BTC, which exceeded the 116,000 level, reached 117,800 levels. At the time of writing, it continues to trade at the slightly bearish 117,000 level.
Technical indicators, with the Wave Trend oscillator (WT) giving a sell signal in the overbought zone, reversed direction upward after a short-term trend reversal, giving a buy signal again. The Squeeze Momentum (SM) indicator’s histogram gained momentum in positive territory. The Kaufman moving average is currently trading below the price at the 115,950 level.
According to liquidity data, short-term sell positions were liquidated in the 117,000 – 117,800 band. The next sell level gained intensity in the 118,500 – 119,000 band. The buy level was liquidated at the 115,000 band with yesterday’s spike movement. The broader buy level continues to accumulate at the 113,000 – 114,000 band.
In summary, the market environment maintains a positive outlook, supported by fundamental developments. Despite the limited response to the interest rate cut, the Fed’s projections continue to support optimism. As we approach October, Bitcoin maintains its upward stability, and a return to ATH levels may not be surprising for the market. On the technical side, the price completed its consolidation within the horizontal band it had been in for a long time and tested the 117,800 level accompanied by a minor upward channel. While sell-side transactions were liquidated in liquidity data, liquidations also occurred in the buy-side tiers. For the sustainability of the rise, it is critical for the price to maintain its current upward channel. Closings above the 117,000 level are particularly important for the continuation of the trend. If momentum is gained above this level, the 118,500 – 119,000 liquidity zone could become the target, followed by the 120,000 level. On the other hand, in the event of potential selling pressure, 116,100 is the support level, while 115,000 is the reference point to be monitored. If the price falls below this level, the 113,500 – 113,000 band will be monitored as a strong support and liquidity area.
Supports: 116,100 – 115,000 – 114,000
Resistances: 117,250 – 118,000 – 119,000
ETH/USDT
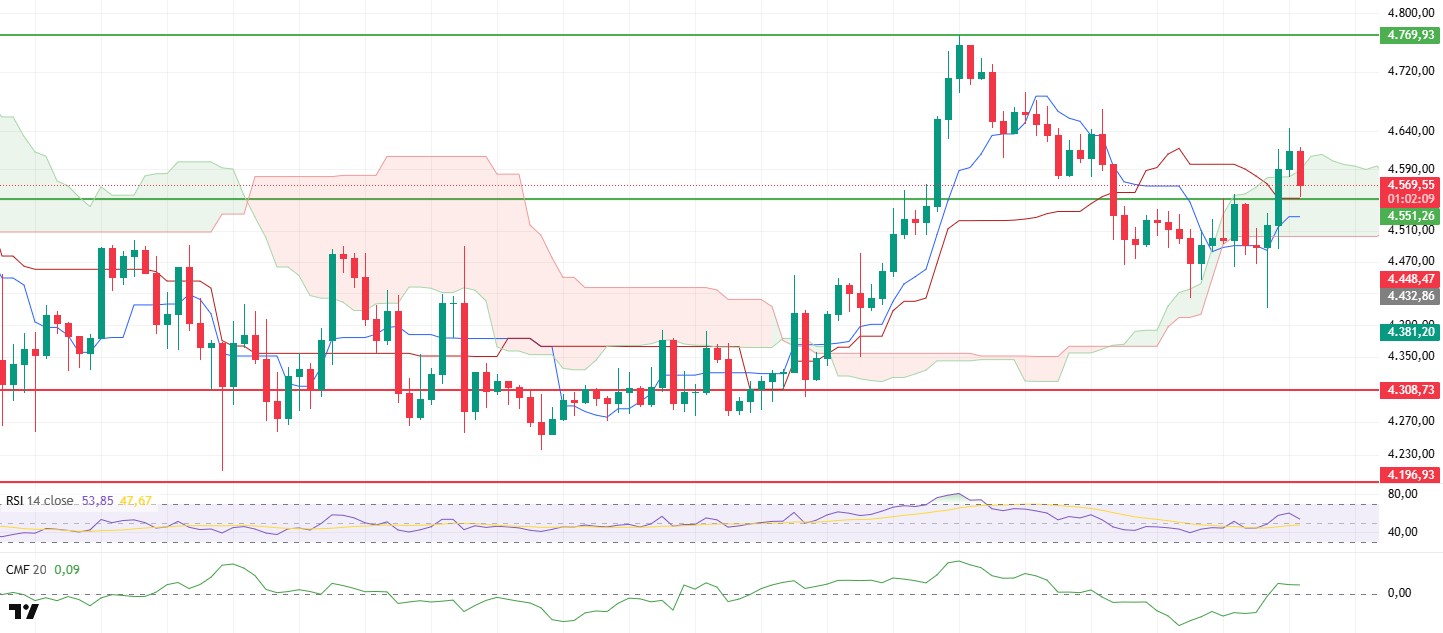
The US Federal Reserve cut interest rates by 25 basis points at its meeting yesterday evening. Although there was a short-term pullback in the markets during Chairman Powell’s remarks following the decision, risk appetite recovered after this move, and upward movements came to the fore. The ETH price was also affected by this process, breaking through the critical $4,551 resistance level and rising to $4,643 in the morning hours. However, increased selling pressure in this region caused the price to retreat to the $4,570 level. This movement shows that resistance levels remain strong but that the market has not lost its appetite for buying.
When examining technical indicators, the Chaikin Money Flow (CMF) indicator’s transition into positive territory reveals a significant increase in liquidity inflows into the market. This development increases the likelihood that the price will continue its upward movement, drawing strength from support zones. However, the indicator’s transition into a new positive zone stands out as a signal that should be closely monitored in terms of the trend’s sustainability.
On the Ichimoku indicator side, the price rising above the kumo cloud level and regaining the Tenkan line confirms that the main trend remains strongly positive. Persistence above the kumo cloud indicates that the bullish scenario remains intact from a technical perspective and that the current pullbacks are corrective in nature. In particular, regaining the Tenkan level can be considered a critical development in terms of short-term momentum.
Under this outlook, the $4,551 level stands out as an important support. The price holding above this level indicates that buyers are in control and that a new wave of growth could begin during the day. In an upward scenario, the $4,769 level should be monitored as a critical resistance point. Breaking above this level could accelerate the trend, leading to higher prices for ETH.
Conversely, in a potential downward scenario, closes below $4,551 could bring momentum loss, leading to renewed selling pressure. In this case, a pullback towards the $4,500–4,440 range in the short term would be on the table. In conclusion, the increase in overall risk appetite in the markets following the Fed’s interest rate cut supports the ETH price, while technical indicators also confirm the short-term positive outlook.
Support levels: 4.551 – 4.308 – 4.196
Resistance levels: 4,769 – 4,857 – 5,002
XRP/USDT
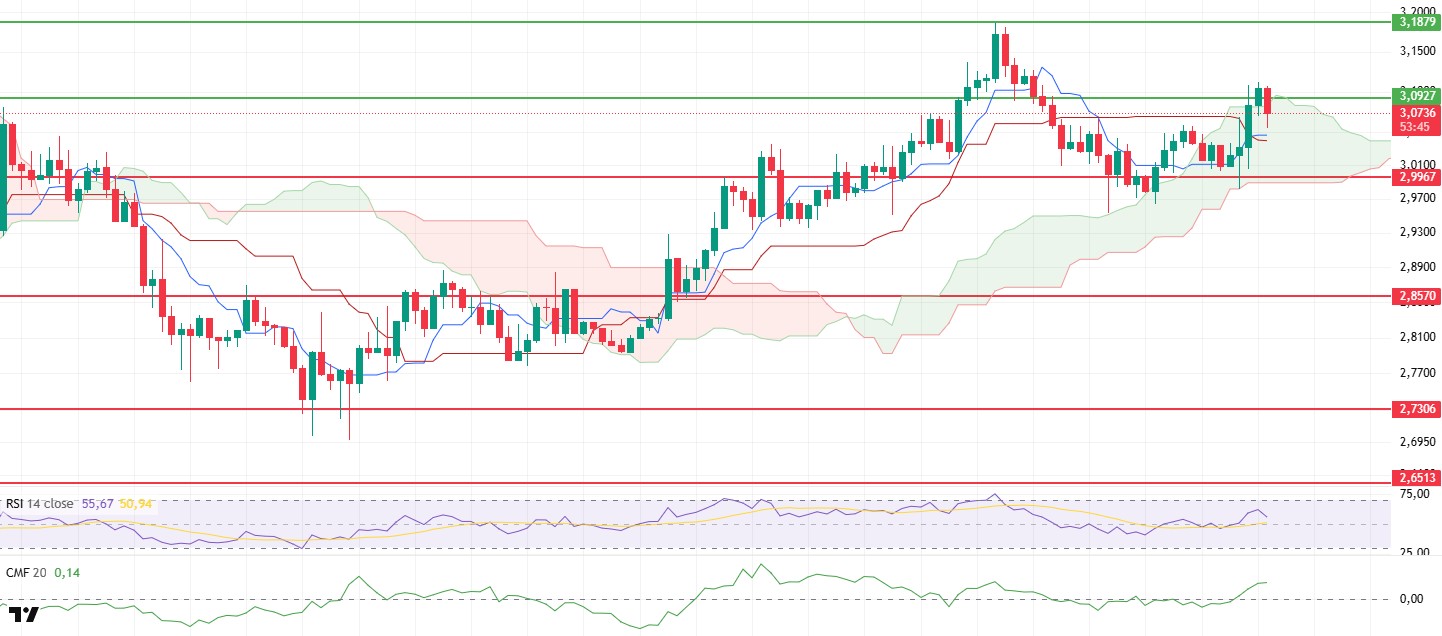
The US Federal Reserve’s decision to cut interest rates and Powell’s statements increased volatility in the crypto markets, and the XRP price was also affected by these developments. After the decision, the price rose above the $3.09 resistance level to $3.11, but failed to maintain its position in this region and soon retreated to $3.07. This movement shows that the upward potential remains intact, but strong selling pressure continues in the resistance zone.
On the liquidity side, the Chaikin Money Flow (CMF) indicator gaining momentum and rising in positive territory reveals a strong liquidity inflow into the market. This indicates that buyers remain dominant in the short term and are supporting the price’s upward movement. In particular, the indicator’s rapid rise confirms that buying appetite continues to increase.
In the Ichimoku indicator, short-term positive signals are noteworthy. The Tenkan line crossing above the Kijun indicates that buyers are gaining strength, and if the price breaks above the kumo cloud, an acceleration in the upward trend can be expected. A breakout from the cloud region would signal the formation of a stronger trend in the market.
In the overall outlook, the $3.09 level stands out as a critical resistance point. If this level is breached, the upward movement is likely to accelerate and continue towards the $3.18 target. On the other hand, the $2.99 level is the main support level in terms of downside risks. A breach of this level could lead to increased selling pressure, causing the price to experience deeper pullbacks.
Support levels: 2.9967 – 2.8570 – 2.7306
Resistance levels: 3.0927 – 3.1879 – 3.3058
SOL/USDT
Defidevcorp purchased an additional 62,745 SOL (15 million dollars), increasing its total holdings to 2.1 million SOL (499 million dollars).
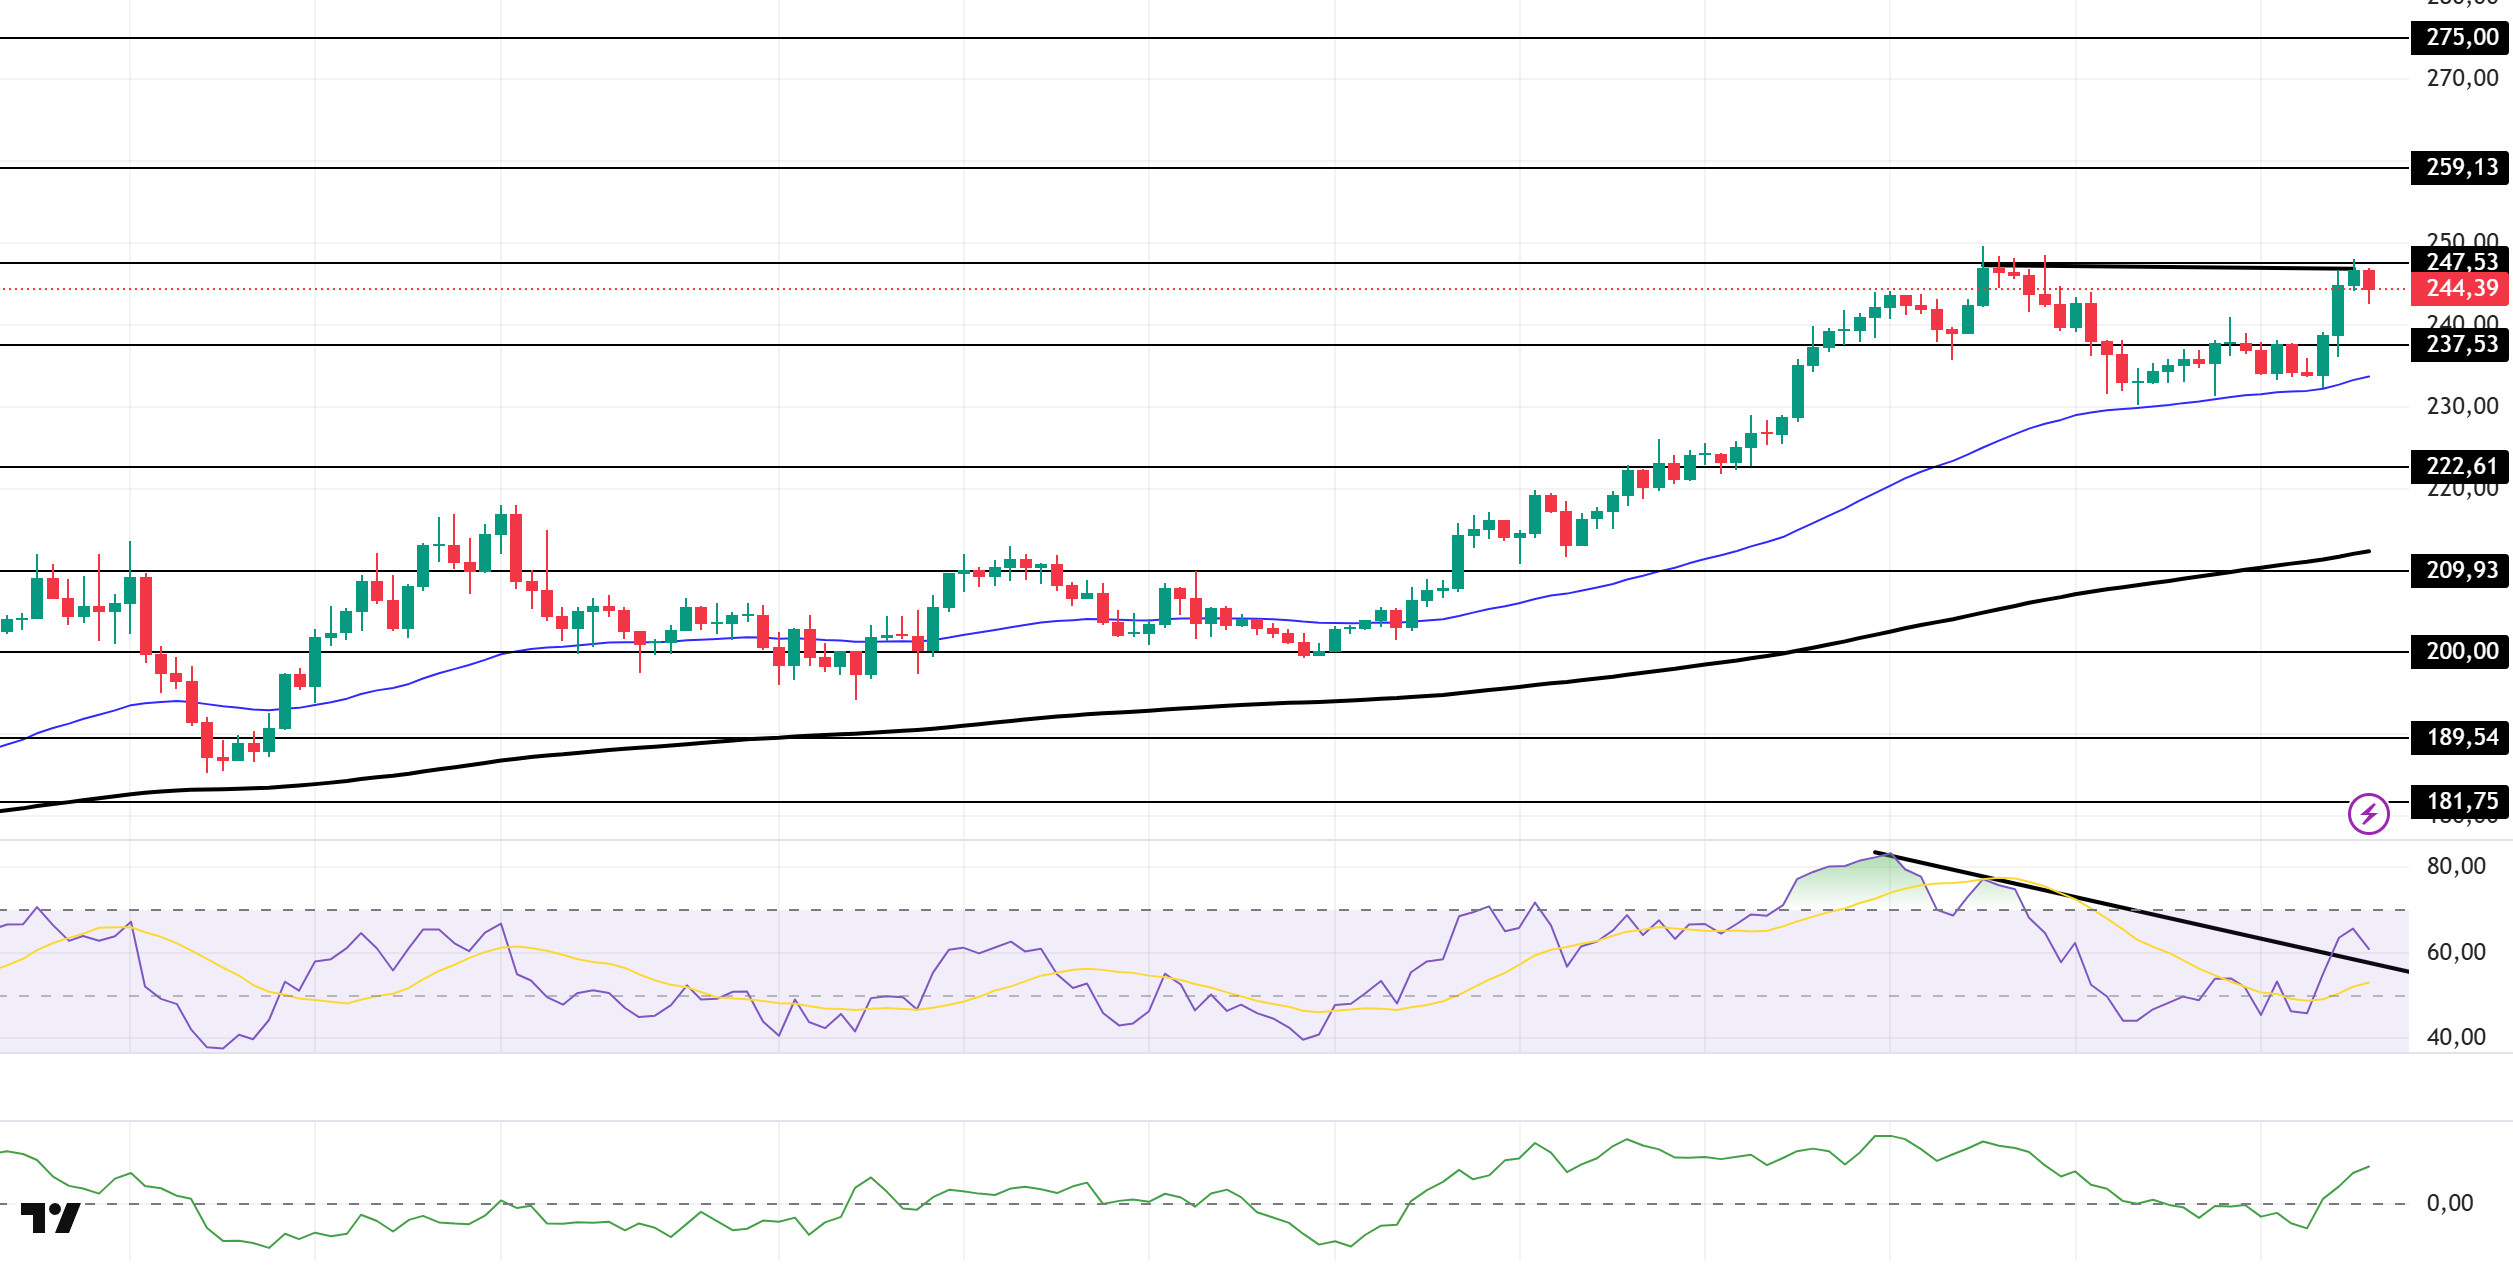
The SOL price showed an upward trend. The asset tested the strong resistance level of $237.53 and broke through it, continuing its upward movement. Currently testing the strong resistance level of $247.53 as resistance, the price could target the $259.13 level if it closes above this level. In case of a pullback, the $237.53 level could be monitored.
The price continued to remain above the 50 EMA (Exponential Moving Average – Blue Line) and 200 EMA (Black Line) on the 4-hour chart. This indicates that the upward trend may continue in the medium term. At the same time, the price being above both moving averages shows us that the market is trending upward in the short term. The large difference between the two moving averages indicates that the asset may be in a sideways or downward trend. Chaikin Money Flow (CMF-20) has moved into positive territory. However, an increase in cash inflows could push CMF to the upper levels of positive territory. Relative Strength Index (RSI-14) has moved into positive territory. It also broke the downward trend that began on September 12, signaling buying pressure. However, negative divergence may cause pullbacks. If there is an uptrend due to macroeconomic data or positive news related to the Solana ecosystem, the $259.13 level stands out as a strong resistance point. If this level is broken upward, the rise is expected to continue. If pullbacks occur due to developments in the opposite direction or profit-taking, the $237.53 level may be tested. If the price falls back to these support levels, an increase in buying momentum could present a potential upside opportunity.
Supports: 237.53 – 222.61 – 209.93
Resistances: 247.53 – 259.13 – 275.00
DOGE/USDT
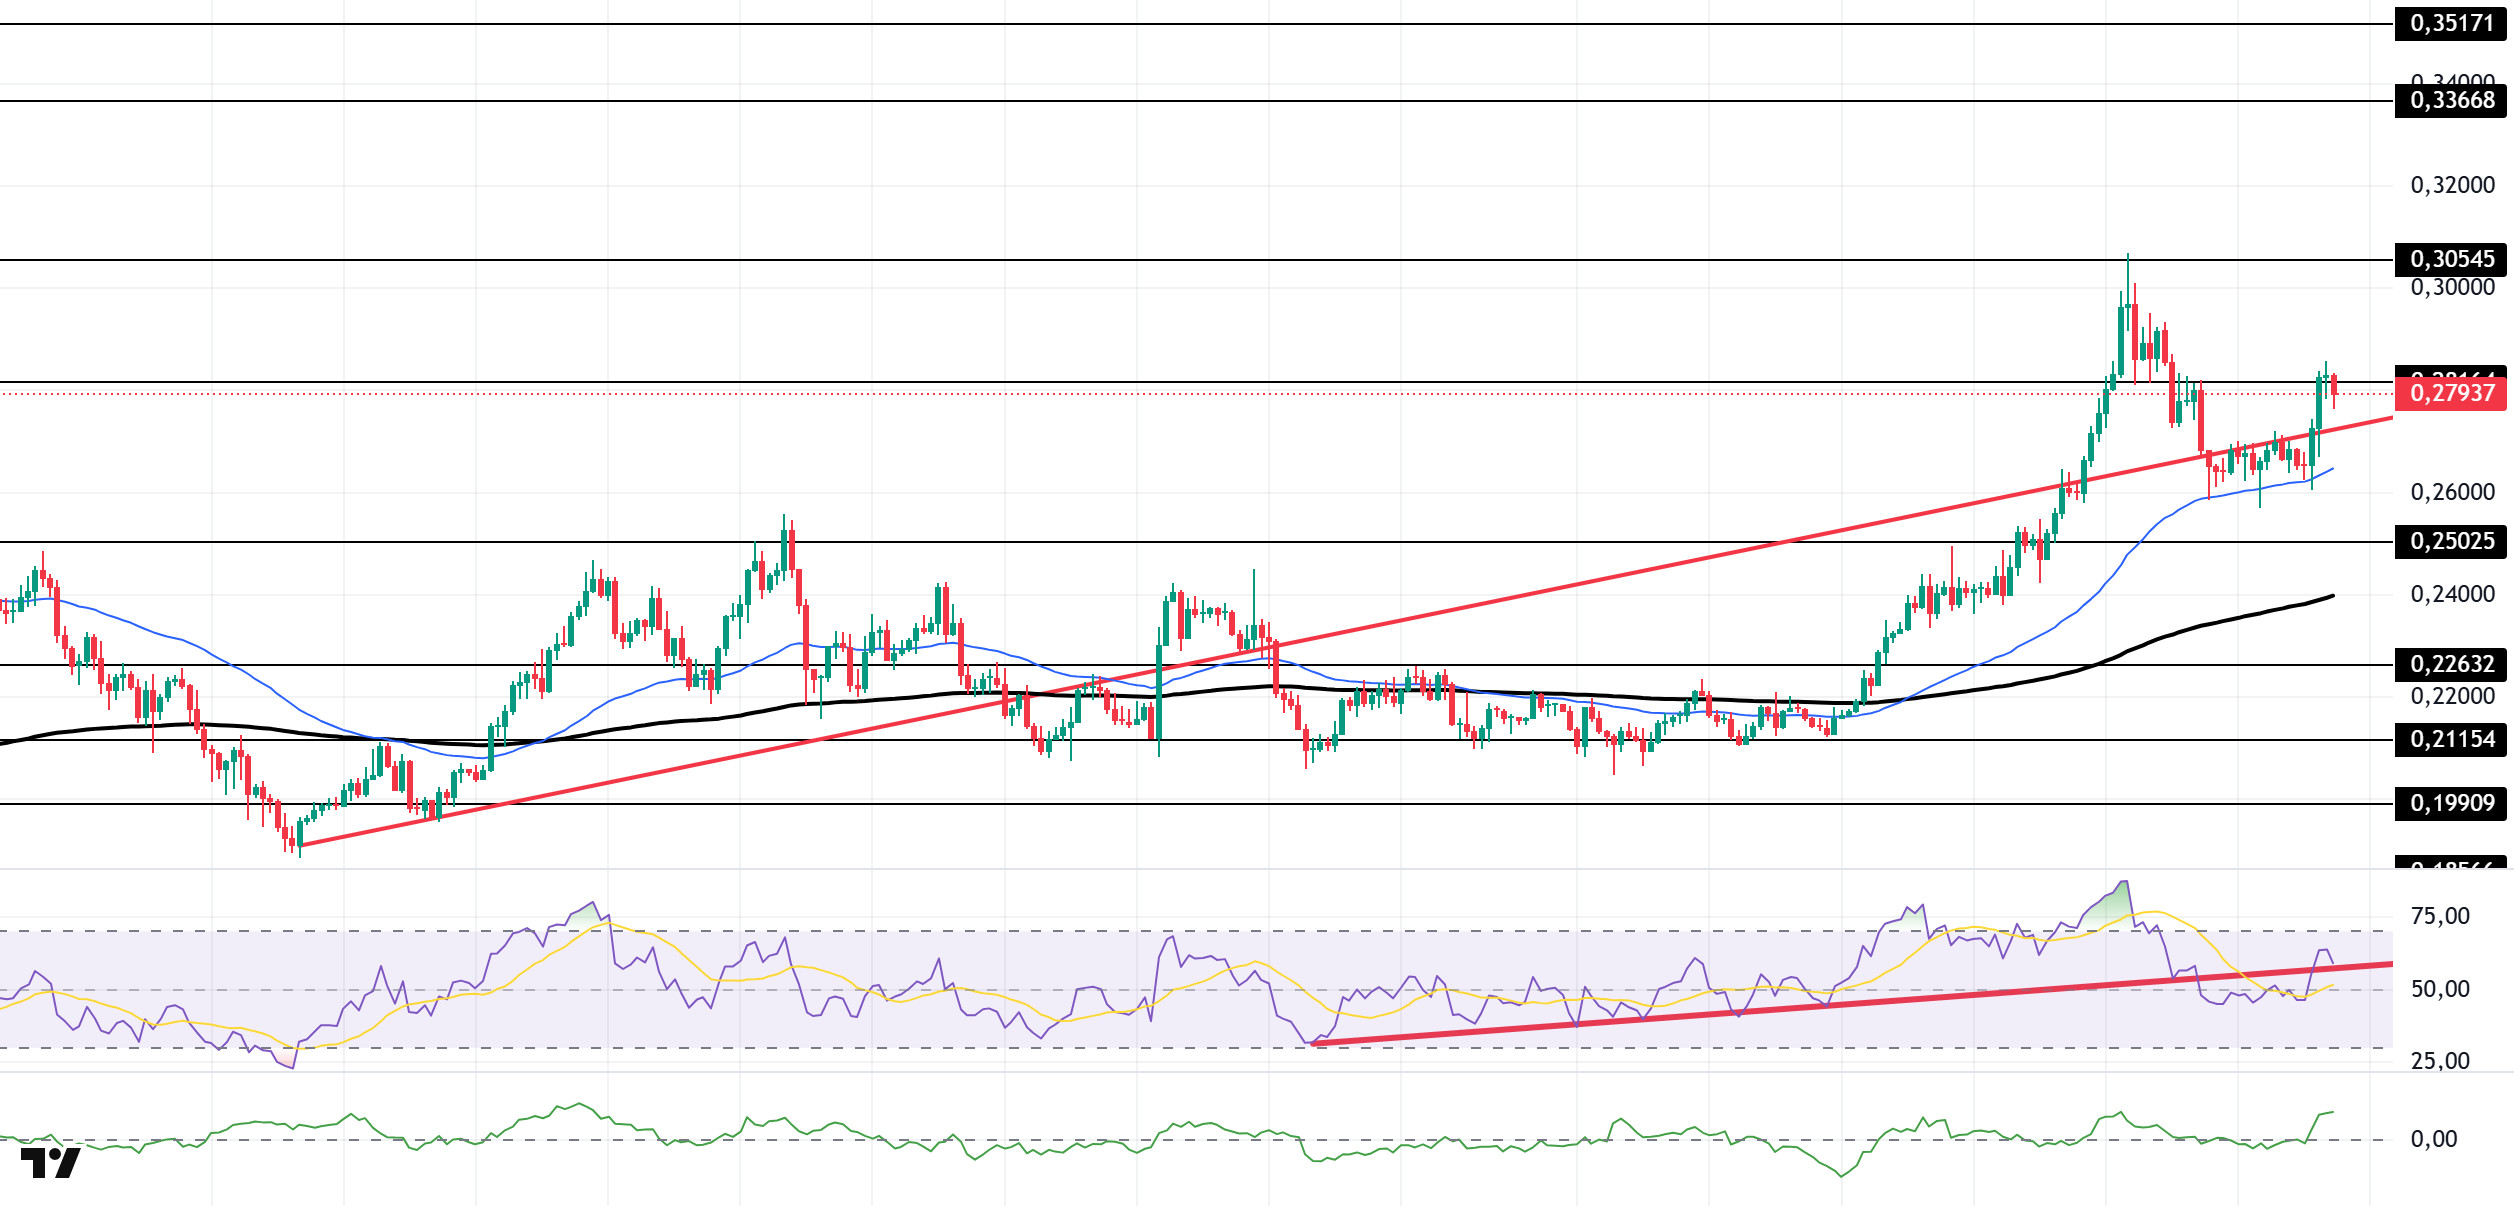
The DOGE price showed an upward trend. The asset retested the 50 EMA (Exponential Moving Average – Blue Line) moving average as support and gained momentum from there, breaking above the upward trend that began on August 3. Currently testing the $0.28164 level as resistance, the price could test the $0.30545 level if it closes above this level. In the event of a pullback, the upward trend could act as support.
On the 4-hour chart, the 50 EMA (Blue Line) remained above the 200 EMA (Black Line). This indicates that the medium-term upward trend is continuing. The price being above both moving averages indicates that the upward trend is strong in the short term. A large difference between the two moving averages may cause the asset to pull back or move sideways. The Chaikin Money Flow (CMF-20) has moved into positive territory. Additionally, a decrease in money inflows could push the CMF into negative territory. The Relative Strength Index (RSI-14) has also moved into positive territory. At the same time, it broke above the upward trend that began on August 26, signaling buying pressure. In the event of potential increases driven by political developments, macroeconomic data, or positive news flow within the DOGE ecosystem, the $0.30545 level stands out as a strong resistance zone. Conversely, in the event of negative news flow, the $0.25025 level could be triggered. A decline to these levels could increase momentum and potentially initiate a new upward wave.
Supports: $0.28164 – $0.25025 – $0.22632
Resistances: 0.30545 – 0.33668 – 0.35171
BNB/USDT
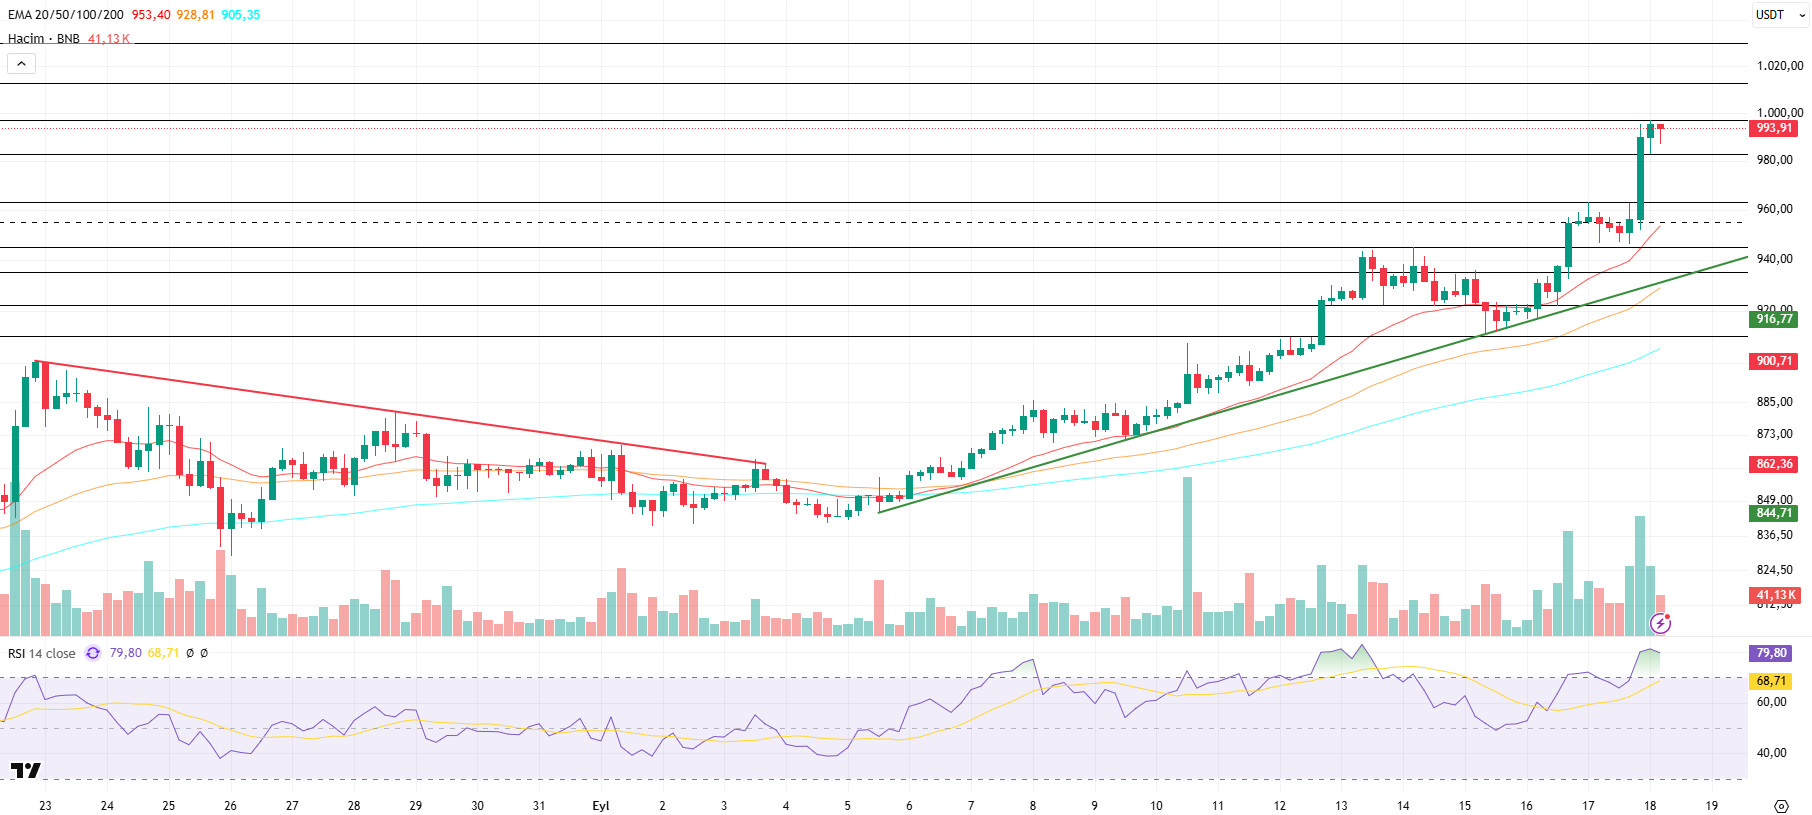
Following the Fed’s 25 basis point cut in its policy rate yesterday, BNB recorded accelerated positive movements, adding new historical highs. In this context, BNB, approaching the psychological level of $1,000, recorded an all-time high (ATH) of $997. However, based on the newly opened candles, it is observed that the price correction starting from this level continues to have a partial effect.
From a technical perspective, BNB/USDT, which entered an uptrend with strong support at the $840 level, has recorded new historic highs and shown positive momentum up to the $960 level. Facing some selling pressure at this level, BNB retreated towards the EMA 20 (red line) level. With the support of fundamental developments, BNB found strong support at these levels and set a new ATH at $997.
Technical indicators for BNB/USDT, currently trading in the $985–1000 range, show that positive changes in trading volume in recent periods have contributed to the asset’s upward momentum. Furthermore, the Relative Strength Index (RSI) rose well above the 70 level with the recent increases but turned downward with the price correction. Nevertheless, the RSI is still hovering near these levels, indicating that there is still some room for correction in the asset.
Based on the current technical picture, if selling pressure increases, the price is likely to fall back to the $985 support level. If this level is broken downwards, the price is expected to fall to the $965 and $945 levels, respectively. On the other hand, if buying appetite is maintained, BNB is expected to test the psychological resistance level of $1,000 in the first stage. If this level is exceeded, the price may move towards the $1,015 and $1,030 levels, respectively.
Supports: 985 – 965 – 945
Resistances: 1000 – 1015 – 1030
Legal Notice
The investment information, comments, and recommendations contained herein do not constitute investment advice. Investment advisory services are provided individually by authorized institutions taking into account the risk and return preferences of individuals. The comments and recommendations contained herein are of a general nature. These recommendations may not be suitable for your financial situation and risk and return preferences. Therefore, making an investment decision based solely on the information contained herein may not produce results in line with your expectations.


