BTC/USDT
The White House is set to release its first official policy report on cryptocurrencies later this month. Republicans in the House of Representatives proposed cutting the SEC budget by 7% and cancelling some sanctions funds. Fed Chairman Jerome Powell faced criminal charges by pro-Trump lawmakers. JPMorgan Chase plans to treat its clients’ crypto assets as loan collateral by 2026. Swedish public company H100 Group increased its total Bitcoin holdings to over 510 units with the latest purchase. The Bank of England is considering suspending its digital sterling plans.
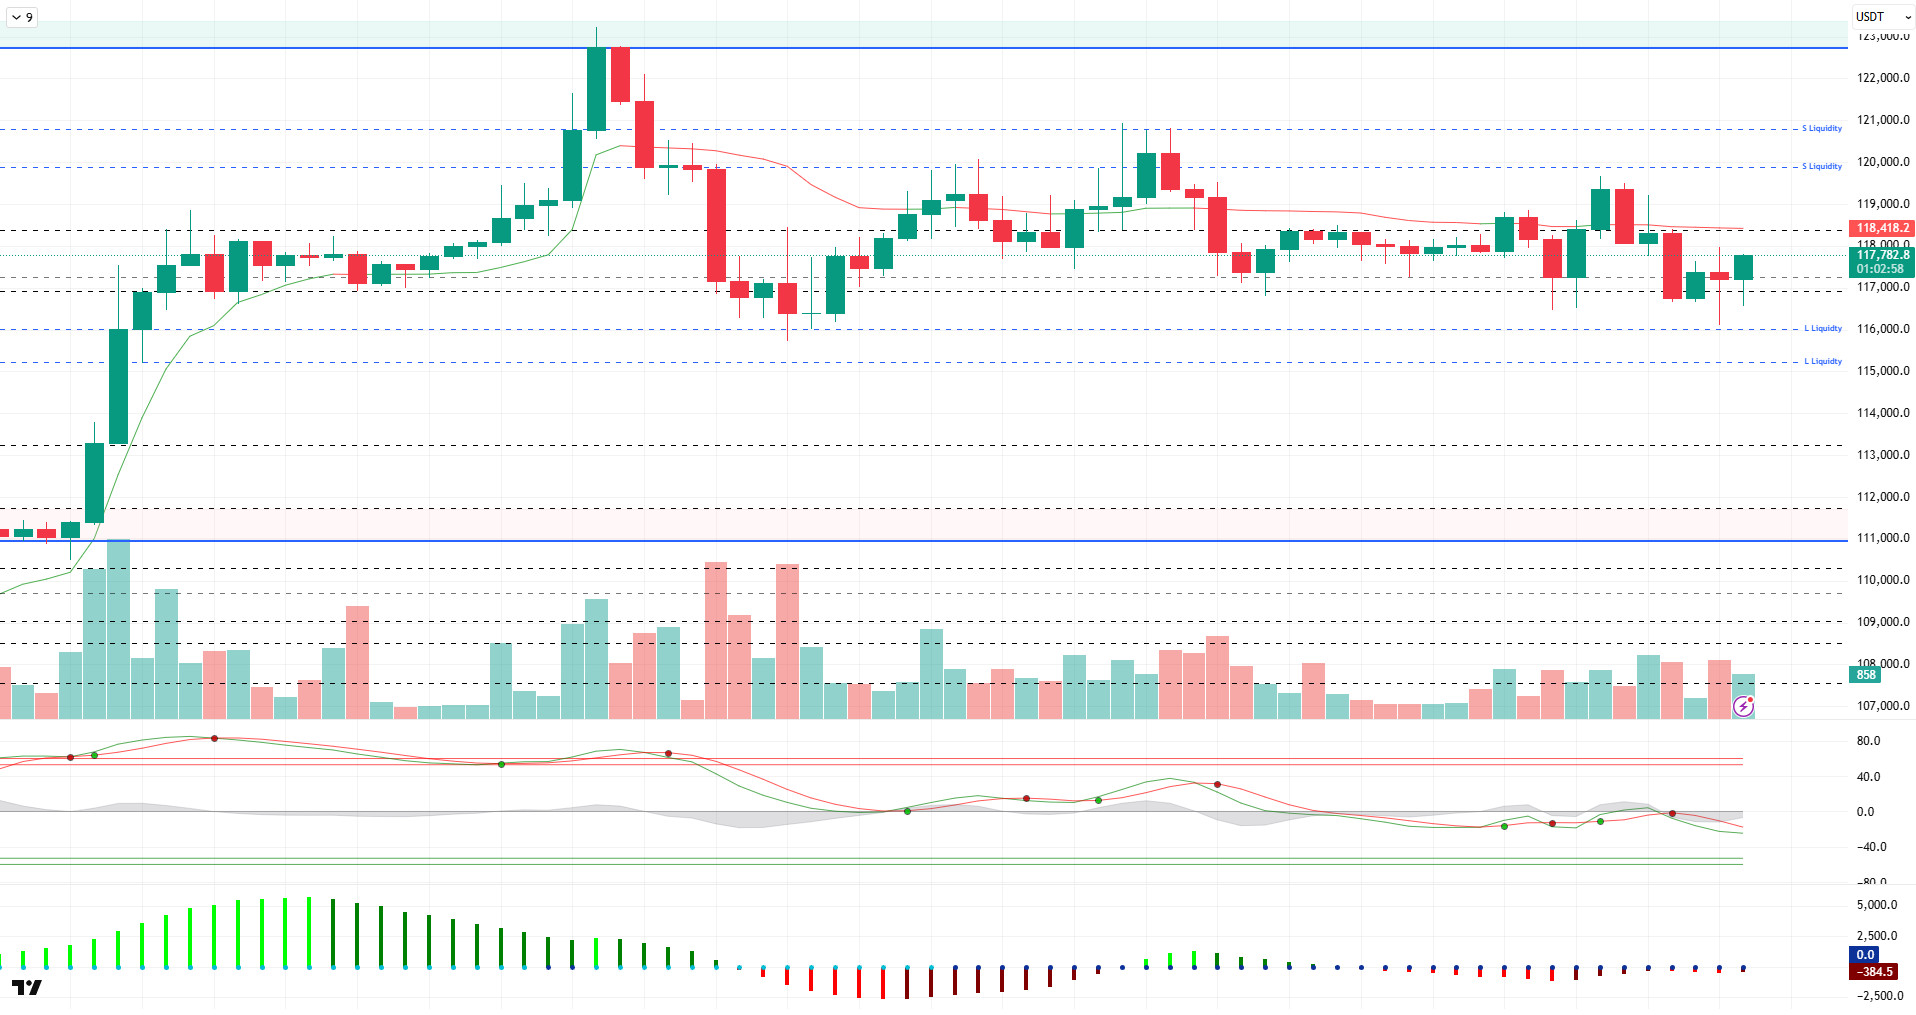
Looking at the technical outlook, BTC price continues to consolidate horizontally near the ATH level. BTC, which has been moving in the 116,000 – 119,000 band for a while, is rebalancing within this range, although it occasionally sags outside these levels. BTC, which pushed 119,000 levels yesterday, fell to 116,000 in the evening hours. Then, the price, which received a reaction from here, once again turned its direction upwards and continues to be traded at 117,500 at the time of writing the analysis.
Looking at the technical indicators, the Wave Trend (WT) oscillator turned down after an indecisive display at the channel mid-band with the recent decline. The histogram on the Squeeze momentum (SM) indicator regained momentum but is still in negative territory. The Kaufman moving average crossed above the price at 118,400.
Liquidity data shows that the liquidation of heavy buying positions at 116,000 with the recent decline has taken place, while another buying tier continues to accumulate at 115,000. The selling tier continues to accumulate in the 119.00 – 123.000 band in the long term, while the sparseness of short-term transactions is noteworthy.
In summary, the price continues to consolidate near the ATH level as fundamental developments continue to contribute positively to pricing. While the technical outlook is turning towards the oversold zone after an indecisive structure in the short term, liquidity data continues to keep price movements sideways. In the continuation of the rise, closures above the 118,600 minor resistance point will be followed, while in a possible selling pressure, closures below the 117,500 support level may lead the price towards the 115,000 level.
Supports 117,500 – 116,800 – 115,300
Resistances 118,600 – 120,000 – 121,000
ETH/USDT
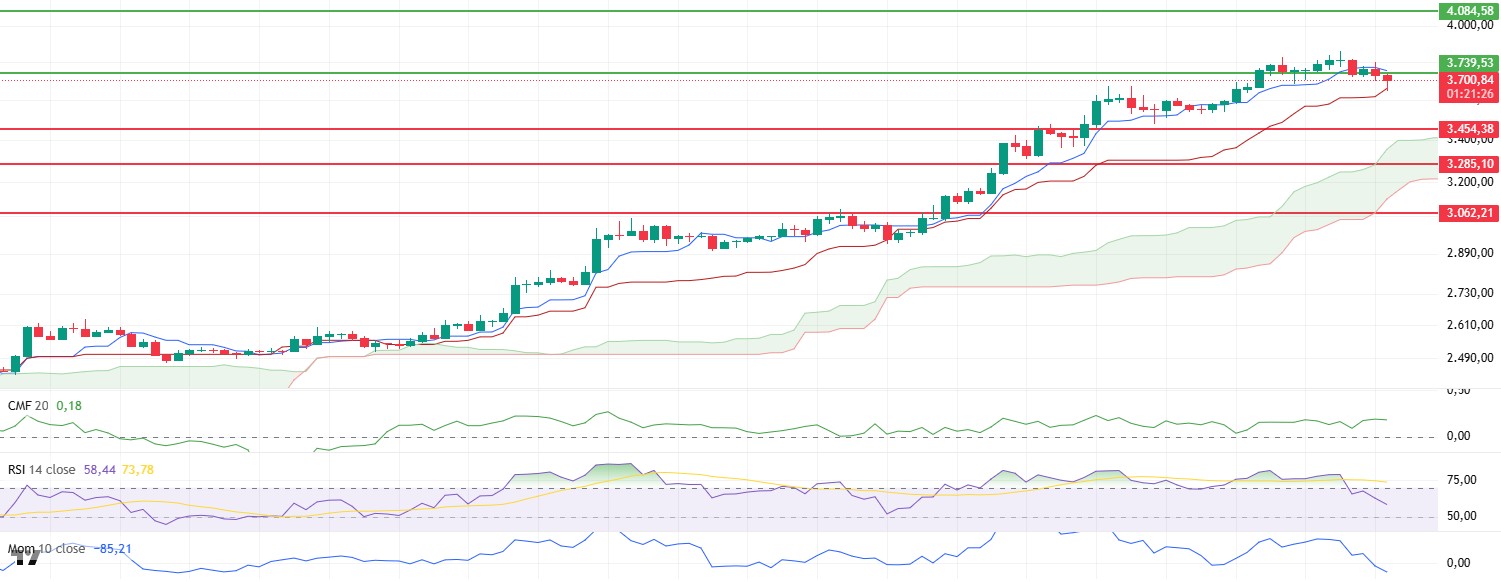
ETH tested an important resistance zone yesterday evening, rising as high as $3,860. However, with the selling pressure encountered at this level, the price retreated and fell to a support level of $3,739. With the break of this support in the morning hours, sales accelerated and the price fell to the $3,646 region, which corresponds to the kijun level of the Ichimoku cloud. At this level, there was a recovery as buyers stepped in and the price managed to rise above the $3,700 level again.
Technical indicators suggest that the correction following the upside move is a classic market behavior. The Relative Strength Index (RSI) retreated sharply from the overbought zone, indicating a stabilizing trend. At the same time, the momentum indicator also accompanied the decline, indicating a loss of short-term strength. When these two indicators are evaluated together, it is possible to read the pullback as a temporary correction in an overheated market.
On the other hand, Chaikin Money Flow (CMF) remains in positive territory despite the price decline and maintains its upward trend. This indicates that liquidity inflows to the market are still strong and the sell-off has not yet turned into a strong exit. CMF’s presence in the positive area suggests that investor interest remains and may be limited in the downward movements of the price.
On the Ichimoku indicator, the technical structure remains positive. While the price’s support from the kijun level has mitigated the short-term downside risk, the upward expansion of the kumo cloud and the price still hovering above the cloud indicate that the overall trend remains positive. This technical pattern indicates that the groundwork is in place for a new bullish wave after the correction.
As a result, as long as the kijun support at $3,646 can be maintained, the price is likely to enter a recovery process towards the $3,800 band. However, if this level is broken downwards, the correction is likely to deepen and carry the price to the support level of $3,454. In the short-term scenario, these two levels will play a critical role in determining the direction.
Top of Form
Below the Form
Supports 3,646 – 3,455 – 3,285
Resistances 3,739 – 4,084 – 4,381
XRP/USDT
XRP rose as high as $3.64 in the evening hours yesterday, forming an intraday peak. However, with the selling pressure intensifying at this level, the price retreated and fell to $3.42 support. At this point, with the re-engagement of buyers, the price recovered and managed to settle above the $3.46 level. This movement reveals that short-term support zones are still working and the market is reacting at certain levels.
Technical indicators suggest that the retracement may remain limited. In particular, the Chaikin Money Flow (CMF) indicator has remained flat in the positive territory, suggesting that despite the decline in the price, liquidity has not flowed into the market. This view of CMF suggests that there is no strong selling wave behind the decline and that the retracement is more of a short-term correction.
When the Ichimoku cloud is analyzed, the picture is more cautious. The fact that the price dipped below both the tenkan and kijun levels suggests that bearish pressure is still effective and the current correction may continue for a while. If the price dips below the $3.40 level, the bearish move has the potential to deepen and test the $3.28 support level. This area can be monitored as a ground where buyers can re-engage as it has formed a strong base in the past.
On the other hand, exceeding the tenkan resistance, which corresponds to the $3.52 level in a possible recovery scenario, may cause the short-term negative structure to break down. Settling above this level may lead to a positive break in market perception, paving the way for the price to head towards the $3.60 band again.
As of the general outlook, the possibility that the price will test the support of $3.40 by following a slightly negative course during the day stands out. While maintaining this level is important for short-term stabilization, if it is lost, downside risks may increase and the $3.28 level can be expected to come to the agenda. On the other hand, if there is a persistence above the $3.52 level, the selling pressure may decrease and a new upward wave may occur.
Supports 3.4014 – 3.2813 – 2.9967
Resistances 3.8615 – 4.000 – 4.4000

SOL/USDT
Mercurity Fintech partners with Solana Ventures for $200 million digital asset strategy.
Upexi announced the purchase of 100,000 Solana (SOL) tokens for $17.7 million. The acquisition brings the company’s total holdings to 1.82 million SOLs worth $331 million.
The SOL price continued to rise.
The asset continues to remain above the uptrend that began on June 23rd. The price accelerated upwards from the uptrend and broke the $189.54 level, supported by the $171.82 level, and hit resistance at $200.00, from which it retreated. If the retracement continues, the rising trend may work as support. If the rise continues, the $209.93 level can be followed.
On the 4-hour chart, the 50 EMA (Blue Line) continues to be above the 200 EMA (Black Line). This indicates that the bullish trend may continue in the medium term. At the same time, the fact that the price is above both moving averages suggests that the market is currently in a bullish trend in the short term. Chaikin Money Flow (CMF-20) continued to be in positive territory. However, a decline in inflows could move CMF into negative territory.
Relative Strength Index (RSI-14) continues to be in positive territory and is in overbought territory. However, selling pressure has emerged. However, a negative mismatch has formed. This may bring a decline. In addition, it remained above the uptrend that started on July 15.
The $200.00 level stands out as a strong resistance point in case of an uptrend on the back of macroeconomic data or positive news on the Solana ecosystem. If this level is broken upwards, the rise can be expected to continue. If there are pullbacks due to contrary developments or profit realizations, the $181.75 level can be tested. In case of a decline to these support levels, the increase in buying momentum may offer a potential bullish opportunity.
Supports 189.54 – 181.75 – 171.82
Resistances 200.00 – 209.93 – 222.61

DOGE/USDT
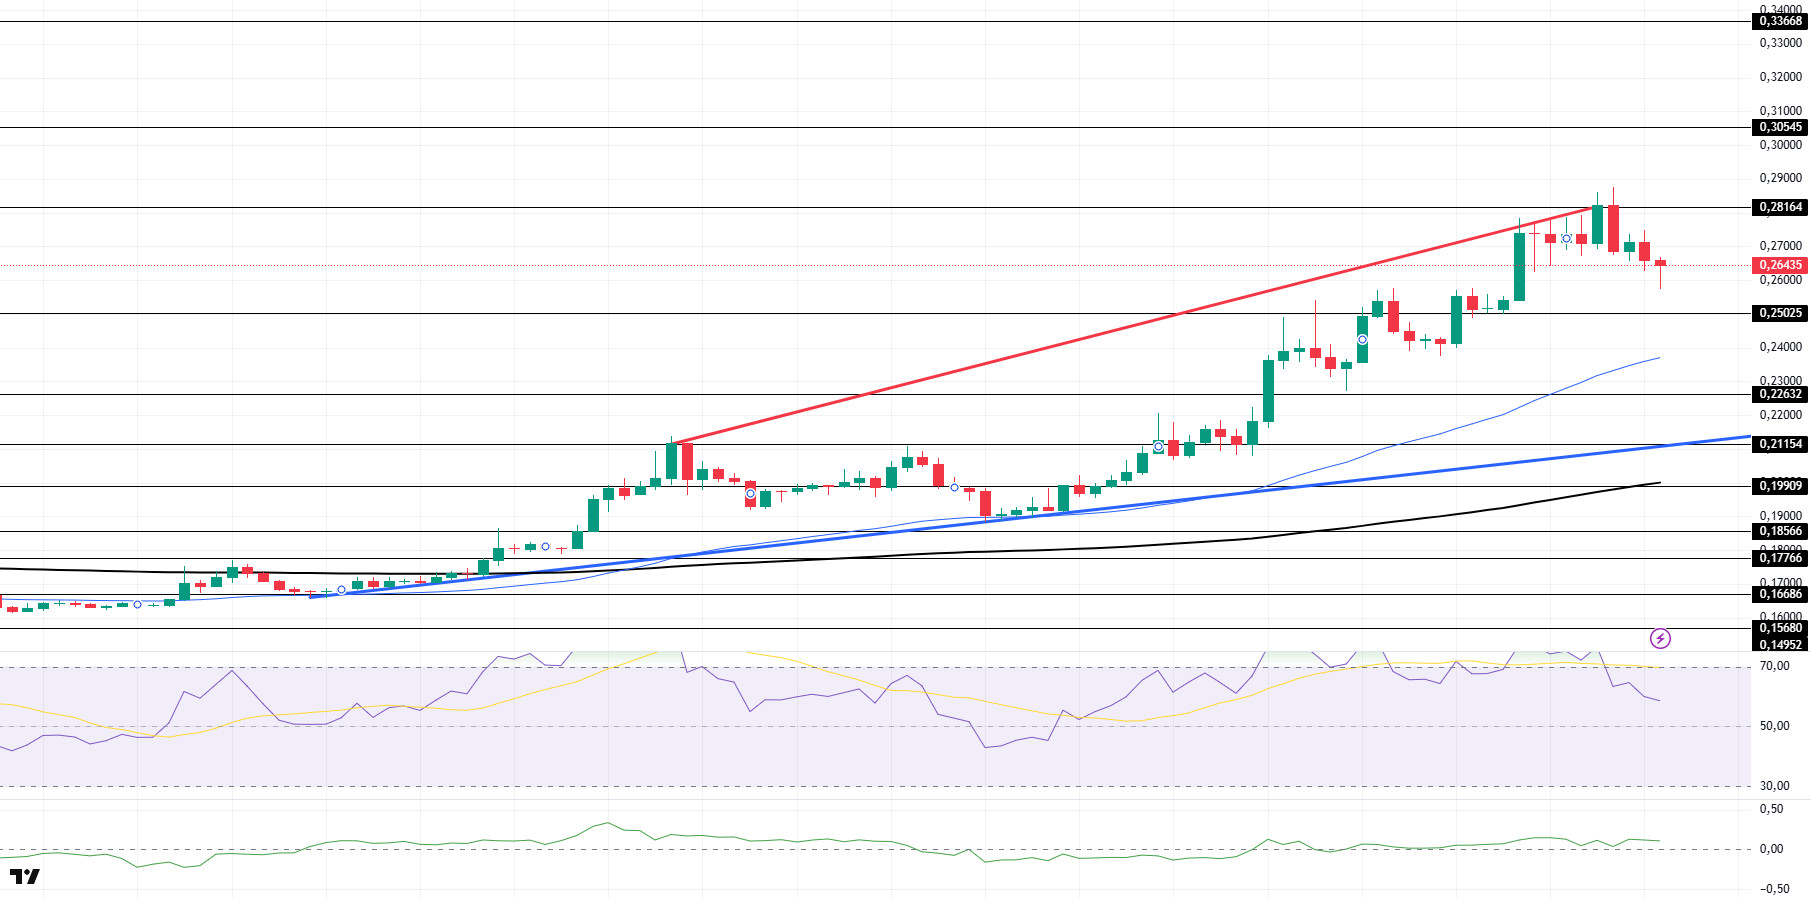
DOGE price started to decline. The asset continued to stay above the 200 EMA (Black Line) and 50 EMA (Blue Line) moving averages in an uptrend that started on July 7. Breaking the strong resistance at $0.25025, the asset tested the $0.28164 level but failed to sustain its momentum and started to retreat from there. In case of a continuation of the retreat, the $ 0.25025 level should be followed. If the upward acceleration starts again, it may test the $ 0.30545 level.
On the 4-hour chart, the 50 EMA (Blue Line) continues to be above the 200 EMA (Black Line). This suggests that the asset is bullish in the medium term. The fact that the price is above both moving averages suggests that the asset is bullish in the short term. A large difference between the two moving averages may cause the price to follow a bearish or sideways trend. Chaikin Money Flow (CMF-20) continued to be in positive territory. In addition, negative money inflows may move CMF into negative territory. Relative Strength Index (RSI-14) remained in positive territory. However, selling pressure has emerged. Additionally, there is a regular divergence pattern. This may cause the price to fall further. The $0.30545 level stands out as a strong resistance zone in case of a rally in line with political developments, macroeconomic data or positive news flow in the DOGE ecosystem. In the opposite case or possible negative news flow, the $0.25025 level may be triggered. In case of a decline to these levels, the momentum may increase and a new bullish wave may start.
Supports 0.25025 – 0.22632 – 0.21154
Resistances 0.28164 – 0.30545 – 0.33668
Legal Notice
The investment information, comments and recommendations contained herein do not constitute investment advice. Investment advisory services are provided individually by authorized institutions taking into account the risk and return preferences of individuals. The comments and recommendations contained herein are of a general nature. These recommendations may not be suitable for your financial situation and risk and return preferences. Therefore, making an investment decision based solely on the information contained herein may not produce results in line with your expectations.