
Technical Analysis
BTC/USDT
US President Trump announced plans to distribute part of the revenue generated from tariffs directly to the public, up to $2,000 per person. Due to the government shutdown, the US Bureau of Labor Statistics suspended operations, and the non-farm payroll (NFP) report expected to be released tonight has been postponed. It reported that the report may have been prepared, but no official response has been received from the agency. Weekly jobless claims data had also not been released for the same reason.
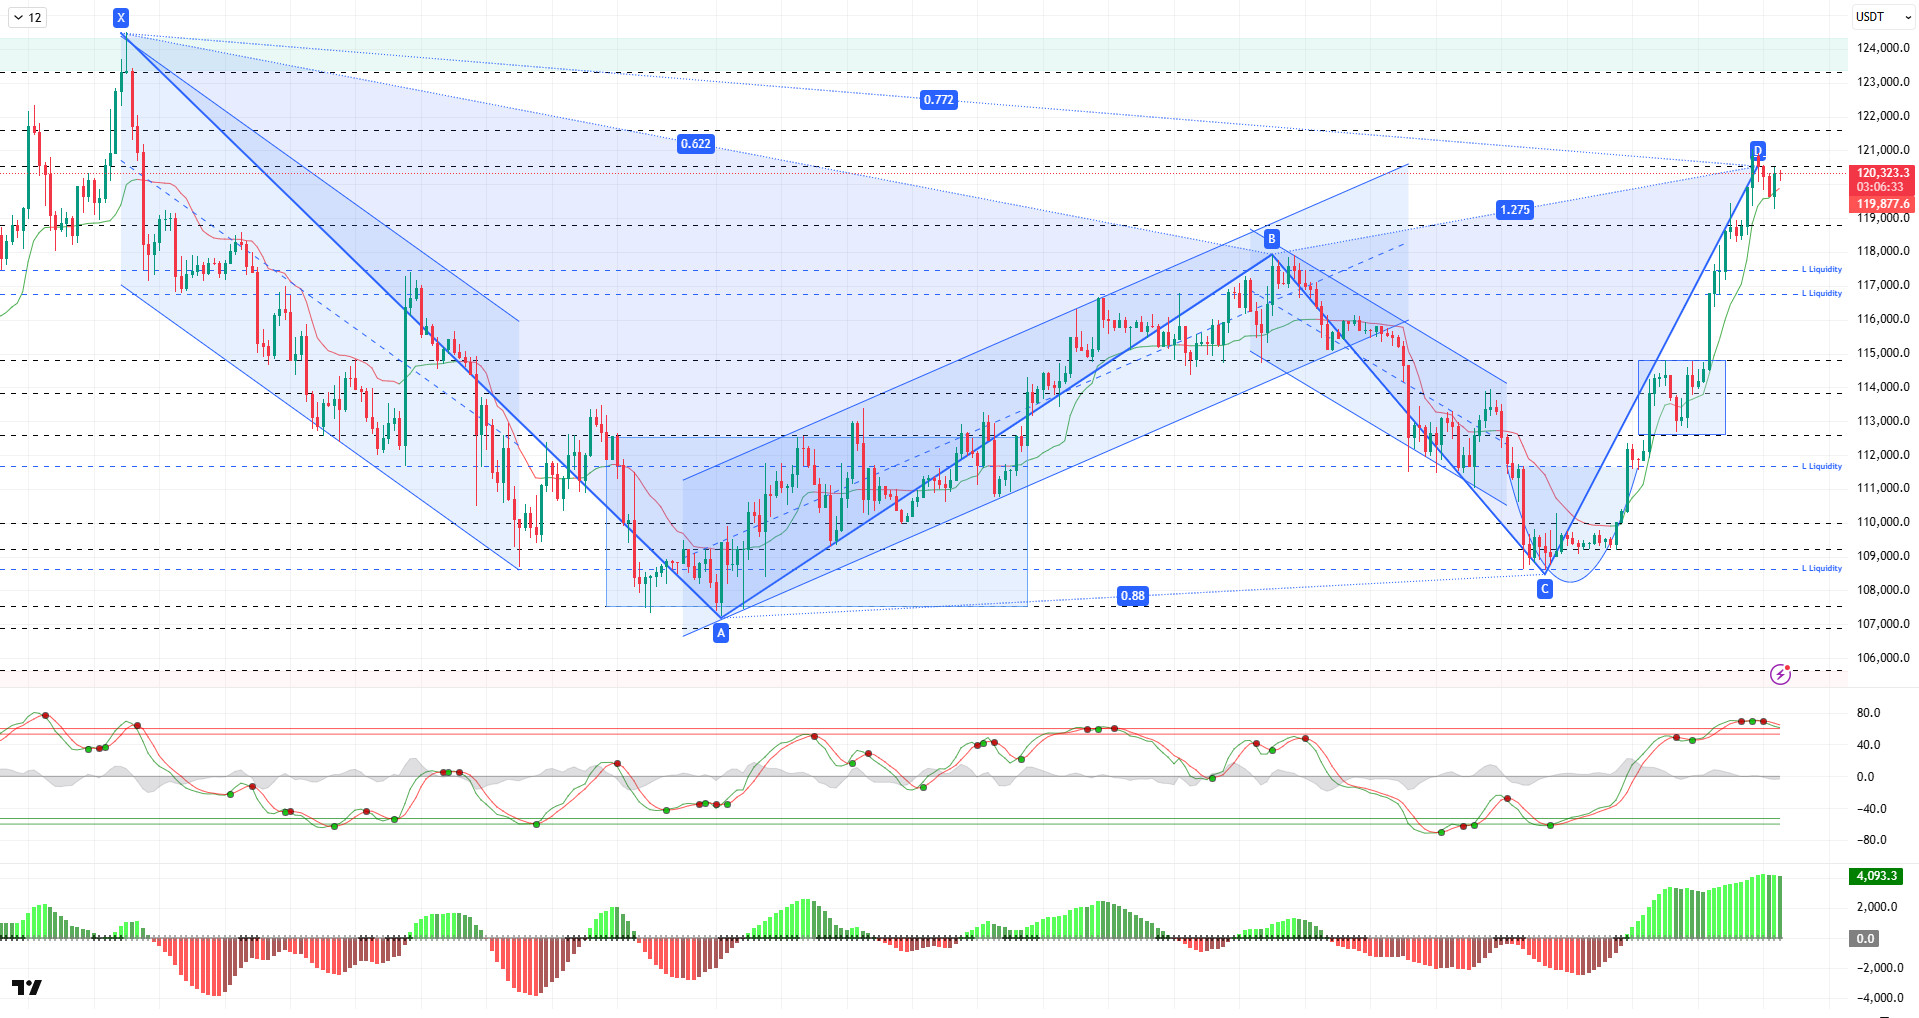
Looking at the technical picture, BTC combined its upward movement with a cup formation and a Gartley pattern to reach the $120,900 level. After completing the “CD” leg of the pattern, BTC reversed its direction downward. BTC, which occasionally fell below the 120,000 level during the day, continues to test the 120,500 resistance level.
Technical indicators show indecisive movements, with the Wave Trend oscillator (WT) producing consecutive buy-sell signals in the overbought zone. The Squeeze Momentum (SM) indicator continues its momentum within the positive area of the histogram while showing negative divergence. The Kaufman moving average is currently trading below the price at the 119,800 level.
Looking at liquidation data, the selling level is regaining strength with the recent upward movement and attempting to accumulate at the 121,400 level. In contrast, buying levels continue to intensify. In the short term, the 117,800 and 116,600 levels stand out as the first buying levels, while in a broader time frame, the 112,200 level is noteworthy as an accumulation zone. Looking at the last 24 hours, $78 million worth of BTC short positions were liquidated, while $23 million worth of long positions were liquidated. Thus, the total liquidation amount in the market reached approximately $394 million.
In summary, while the US government shutdown has not had a significant impact on the markets, Fed members’ differing views on interest rate cuts and the return of tariffs to the agenda are among the prominent developments. The negative outlook for short-term interest rate cut expectations regained strength with interest rate cut expectations rising to 98%. On the BTC side, it made a strong entry into October, a month that saw double-digit averages in terms of cyclical movements, with a 5.41% increase. The cup formation and Gartley pattern that emerged in the technical outlook supported the price’s recovery trend. Liquidity data moved in parallel, clearing liquidity levels. All these developments pushed the price closer to its ATH level, carrying it above the 120,000 level. From this point on, 120,000 will be monitored as a critical reference area, and closes above it could bring the price to new ATH levels. In the event of a potential correction, the support levels of 119,000 and then 117,400 will be monitored.
Supports: 119,000 – 116,000 – 117,400
Resistances: 120,500 – 121,400 – 123,300
ETH/USDT
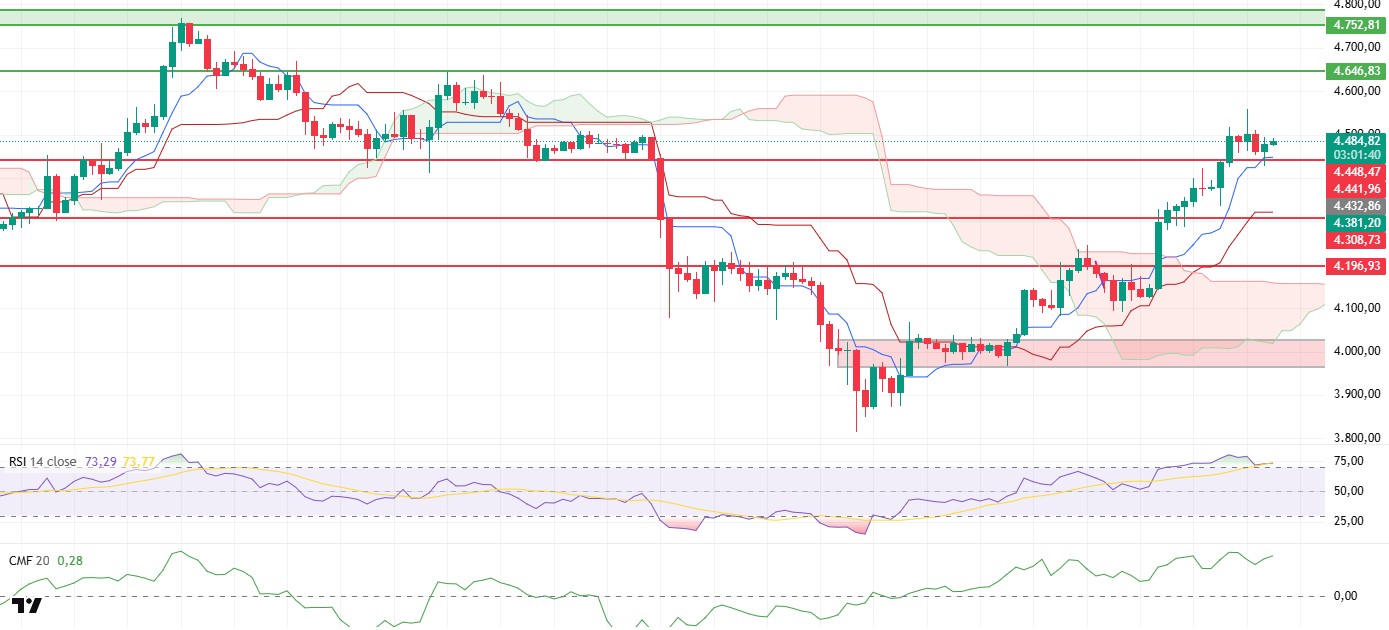
After retesting the $4,441 level during the day, the ETH price rebounded with buyers re-entering the market and managed to rise above the $4,480 level. The fact that the critical support level held after being tested shows that the market considers this area a strong base and that the bullish scenario is still valid. In particular, the buying response following short-term profit-taking shows that buyers have not lost their dominance in the market and that the trend continues unbroken.
The Relative Strength Index (RSI) indicator is still in the overbought zone and continues its gradual downward trend. This outlook suggests that the price may undergo a period of horizontal movement or consolidation within a narrow band for a while longer. However, it should be remembered that in strong trends, the RSI can remain in the overbought zone for a long time. Therefore, although this pullback in the indicator shows that the market is tired, it has not produced a signal strong enough to change the direction of the trend.
The fact that the price continues to remain above the Kumo cloud in the Ichimoku indicator confirms that the overall upward trend is still valid. Furthermore, closes above the Tenkan and Kijun levels clearly show that buyers maintain their technical superiority. This structure emphasizes that short-term pullbacks can be considered healthy corrections within the trend and that the overall positive outlook remains strong.
The Chaikin Money Flow (CMF) indicator continuing to hold in positive territory indicates that liquidity inflows into the market are continuing and that buyer support persists. In particular, the price reacting upward with buying from support levels signals that investors continue to maintain their positions in safe zones.
Overall, as long as the ETH price remains above the $4,441 level, the upward trend is expected to be maintained. Retesting the $4,560 level and breaking this resistance could accelerate the upward movement, paving the way for the price to move towards higher levels . Conversely, a loss of the $4,441 support level could increase market fragility, intensify selling pressure, and lead to a deeper correction in the short term.
Supports: 4,441 – 4,308 – 4,196
Resistances: 4,646 – 4,752 – 4,857
XRP/USDT
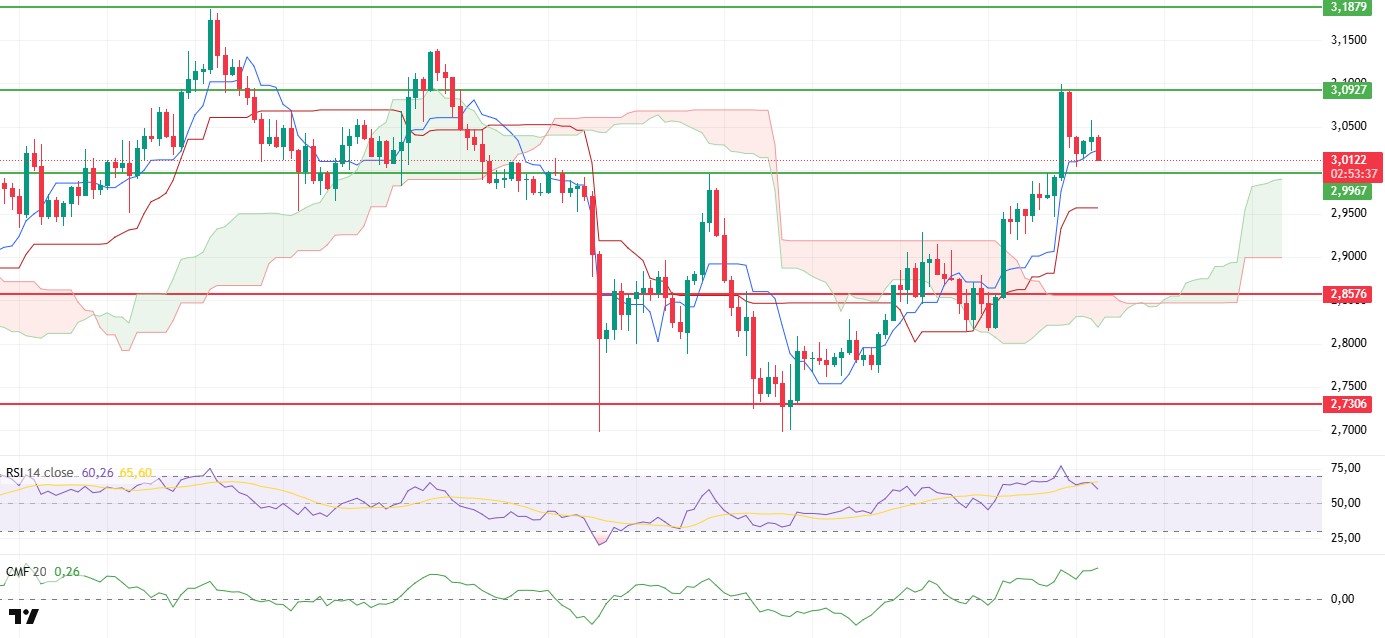
The XRP price continued to hold above the $2.99 level during the day but encountered selling pressure at the $3.06 level, reversing from this area and falling back to $3.02. While the move shows that buyers are maintaining their strength in the market, it also reveals that selling pressure is effective at resistance levels in the short term.
The Relative Strength Index (RSI) indicator continues its downward movement, signaling weakness. This outlook suggests that the price may fluctuate within a narrow range for a while longer and that momentum remains limited in the short term.
The increase in the Chaikin Money Flow (CMF) indicator confirms that liquidity inflows into the market are continuing and that buyers’ appetite remains strong. This structure indicates that there is a strong capital flow behind the upward trend, despite short-term sales.
In the Ichimoku indicator, the price remaining above the Kumo cloud and the Tenkan and Kijun levels continues to support the positive outlook. This picture confirms that, from a technical perspective, buyers still hold the upper hand and the trend remains intact.
Consequently, as long as the XRP price maintains the $2.99 support, a retest of the $3.09 resistance level is expected during the day. However, if the $2.99 support is lost, the likelihood of increased selling pressure and a deeper pullback in the price will strengthen.
Supports: 2.9967 – 2.8576 – 2.7306
Resistances: 3.0927 – 3.1879 – 3.3058
SOL/USDT
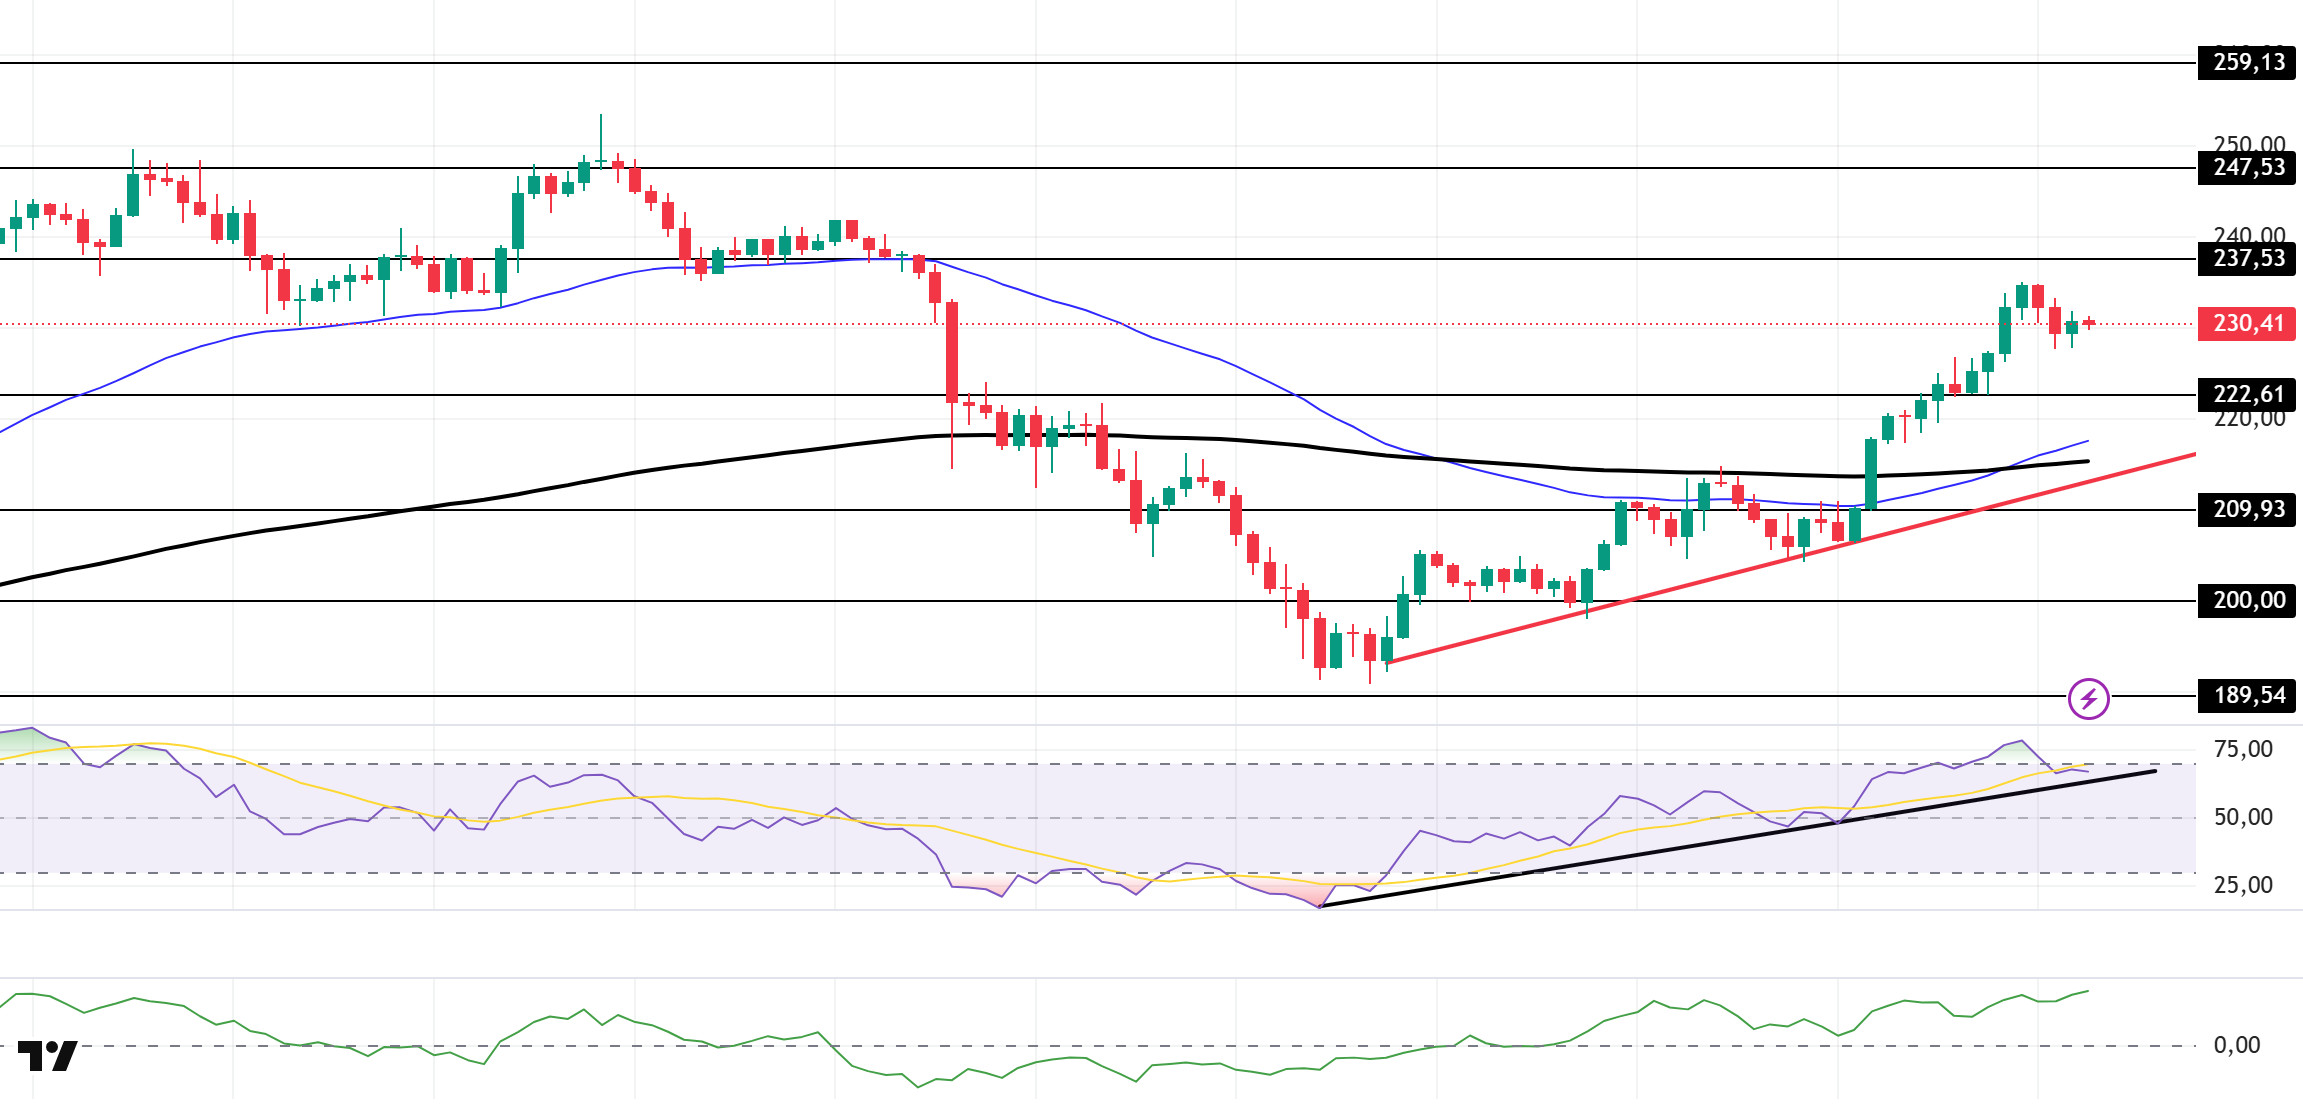
The SOL price traded sideways during the day. The asset continues to trade in the upper region of the rising trend that began on September 26. The price, which broke above the 50 EMA (Blue Line) moving average and the 200 EMA (Black Line) moving average with a strong candle, continues to trade above the strong resistance level of $222.61, maintaining its momentum. If the upward movement continues, it may test the $237.53 level. In case of pullbacks, the $209.93 level can be monitored.
On the 4-hour chart, it has started to move above the 50 EMA (Exponential Moving Average – Blue Line) and 200 EMA (Black Line). This indicates a possible uptrend in the medium term. At the same time, the price being above both moving averages shows us that the asset is trending upward in the short term. The Chaikin Money Flow (CMF-20) remained in positive territory. However, a decrease in cash inflows could push the CMF to the lower levels of the positive zone. The Relative Strength Index (RSI-14) also remained in positive territory. It also continued to remain in the upper region of the upward trend that began on September 25. This signaled that the upward pressure was continuing. However, profit-taking in the overbought zone could pull the price back. If there is an upward movement due to macroeconomic data or positive news related to the Solana ecosystem, the $237.53 level stands out as a strong resistance point. If this level is broken upwards, the uptrend is expected to continue. If pullbacks occur due to developments in the opposite direction or profit-taking, the $222.61 level could be tested. A decline to these support levels could increase buying momentum, presenting a potential upside opportunity.
Supports: 222.61 – 209.93 – 200.00
Resistances: 237.53 – 247.53 – 259.13
DOGE/USDT
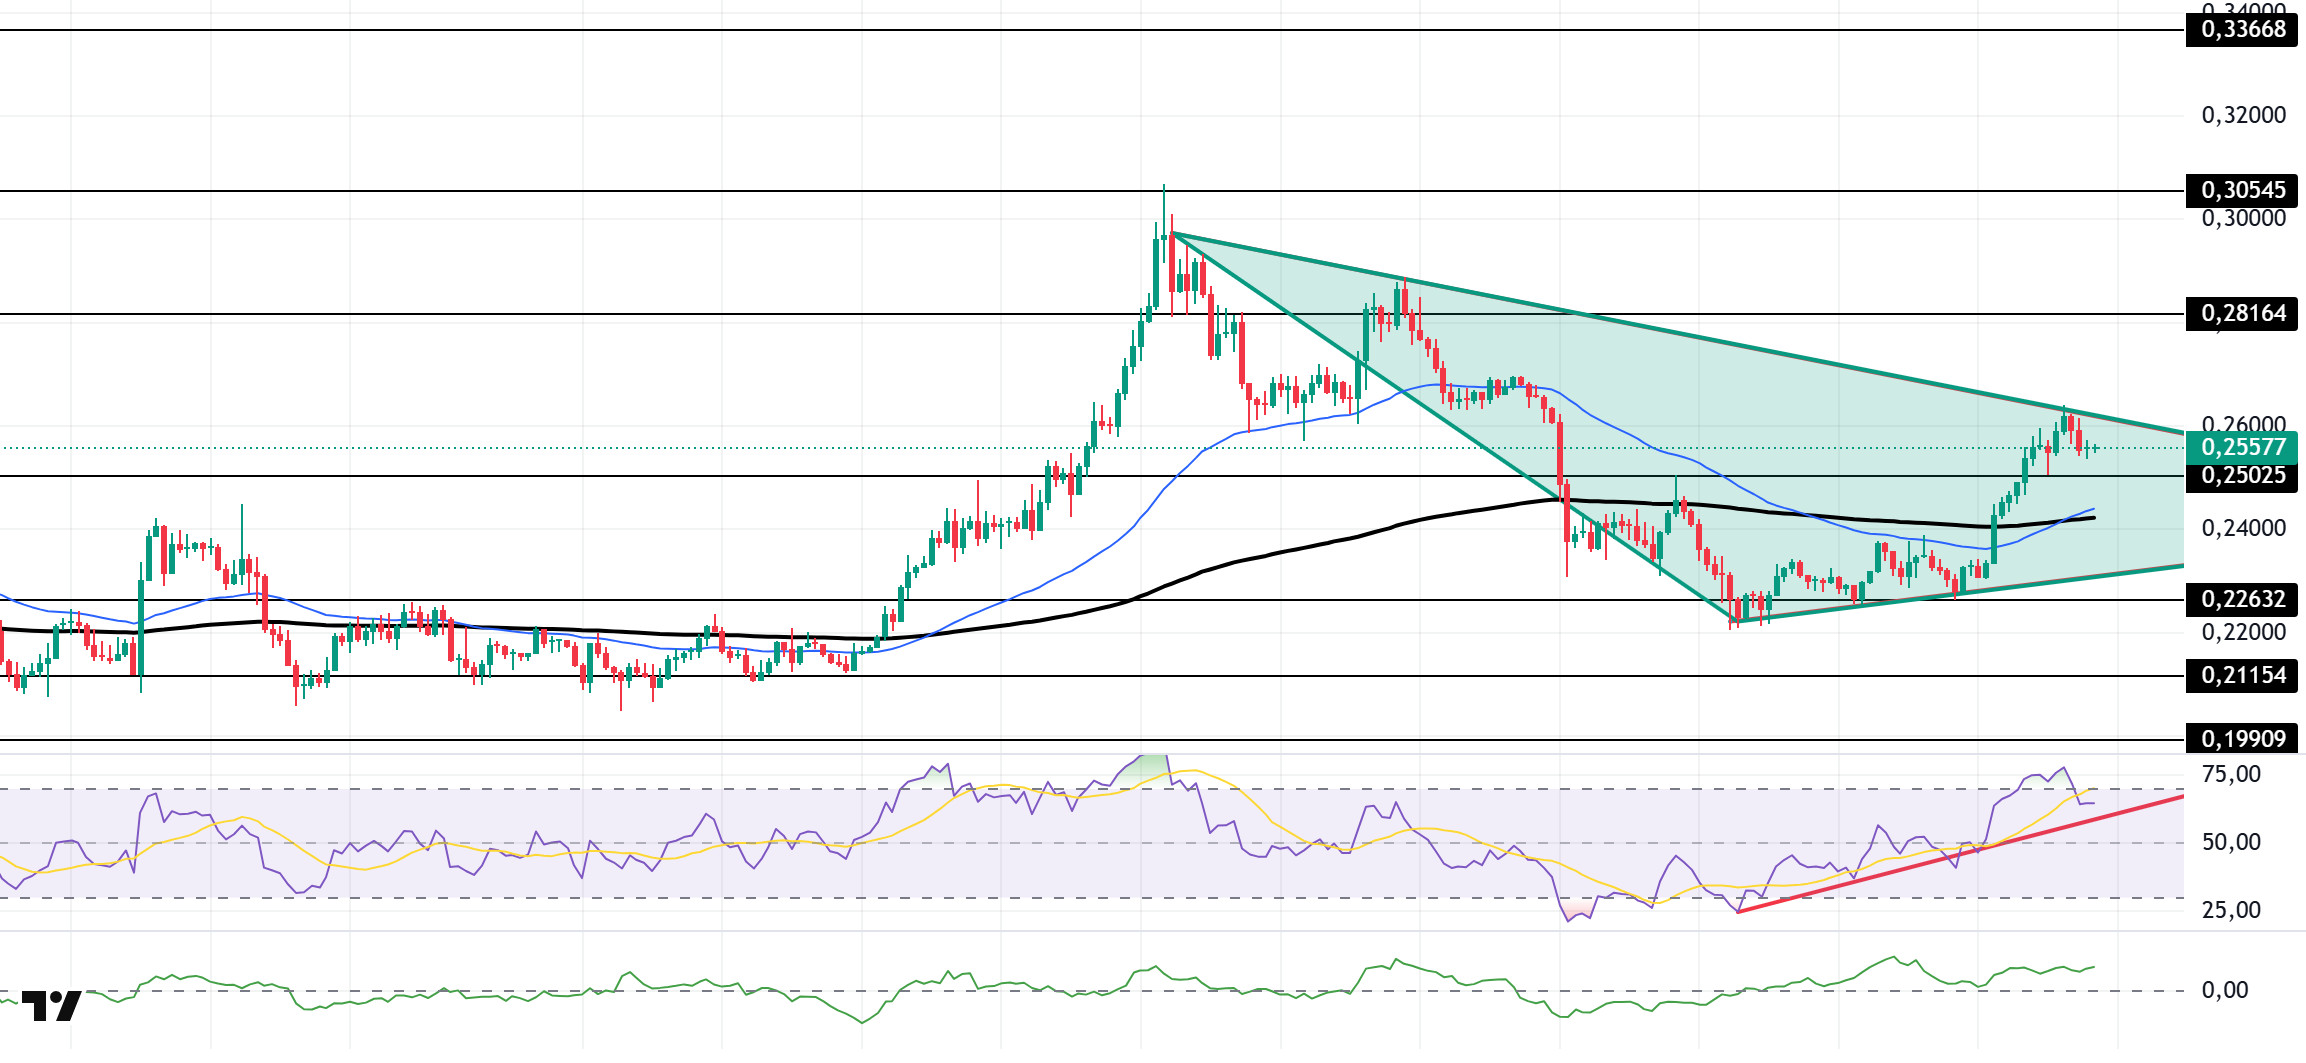
The DOGE price showed a slight decline during the day. The asset continued to remain within the symmetrical triangle formation that began on September 14. Breaking above the strong resistance level of the 200 EMA (Exponential Moving Average – Black Line), the price managed to stay above the strong resistance level of $0.25025 while maintaining its momentum. The asset, which faced resistance at the ceiling level of the symmetrical triangle formation, is currently experiencing a pullback. If the uptrend continues, it may test the $0.28164 level as resistance. In the event of a pullback, it may test the $0.22632 level as support on candle closes below the moving average.
On the 4-hour chart, the 50 EMA (Exponential Moving Average – Blue Line) remained above the 200 EMA (Black Line). This indicates that an uptrend may begin in the medium term. The price being above both moving averages shows that the price is trending upward in the short term. The Chaikin Money Flow (CMF-20) managed to stay in positive territory. Additionally, a decrease in money inflows could push the CMF into negative territory. The Relative Strength Index (RSI-14) gained momentum from the rising direct support that began on September 25 and experienced a slight pullback from the overbought level. It may continue to pull back if profit-taking continues. In the event of an uptrend driven by political developments, macroeconomic data, or positive news flow in the DOGE ecosystem, the $0.28164 level stands out as a strong resistance zone. Conversely, in the event of negative news flow, the $0.22632 level could be triggered. A decline to these levels could increase momentum and initiate a new wave of growth.
Supports: 0.25025 – 0.22632 – 0.21154
Resistances: 0.28164 – 0.30545 – 0.33668
TRX/USDT
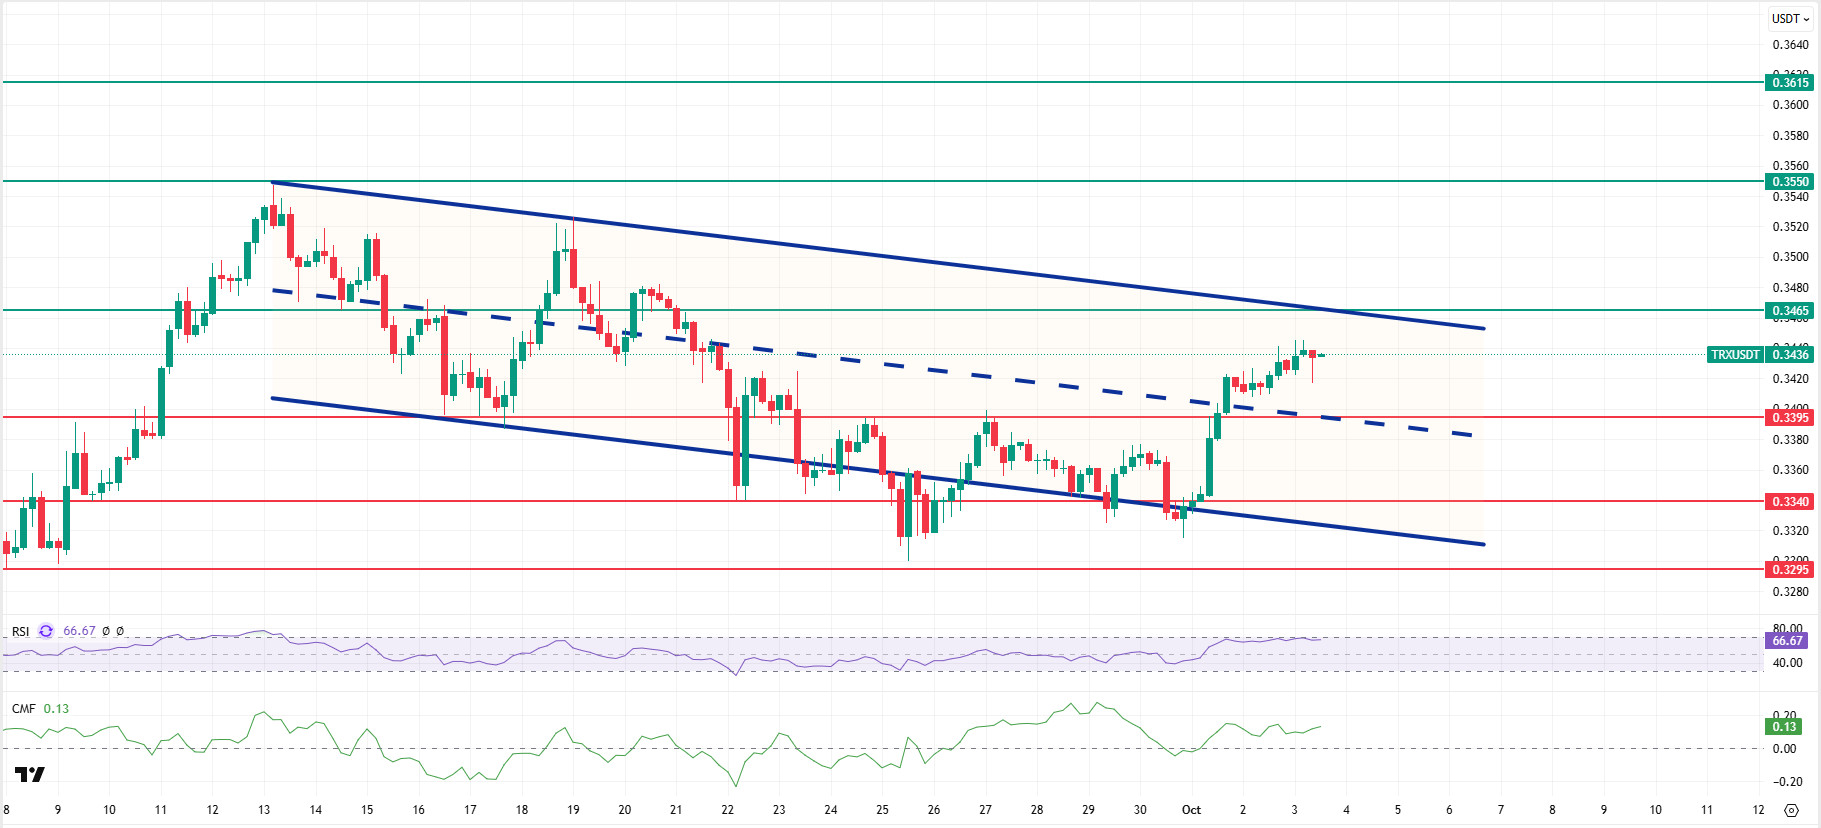
As noted in this morning’s analysis, TRX managed to stay above the 0.3395 support level after the recent decline and continues to move within the bearish channel, currently trading at 0.3436. Currently at the upper band of the bearish channel, TRX is hovering near the 0.3465 resistance level on the 4-hour chart. The Relative Strength Index (RSI) value is seen to be close to the overbought zone at 66. In addition, the Chaikin Money Flow (CMF) indicator continues to remain above the zero level at a value of 0.13, indicating that money inflows are continuing. The CMF remaining in positive territory can be considered an indicator that the price may experience an increase.
In light of all these indicators, TRX may rise slightly in the second half of the day and move towards the upper band of the bearish channel. In such a case, it may test the 0.3465 resistance level. With a candle close above the 0.3465 resistance level, it may continue its rise and break the bearish channel upwards to test the 0.3550 resistance level. If the 0.3465 resistance level is not closed with a candle, the CMF may also move into negative territory, weakening cash inflows and potentially testing the 0.3395 and 0.3340 support levels following a possible decline in price. On the 4-hour chart, 0.3295 is an important support level, and as long as it remains above this level, the upward trend is expected to continue. If this support is broken, selling pressure may increase.
Supports 0.3395 – 0.3340 – 0.3295
Resistances 0.3465 – 0.3550 – 0.3615
SHIB/USDT
In the Shiba Inu ecosystem, two axes stand out in the evening session. YourPOP, one of the leading names in the Shiba community, is strengthening expectations for the new period by pointing out that the decline in exchange reserves and the rally narrative specific to the fourth quarter are boosting investor optimism. On the other hand, the development team announced that they have gradually restored the network after 10 days of continuous work following the exploitation of the Shibarium bridge. According to the shared technical update, assets have been secured, the mechanism that halted the system by distorting Heimdall’s local state with three fake checkpoints has been repaired, the 4.6 million BONE targeted unauthorized delegation deposited by the exploiter to affect validator thresholds has been deleted, and record integrity has been corrected via StakeManager.
As part of security hardening, over 100 critical contracts, including Shibarium, ShibaSwap, and Metaverse, were moved to multi-signature wallets, all validator signing keys were rotated, blacklisting capability was added to the staking side, withdrawal delays extended to approximately 30 checkpoints, and all changes were deployed to the mainnet after repeated testing on Devnet and Puppynet. The process was advanced in parallel with an independent review by Hexens.io, with responsibilities separated into infrastructure, validator operations, test networks, and monitoring to reduce single points of failure. The roadmap going forward includes adding a blacklisting feature to the Plasma Bridge, phasing in bridge functionality, phased withdrawals and limits to ensure fair compensation for affected users, and coordination with partners. On the infrastructure side, the single endpoint rpc.shibarium.shib.io was launched in collaboration with dRPC.org, while a comprehensive documentation refresh simplifying node setup and validator guidelines aims to broaden participation and raise the security bar.
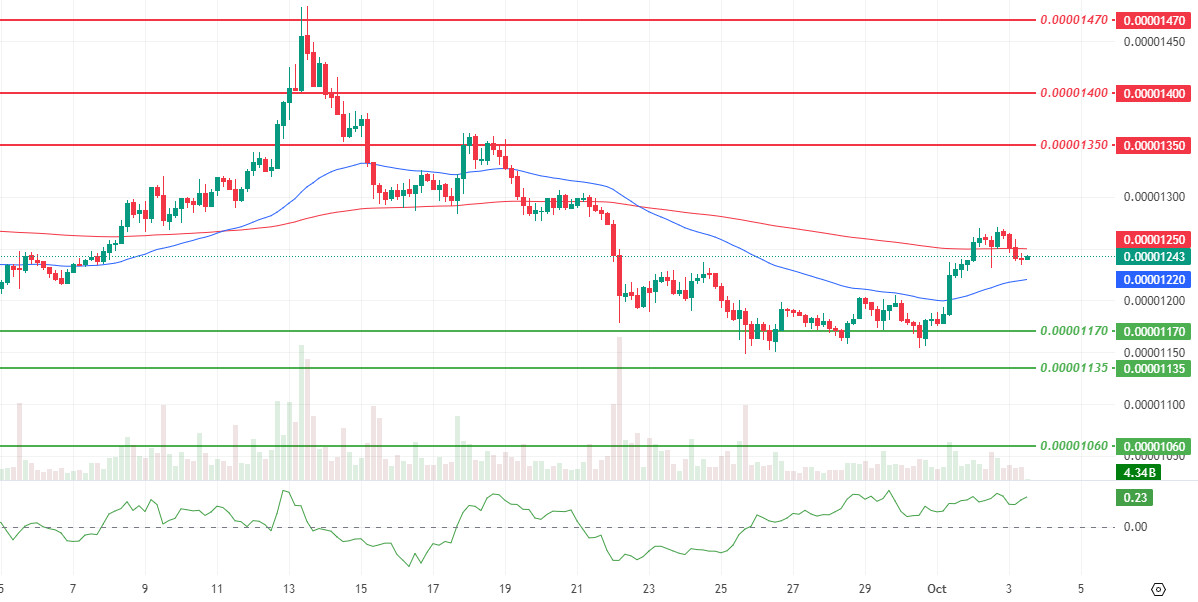
The technical outlook continues to show a weakening trend. The decline in momentum, volume, and volatility continues to push price behavior into a tight band. The Exponential Moving Average (EMA) 200, which we observed in the last review, was lost with a 4-hour close, and the price is hovering around the $0.00001240 level.
Although the Chaikin Money Flow (CMF) remains in positive territory, this positive flow, when read in conjunction with weakening momentum and stagnant volume, indicates that upward attempts may be limited . Persisting below the EMA 200 increases the risk of a pullback towards the EMA 50 region around the $0.00001220 level. Below this region, the $0.00001190 to $0.00001170 level band could come back into focus. In the opposite scenario, a quick return above the EMA 200 and repeated four-hour closes above this region would open the way for a retest of the resistance zone between the $0.00001320 and $0.00001350 levels. In summary, while closing below the EMA 200 keeps the short-term outlook cautious, a breakout requires closes above the moving averages and a noticeable increase in volume. (EMA50: Blue line, EMA200: Red line)
Supports: 0.00001170 – 0.00001135 – 0.00001060
Resistances: 0.00001350 – 0.00001400 – 0.00001470
Legal Notice
The investment information, comments, and recommendations contained herein do not constitute investment advice. Investment advisory services are provided individually by authorized institutions taking into account the risk and return preferences of individuals. The comments and recommendations contained herein are of a general nature. These recommendations may not be suitable for your financial situation and risk and return preferences. Therefore, making an investment decision based solely on the information contained herein may not produce results in line with your expectations.


